Matrix Blog

Brooklyn

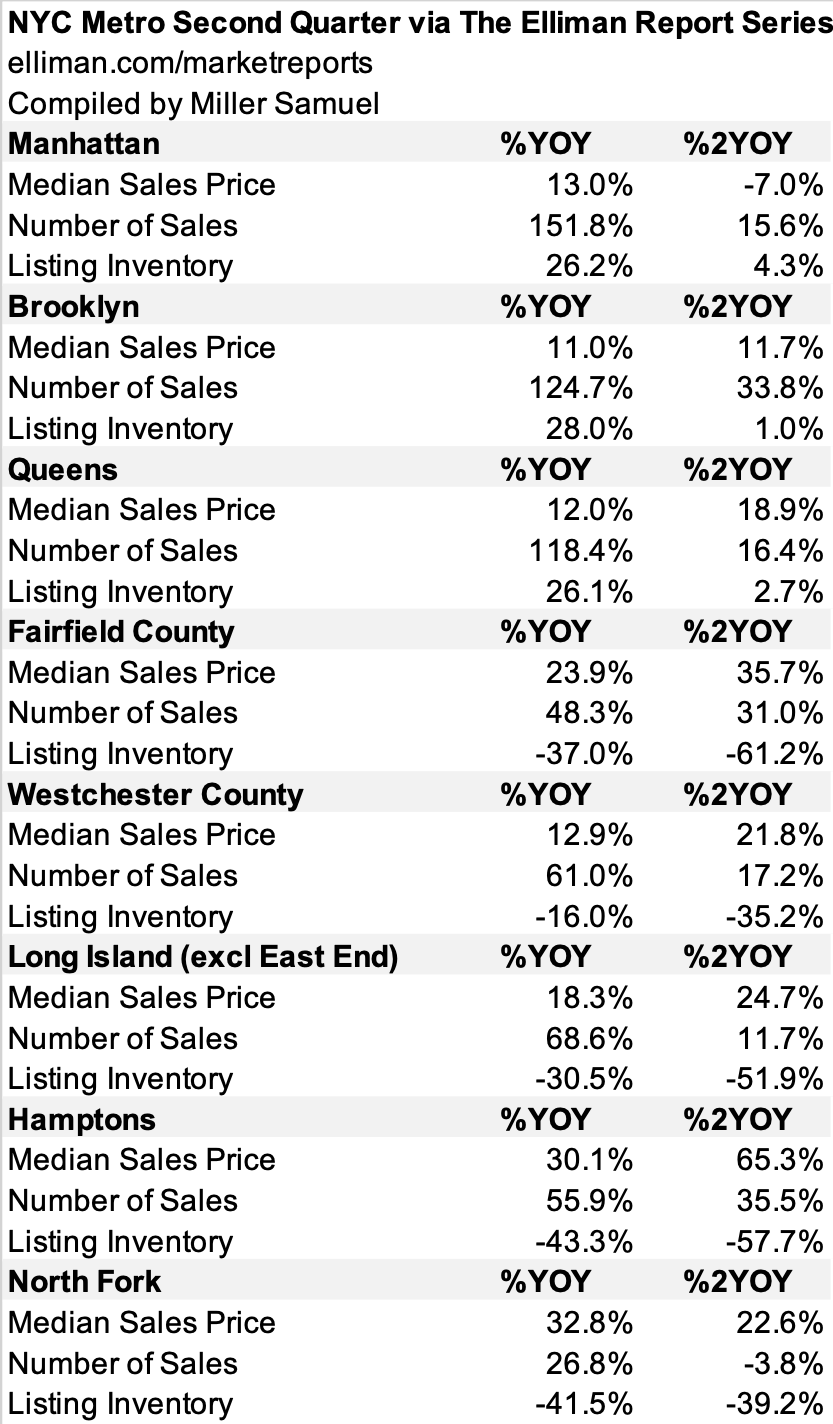
NYC Metro Conditions Much More Robust Than Two Years Ago

August 20, 2021 | 12:56 pm | Infographics |

One of the problems with my normally preferred year-over-year comparisons with metrics to diffuse seasonal impact is that the year-ago period happened to be the pandemic lockdown.

I went through the region using our market report series for Douglas Elliman, comparing the same period two years ago to capture the pre-COV ID market and prices. and sales are up with the exception of Manhattan and North Fork. Listing inventory is up slightly within the city boroughs and plunged in the suburbs.

Tags: ,


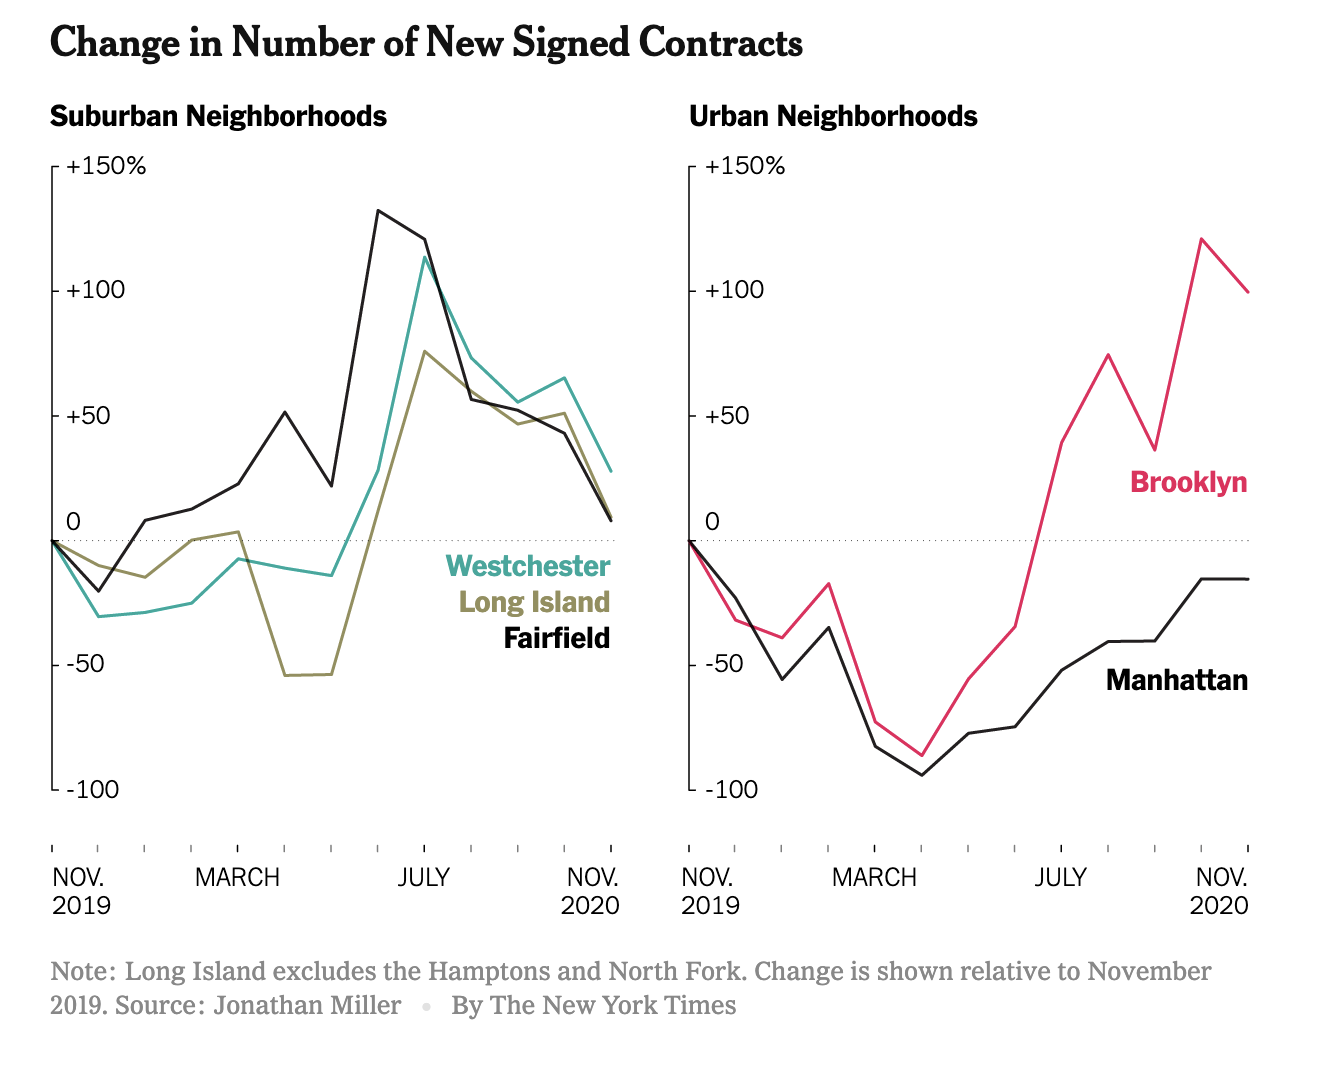
Peak Suburb Has Passed

December 28, 2020 | 2:22 pm | | Explainer |

The New York Times got the market nuances right in their epic end of year The Real Estate Collapse of 2020.

And including epic charts makes it even better.


I noticed that the Streeteasy median rent chart used in the piece shows the same pattern as my recent chart in Bloomberg. That drop in rent is gigantic.


[Source: Bloomberg – click image to open article]

Tags: , , , , , ,


TRD Quick Question: Jonathan Miller “What’s Happening in the NYC Real Estate Market?”

December 28, 2020 | 1:51 pm | | Explainer |

I recently completed a quick interview with Stuart Elliott, Editor In Chief & CEO at The Real Deal who asked me questions with a uniquely mellow intensity. The Real Deal is required reading for anyone in the real estate profession or interested in real estate. Fun.


Tags: , , ,


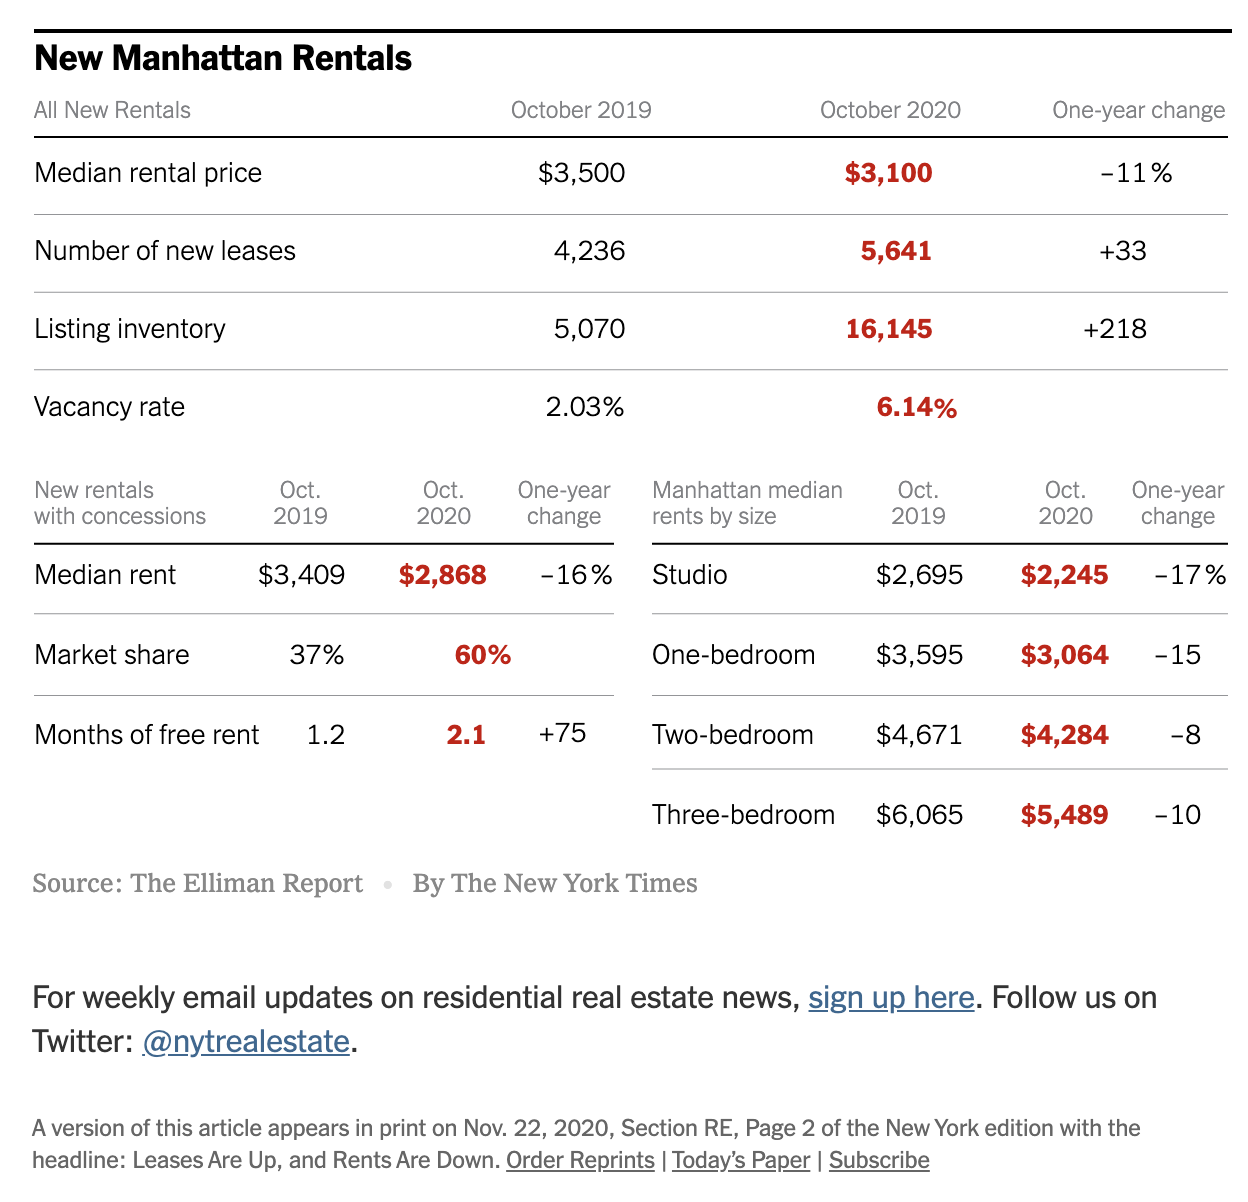
NYT Real Estate: Signs of a Manhattan Rental Market Recovery

November 21, 2020 | 12:49 pm | | Charts |

This weekend’s New York Times Real Estate Calculator column provides a visualization of the recent rental market results in The Elliman Report: October 2020 Manhattan, Brooklyn & Queens Rentals

The Manhattan changes were the most interesting to me – record highs set for the vacancy rate, concession market share, concession amount, yoy% change in median net effective rent overall, studio, 1-bed, & 2-beds. Yet we saw for the first time in fourteen months, a jump in YOY% new lease signings and the highest October new lease signing total on record.

The significantly weaker rental market final hit a point that caused demand to begin to flood back into the market.


[click to open article]

Tags: , , ,


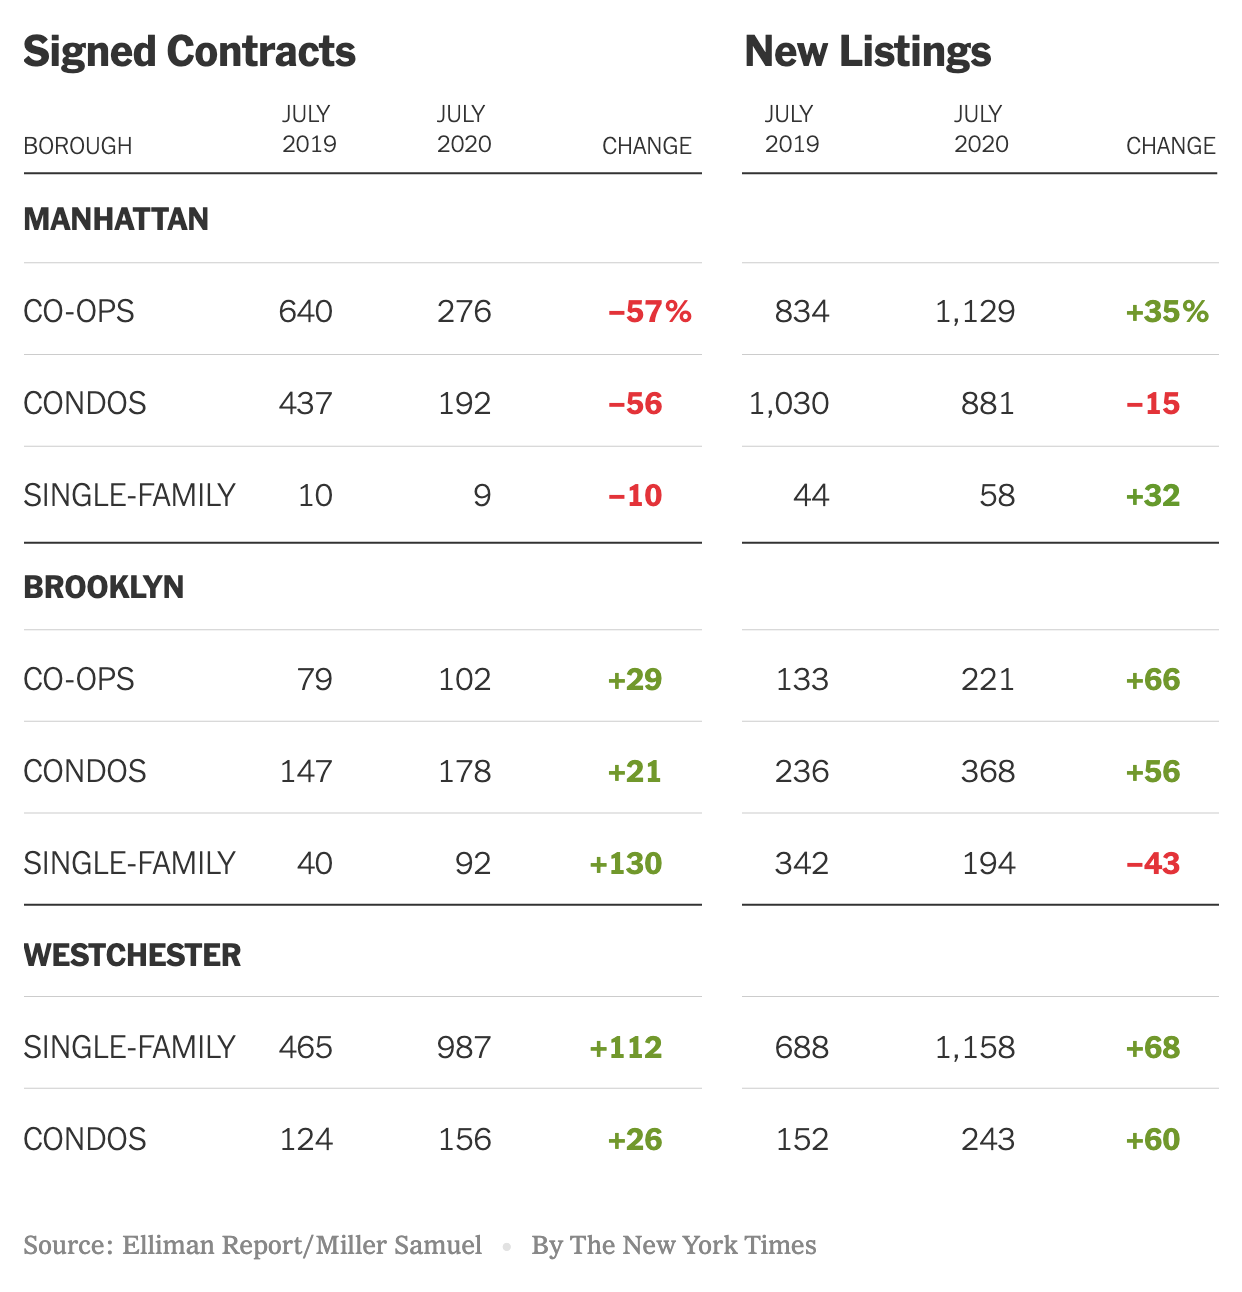
The ‘Urban To Suburban’ Narrative Is Really ‘Manhattan To Suburban’

August 19, 2020 | 1:26 pm | | Charts |

This post previously appeared in the August 14, 2020 edition of Housing Notes. I’ve been writing these weekly summaries on housing topics for more than five years. To subscribe for free, you can sign up here. Then you can look forward to each issue every Friday at 2pm New York Time.

The New York Times created a terrific graphic on our Elliman New Signed Contract Report by illustrating the performance of Manhattan and Brooklyn versus Westchester County. Brooklyn’s sales market performance is closer to Westchester than it is to its city counterpart.


Tags: , , , ,


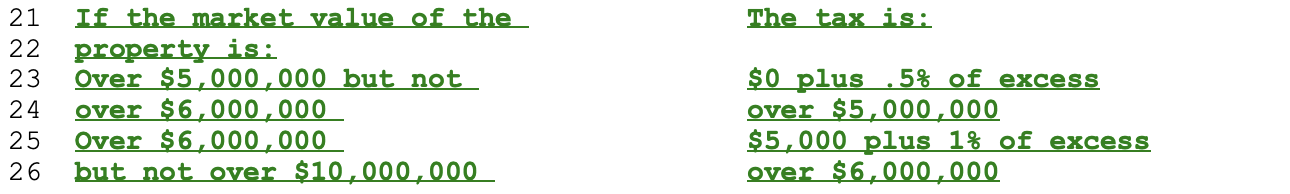
The Proposed NYC “Pied-A-Terre Tax” Looks Catastrophic to NYC Real Estate

March 19, 2019 | 11:48 pm | Investigative |

An earlier version of this post appeared in my weekly Housing Notes, March 15, 2019 edition. I’ve since added more information and insights as the situation unfolds.

This proposed NYC “pied-a-terre” tax law has a name that infers it concerns “pied-a-terres” when in fact that property type is but one part of the property types that are impacted. I’m sorry about the length of this piece but please read on.

The New York state political zeitgeist was recently and suddenly tilted against luxury development in New York City. If this latest turn of events plays out as written, we’ll be able to look back at this era as a milestone where the supertanker began to turn in the wrong direction for the new development multi-family industry.

The White Paper That Started It All

The Fiscal Policy Institute proposed the tax in 2014, and it has been floating around Albany ever since. At the opposite end of the spectrum, the fiscally conservative Citizens Budget Commission described the tax as appealing but problematic:

Gov. Andrew Cuomo’s office suggested last week that such a levy might reap $9 billion for the moribund Metropolitan Transportation Authority over the next decade and Assembly Speaker Carl Heastie reiterated his chamber’s support proposal at a Crain’s breakfast forum days later. Mayor Bill de Blasio gave it his blessing as well.

In the original 2014 proposal by the Fiscal Policy Institute, the first item in the proposal is off to a bad start as they describe what happened in the market:

These owners bid up the price of NYC residential real estate, and since they don’t spend much time in these units, contribute little to the local economy compared to full-time residents.

Wrong. A large swath of high-end condo market activity of the past five years are non-primary residences which include pieds-a-terres but most are investor purchases that are subsequently rented after the unit closes when construction was completed. The majority of new development units purchased as non-primary were rented out which is why the high-end rental market was crushed by all the new development condo sales by investors. Renters in these units do spend and help drive the local economy. Manhattan is about 75% rental by unit and New York City is about 2/3 rental by unit. It is therefore clear that renters drive a large swath of the NYC economy. Why would renters of high-end apartments be any different than all renters? They eat, sleep, work, and consume. FPI’s apparent belief that most of the high-end development sold ended up as empty pied-a-terres while wealthy buyers bid up the prices is incorrect. This position seems to be derived from one of only two references cited in the FPI white paper, a fun New York Magazine cover story by Andrew Rice. That article came out in 2014 right as the housing market was peaking. The strengthening dollar was cooling demand via international currency plays and the sight of cranes rising everywhere told buyers that an oversupply was here (that still exists today with over 6 years of excess new development product. I was one of the resources for Andrew Rice’s piece and here I explain what happened leading up to the 2014 condition which I later dubbed “Peak Luxury” and “Peak New Development”.

Much of this speculation is being driven by two factors: sparse supply, due to the absorption of the inventory left over from the last boom, and fast-rising prices. Manhattan saw a 30 percent price increase over the past year, on average, which market analyst Jonathan Miller attributes primarily to sales closing in ultraluxury buildings. The highest end of the market has seen stunning inflation.

In other words, the 30 percent price rise wasn’t a “bid up” by wealthy buyers; it was a massive shift in the type of housing stock that was being created and sold. New building materials and engineering enabled 100 story buildings instead of 50 story buildings. Landowners factored this into land prices since many buildings above the 50th floor had expansive open views and (not enough) buyers were willing to pay for it. Prices rose significantly in lower-priced segments (below $5 million) because supply was static and no match for a rising population and the city’s record job growth.

Developers are in the business of developing, and land prices remained high after the housing bubble burst a decade ago because of the large amount of money that was flooding into development. Central banks worldwide pressed rates to zero, creating an army of global investors chasing higher returns. To keep developing despite all this new capital, developers had to build what land prices required, high-end real estate. Developers would create affordable housing if it realized a higher return on the risk they take on. While it has always been difficult and expensive to build in New York City, the post-financial crisis was especially challenging with heavy competition for labor, materials, and land, exacerbated by free-flowing global capital in a low-interest-rate world.

Now the buyers of this real estate, who committed to New York City, are being punished by this new tax, the result of which will damage the city’s global brand that took 25 years to evolve. Why? Because a white paper with only two reference citations, one of which was a magazine article on a small niche of super-tall buildings, was the basis. I am also concerned that the paper did not address the change in consumer behavior when such taxes would be implemented. Why would they push to implement a new tax when it raises the probability that existing tax revenues will fall? To get specific here’s what happened after this article was written. The building known as One57 on the cover of the cited New York Magazine story – 5 years later and after 8 years on the market is 25% unsold and resale activity (the same unit purchased from the sponsor and then sold again) shows as much as a 30% drop in prices since this article was written.

This drop is why I think that the implementation of this new tax as written will be catastrophic to the market, potentially causing it to seize up. As a result, the city would see a significant drop in transfer tax and other associated revenues before considering the new tax. Hit a declining market with more than 6 years of excess supply with a new high tax out of the blue and watch what happens.

The Political Timeline

The shift in New York State and New York City government sentiment against real estate development began with the following recent events:

The proposed law is in each New York State Albany chamber right now and although they have different introduction dates of January 9, 2019 (Senate) and February 4, 2019 (Assembly) they look the same.

The New York State Assembly version: Assembly Bill A4540 or in this format.

The New York State Senate version: Senate Bill S44 or in this format.

The bills are short on details and are currently in committee, wide open for interpretation. As written, the bill is both sweeping and ominous to the real estate industry in New York City, and I expect it will result in less overall tax revenue to the city than currently enjoyed. I’ll get into that further on.

How this proposed S44/A4540 tax seems to work

I am not a tax advisor, and anything I say here should not be relied on, and you should seek appropriate counsel. Seriously. I am merely interpreting what I think are the critical issues established this proposed tax.

  • This tax directed is specifically at New York City because it is designated for cities in the state with populations of more than 1 million. As evidenced by the 2010 census data in Wikipedia, there is a significant population difference between New York City and Buffalo.

You probably think of the market value of your co-op or condo as the price you could sell it for on the open market. However, State law requires us to value residential cooperative and condominium buildings as if they were rental apartment buildings. This means that we look at the income and expense statements of rental buildings that have similar characteristics to determine your condo or co-op buildings market value.

  • It taxes residential properties valued at $5 million and above in NYC, most of which are in Manhattan.
    • And it is a marginal rate tax – only the amount above each threshold is taxed.


    • And it is a property tax which means it will be paid annually, not just upon sale like the Mansion tax. Here is how consumer behavior is impacted by the $1 million threshold of the New York State “Mansion” tax. I did this a while ago, and the pattern still exists. As an annual property tax, the dollar thresholds will be more firm.

  • The tax is not really about pied-a-terres. It is a tax on non-primary residences as written.

Therefore it should apply to investor units and LLCs.

I don’t think it is unreasonable to assume that the language of the bill infers that LLCs could be interpreted as “non-primary residences” even if they are used for primary residences since New York State defines LLCs: An LLC is an unincorporated business organization made up of one or more persons. That definition does not sound like a primary residence to me.

Although the working title of the proposed tax is “pied-a-terre” there is no mention of this particular use in the Senate or Assembly tax bills. They specifically refer to “non-primary residences” so that would include other uses like investor units and possibly LLCs (possibly even those used as primary residences). It’s all still up in the air at this point.

From the New York Times article of March 11, 2019: Lawmakers Support ‘Pied-à-Terre’ Tax on Multimillion-Dollar Second Homes

In 2017, New York City had 75,000 pieds-à-terre, up from 55,000 such units since 2014, according to the New York City Housing and Vacancy Survey. The share of vacant apartments that are classified as pieds-à-terre has held steady during that time at about 30 percent.

From the New York Times article of October 26, 2014: Pied-à-Neighborhood

“If you said you are going to impose a special surcharge on apartments that are worth more than $20 million, that would be perfectly legal,” said Peter L. Faber, a partner at McDermott Will & Emery. “But the problem comes when you start imposing a special tax on nonresidents. That is unconstitutional under the interstate commerce clause.”
The current revenue estimation appears overstated by nearly a third

The bill’s sponsor, New York State Senator Brad Hoylman said:

There are only 5,400 units in New York above $5 million that are owned by non-residents.

For the year 2018 my ACRIS search yielded 952 residential single units sales (1-3 family, co-ops, condos) above the $5 million threshold (1,188 in 2016 and 1,173 in 2017).


I will assume that the Senator included all the apparent nuances within the 5,400 count for the entire NYC housing stock (pied-a-terres, investor units, LLC-owned primary and non-primary residences).

I projected this mix of sales as proportional to the 5,400 units impacted by the new law to break out the tax revenue calculations, understanding the 2018 sales included both primary and non-primary residential uses.


[click to expand]

From the New York Times article of March 11, 2019: Lawmakers Support ‘Pied-à-Terre’ Tax on Multimillion-Dollar Second Homes

It was not immediately clear how much money the tax would raise; the office of the city comptroller, Scott M. Stringer, estimated that a pied-à-terre tax would bring in a minimum of $650 million annually if enacted today. And based on the expected revenue stream, Mr. Cuomo estimated that the state could then raise $9 billion in bonds, backed by the expected taxes paid by pied-à-terre owners.

Based on my calculations, the tax-impacted housing stock would yield tax revenue of roughly $455,000,000 which is about 30% below the $650,000,000 estimate assuming this new tax would not impact any current consumer behavior of the wealthy who would be affected by the tax… which is a GIANT assumption that is patently not true.

Impact to Housing Prices

Using the median sales price of each price traunche set up in the bill, and assuming a 5% discount rate and the median tax for each traunche and a 10 year holding period, the adverse impact to value rises in each higher traunche.

I’ve added 20-year and 30-year holding period versions using the same variables. I started out using the 10-year as a placeholder for the brokerage industry’s default assumption of 7 years for homeownership but then added 3 more years to account for the current market slide. The 20 and 30-year holding periods assumptions might be more realistic given the long term view of investors after the decline in prices of the past several years and the phenomenon of capital preservation in this latest development frenzy since 2012. If that’s the case, properties valued at $25 million or higher might lose 30% of their value overnight…not factoring in a market pause or even collapse in sales until the terms are ironed out. That period of uncertainty starts now through July 1, 2020.


[click to expand]

More New Yorkers Will Leave The City

From the New York Times article of March 11, 2019: Lawmakers Support ‘Pied-à-Terre’ Tax on Multimillion-Dollar Second Homes

Moses Gates, a vice president at the Regional Plan Association, disputed the notion that New Yorkers would leave the city. The association believes that most wealthy pied-à-terre owners would pay the tax. If they chose to sell, then the property has the chance of being purchased by a full-time city resident, who would then be subject to income and sales tax.

It is already happening. His assumption does not take into consideration the new federal tax law enacted on January 1, 2018, that was especially punishing the wealthy real estate property owners that were already considering moving their domicile to a low tax state like Florida. The wealthy who already were on the fence before the new law are now beginning to make their moves. You can see this happening in Florida right now. New Yorkers are the new foreign buyer there. This proposed pied-a-terre tax piles on to the fresh new federal taxes just served to wealthy property owners in NYC metro last year, and sales were already slowing.

Taxing Wealthy Property Owners Around the World

The trend of raising tax revenue on real estate of the wealthy is gaining momentum worldwide. New York City had the distinction of being one of the few major global cities that have not implemented taxes that are openly hostile to foreign buyers or investors. Here is what some countries are doing to tax these buyers and it is slowing sales.

From the New York Times article of February 9, 2019:

Large cities around the world have been grappling with how to make wealthy absentee property owners pay for the privilege of owning secondary residences, a recent report from the Real Estate Institute of British Columbia shows. Sydney, Paris, and London have all recently added or increased taxes on the purchase of secondary homes.

In Hong Kong, nonpermanent residents pay a 15 percent fee on the value of the home, and foreigners pay an additional 15 percent fee. Singapore has restrictions on the purchase of residential property by foreigners and a 15 percent tax. In Denmark, foreigners are required to obtain permission from the government to purchase secondary homes.

In Vancouver, where the greatest concentration of vacant properties is downtown, owners of empty residential properties are charged a 1 percent tax based on the assessed value.
Why Senate Bill S44/Assembly Bill A4540 Will Not Achieve Its Intended Goal As Found Money for MTA Improvements
  • This bill may obliterate future transfer tax revenue from real estate activity and could result in lower net receipts from the real estate sector in the aftermath. The 2014 whitepaper doesn’t consider this but instead presents the tax in a vacuum as if market forces don’t respond.
  • New York City is one of the last “international cities” that is not hostile to foreign buyers and real estate investors
  • The new tax is targeted to condo development since there are few co-op and townhouse non-primary units over $5M
  • The new tax will crush new development activity because land prices will take years, maybe even more than a decade to reset to levels that will support new affordable housing because landowners take long-term buy and hold positions
  • This tax could destroy any progress made with inclusionary zoning to create more affordable housing
  • This tax will not create more affordable housing
  • The idea of the building of “bank safety deposit boxes in the sky” and saying pied-a-terre owners don’t spend money in the city is misleading. Most of the taxed units have occupants that do just that. Many non-primary residences are occupied with renters and those occupants spend money on a daily basis. The actual pied-a-terre segment is a subset of non-primary residences
  • Aspects of this bill might be illegal such as the disconnect in valuation methods to calculate property taxes versus this new tax – state law requires co-op/condos to be valued as income properties and this new law wants the sales comparison approach
  • Luxury real estate buyers do not ignore new taxes as is commonly pontificated. That never happens and I’m not sure where that form of conventional wisdom came from. As such there will be substantial damage to high-end property values going forward, perhaps as much as 30% if not more than that. With the news of this new tax, we expose the market to a panic selloff as existing owners look to take their lumps and get out as new sales pause.
  • The damage to the housing market above the $5 million threshold will not be contained and will likely melt into the layers below it as market stigma expands.
  • The suburban markets, as key competitors to NYC in the immediate area, may actually benefit within their respective high-end markets as NYCs brand damage and new tax may incentivize city buyers to look closer at alternatives in NYC suburban metro as well low-cost areas such as Florida.
Pausing the Market While Politicking

At a bare minimum, the guaranteed uncertainty of the bill’s final form from April 1, 2019 when it is enacted and July 1, 2020 when it is implemented, will help “pause” sales starting now. Sales at the top of the market will slow further than they already have. This uncertainty will have a significant impact on market participants as they wait for Albany to sort this out and will play a significant roll in impacting transfer tax revenue as the market cools further.

There is a strong political appetite for this to be part of the budget. I can only imagine the heavy volume of lobbying and litigation activity to occur between now and July 1, 2020. There is a need/hunger for more revenue by the governor and the mayor for the MTA – which will include a lot of lobbying and litigation since everyone wants a piece of this. Unfortunately, the Real Estate Board of New York does not have clout in Albany political circles but they appear to be working hard to reduce the damage this bill will cause to new development (with a by-product of reducing the loss of existing tax revenues). Whatever happens to this bill, it will probably damage the credibility of the bill’s author, the Fiscal Policy Institute who will learn that market forces do matter and policy should never be considered in a vacuum.

On a positive note, present circumstances included, the impact of this tax bill is so over the top and disconnected from market forces that I would expect the lawsuits and negotiation to be significant and improve the odds this bill will be converted into something less catastrophic. The Senator who is sponsoring this has seemed to suggest this in interviews.

History Fades and so do Lessons Learned

Remember the 1970s version of New York City? The success the city is enjoying now was the result of 25 years of proactive management of city spending and branding efforts. Besides record tourism, real estate activity has been revitalized and that has brought billions of dollars to the city coffers. The introduction of this new tax law ignores human behavior and assumes the tax revenues will rise as if market forces don’t exist. The wealthy will not shrug off these heavy new costs. They will simply go elsewhere. New real estate taxes, especially significant ones, change consumer behavior almost immediately.

If the objective is to punish the high-end housing market and the development community, then this bill will do that. If the objective is to generate new tax revenue for MTA, it won’t. In fact, I believe it will cannibalize existing related tax revenue streams after all the mayhem it causes to the new development industry.

Let’s hope economically informed voices are able to make themselves heard during this process.

I’ll be providing additional insights on this important and developing issue in my weekly Housing Notes. You can sign up for free right here.

Tags: , , , , , , , , , ,


Elliman Magazine Winter 2019 – Market Update

December 14, 2018 | 3:18 pm | | Charts |

The Winter 2019 Issue of Elliman Magazine was just released. I provided a two-page spread showing various market tidbits on random U.S. markets where Douglas Elliman has a footprint. The magazine is well done and a good aspirational read.


[click to expand]

Here’s the full online version of the magazine:

Tags:


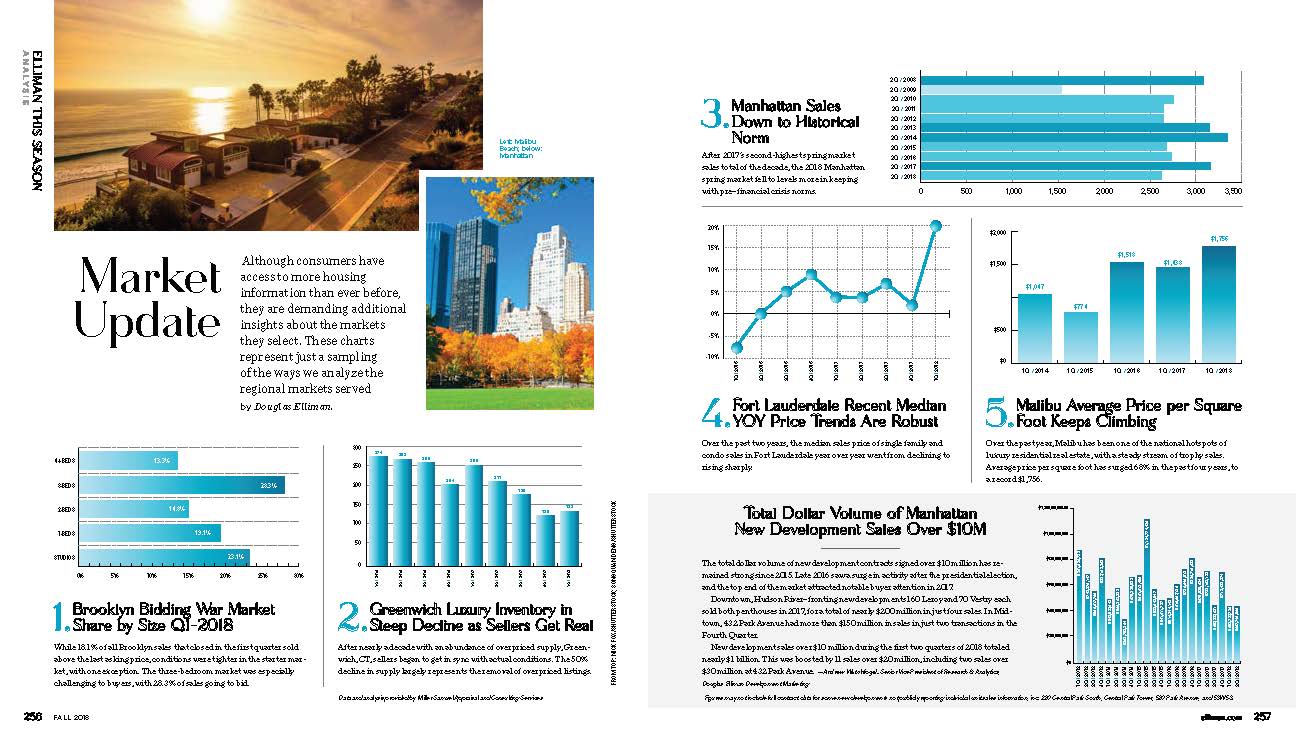
Fall 2018 Elliman Magazine – Market Update

September 7, 2018 | 10:00 am | Infographics |

The Fall 2018 Issue of Elliman Magazine was just released and as usual, I provided a two-page spread showing interesting (my definition, lol) of what is going on in some of the markets under their national footprint. The magazine is well done and a fun aspirational read.


[click to expand]

Here’s the full online version of the magazine:


Tags:


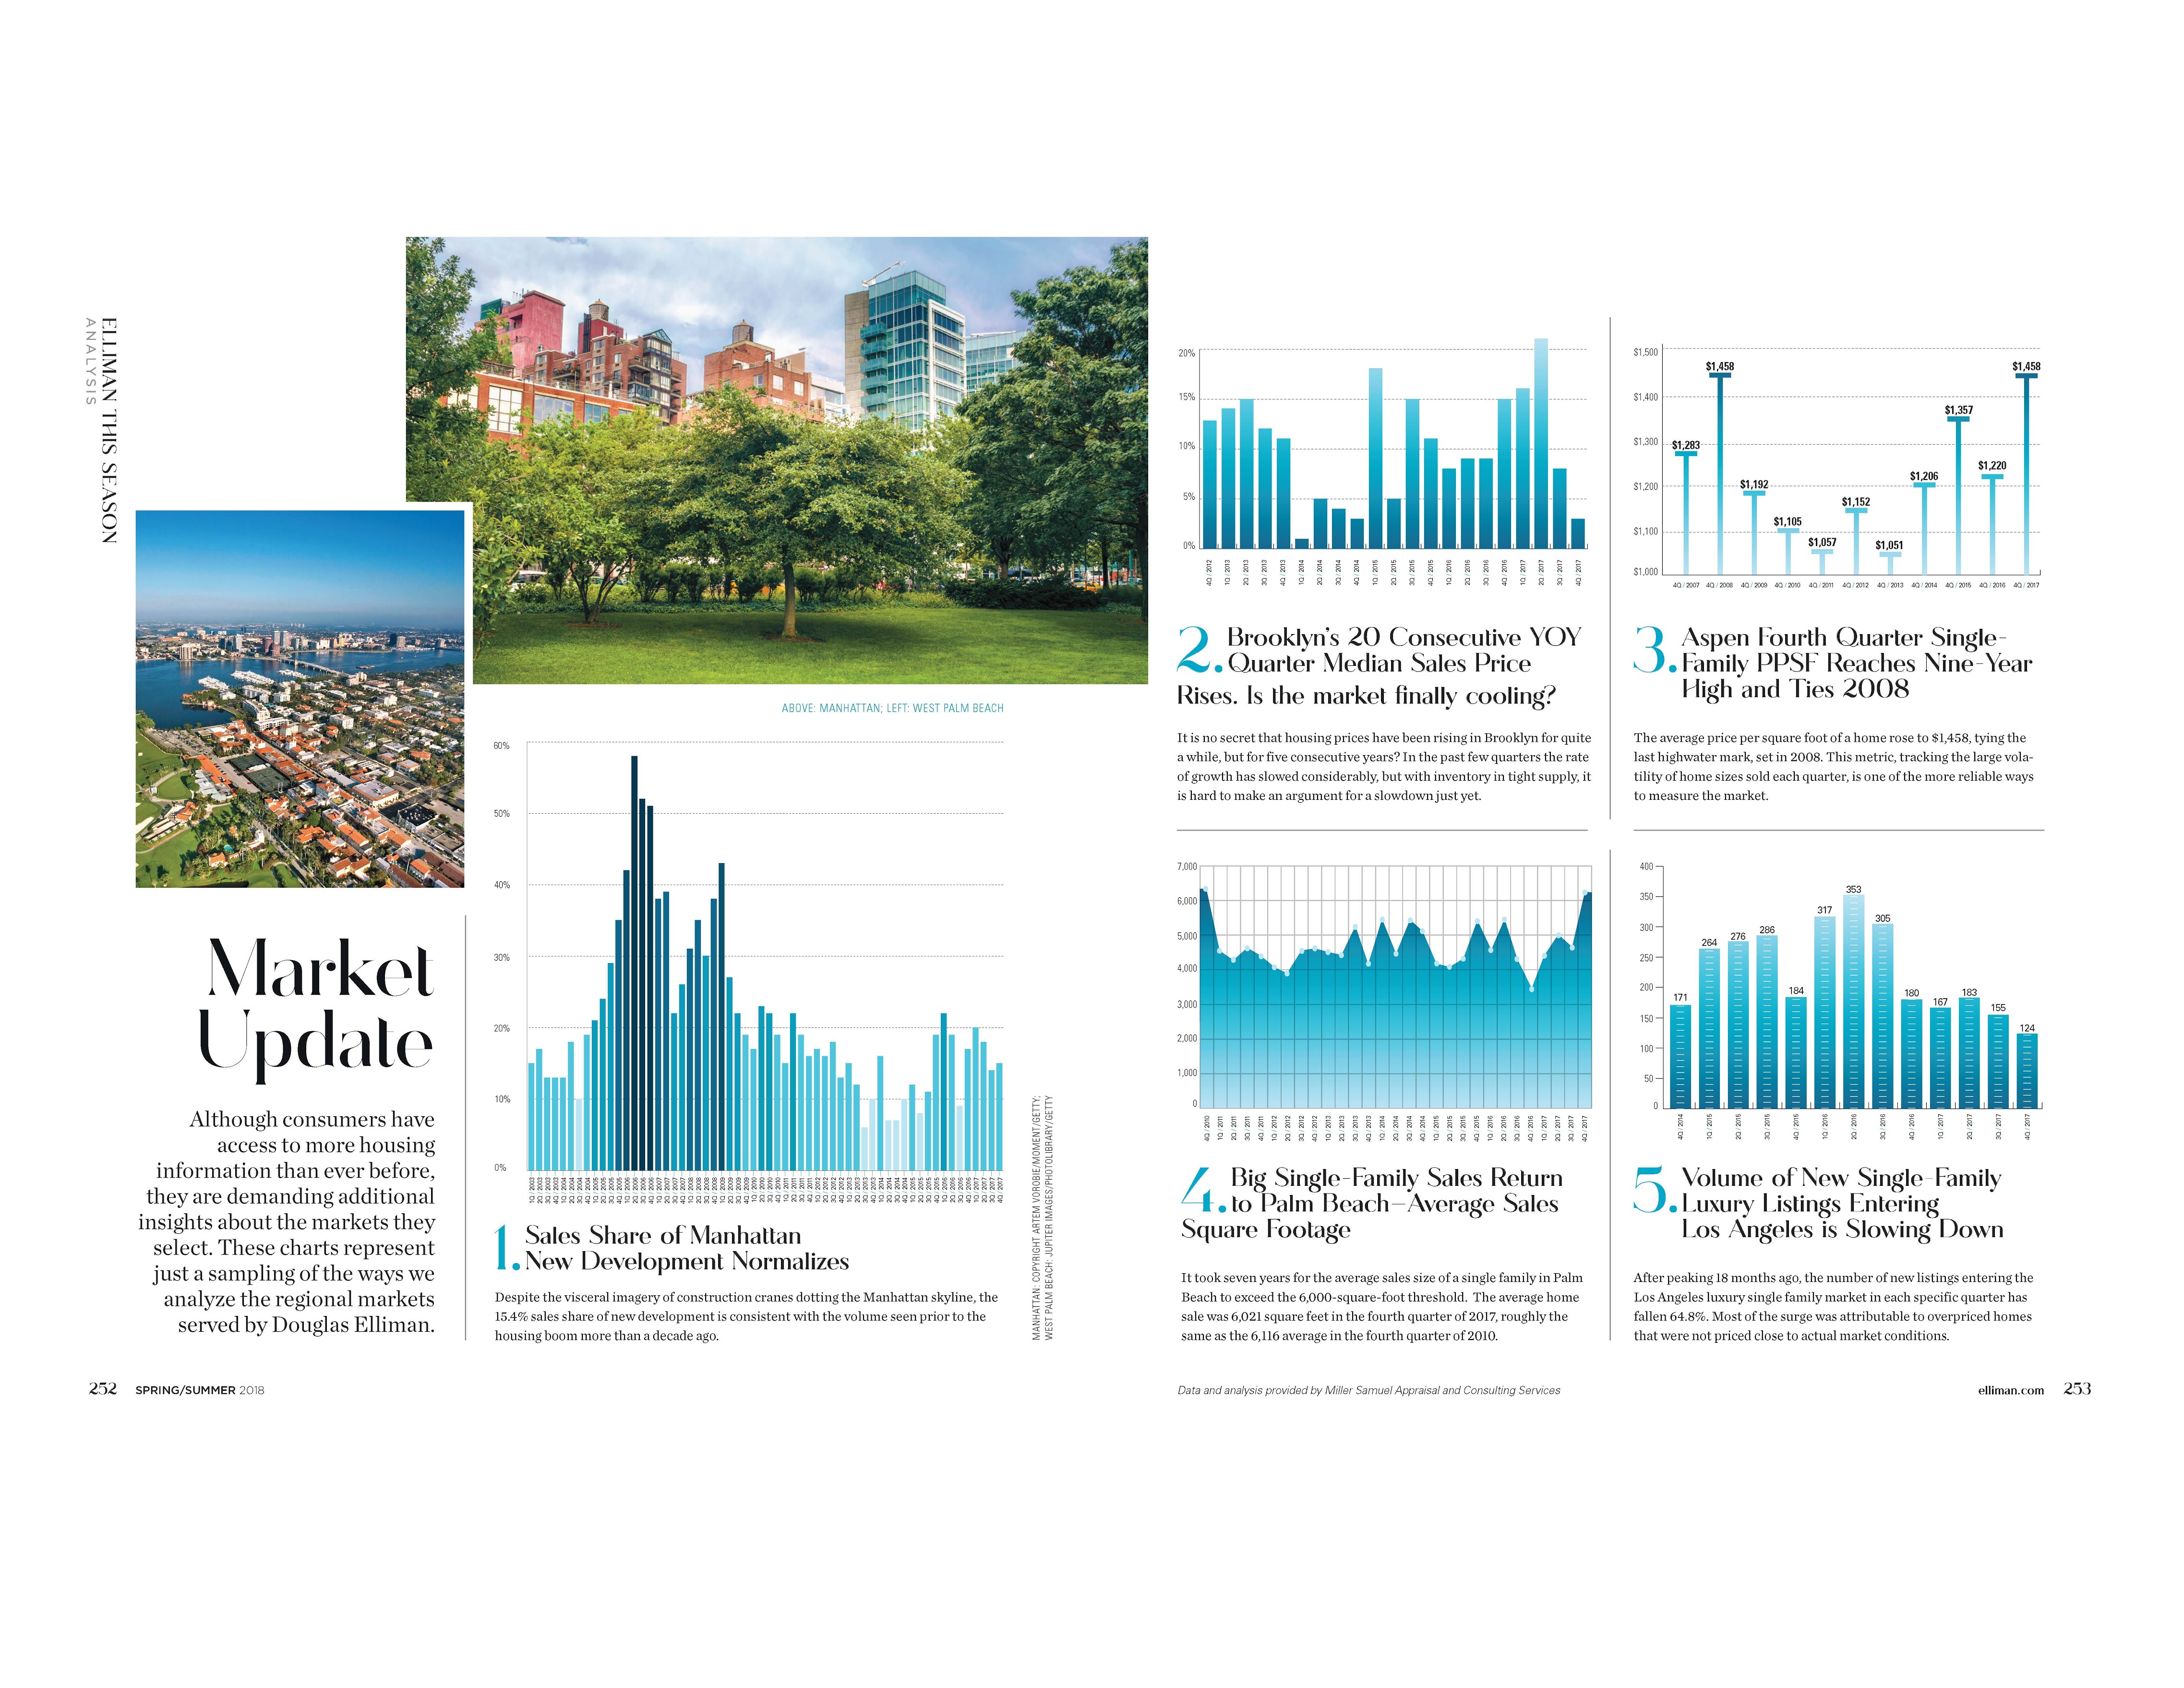
Elliman Magazine Spring Edition – 5 Charts

April 15, 2018 | 4:10 pm | | Infographics |

Every seasonal edition, Douglas Elliman Real Estate asks me to provide a visual market update for their magazine in any 5 of the markets they cover nationwide. The following graphic is found in their latest Elliman Magazine.

Click on the following graphic to see my charts in all their majesty.

Tags:


[Media] Bloomberg Markets Interview January 11, 2018

January 11, 2018 | 11:07 pm | | Milestones |

So I was walking down Fifth Avenue in Midtown Manhattan in the late morning after a meeting and got a call from Bloomberg TV. Apparently, two different stories that featured two of the market reports I author – published by Douglas Elliman – were the number one and two most emailed on the Bloomberg Terminals worldwide.  They wanted to talk about them.

So I took a left and walked over Bloomberg HQ.  Got to speak with Vonnie Quinn and Shery Ahn on set – who knew how to make an interview go well.

This is a 2-minute clip of the 5-minute interview, but you’ll get the gist. I’ll expand on this discussion tomorrow at 2 pm when my weekly Housing Note is released.

[click to view video]

Tags: , , ,


John Burns Has It Wrong, Luxury Home Sales Are Not Increasing

December 11, 2016 | 8:56 pm |

Last week a newsletter from John Burns Consulting got big SEO points by exclaiming that Wall Street Has It Wrong: Luxury Home Sales Increasing. Normally his firm is a good source of housing research, but this time they missed the mark on New York City, even when using facts.

While facts are provided and luxury sales are rising in markets like DC, there is a lack of proper context and this is a challenge that national analysts face when looking at specific market subsets. In this analysis, the luxury market was arbitrarily defined as having a $600,000 threshold. In a number of high cost housing markets on the following chart, their luxury threshold is equivalent to the entry or middle market, which I agree, is booming.

I took a look at markets I report on: Kings County (Brooklyn) and Manhattan. Their respective median sales prices of $735,000 and $1,073,750 are higher than $600,000. The John Burns definition for luxury would include more than half of these respective housing markets.

jbc-yoysalesabove600k

Besides the random threshold selection, their reasons seem to be weak. This list of common perceptions that would explain our underestimate of the strength of the luxury sales market are provided by them. I provide a subsequent clarification for each.

1. New disclosure laws. Foreign-buyer activity has slowed in two high-profile markets, Manhattan and Miami, due to threat of enforcement of new disclosure laws that began in 2016.

The market in both of these markets actually slowed sharply well before the new disclosure laws were in place. And foreign buyer participation in NYC has long been over-hyped.

2. High-profile Florida second-home markets. High-priced homes have indeed slowed in two of the highest-profile second home markets in the country, Naples (Collier County) and Palm Beach. These are two of the six counties where sales have declined.

Again county-wide prices set way below the actual luxury market may be the problem. Within Palm Beach County, I cover Palm Beach and the luxury market starts just below $5 million. In arguably the most expensive city in this county, the median price for all property types is just below their $600,000 luxury threshold.

3. Fortune article on Greenwich, CT. The sales slowdown in high-profile Greenwich, CT, was featured in Fortune magazine. The article included some very misleading headlines about a national luxury slowdown that were supported only by the fact that prices have appreciated 5% at the high end compared to more appreciation at lower prices.

This is an odd interpretation of the Greenwich market. I track this market in my research, live near it and have relatives that live there. This Fortune article was not misleading. Prices have not appreciated 5% at the Greenwich high end and $600,000 might not even buy you a starter home there. In fact, their luxury market has still not recovered from housing bubble.

4. Increased $1 million new-home supply. New-home sales have slowed in a few new-home markets due to a surge in competitive supply. Coupling this surge in supply, builders have pushed prices too high in comparison to the resale competition due to rising costs.

Why is this perception wrong? Excess or rising luxury supply is apparent across the 28 markets I research.

5. Improving entry-level sales. Entry-level sales are also improving at a faster rate than higher-priced home sales. Indeed, the market for lower-priced homes is stronger, but that does not mean that luxury sales are struggling.

True, but I think the disconnect is just the opposite. The luxury market is soft so many market participants assume the entry level is soft as well and yet it is seeing heavy sales volume.

Since housing across the U.S. is softer at the top, Wall Street looks like they have been correct about luxury. Placing a uniform threshold across a slew of different U.S. housing markets doesn’t tell us anything. Stick to specifics since that’s where you provide solid research.

Tags: ,


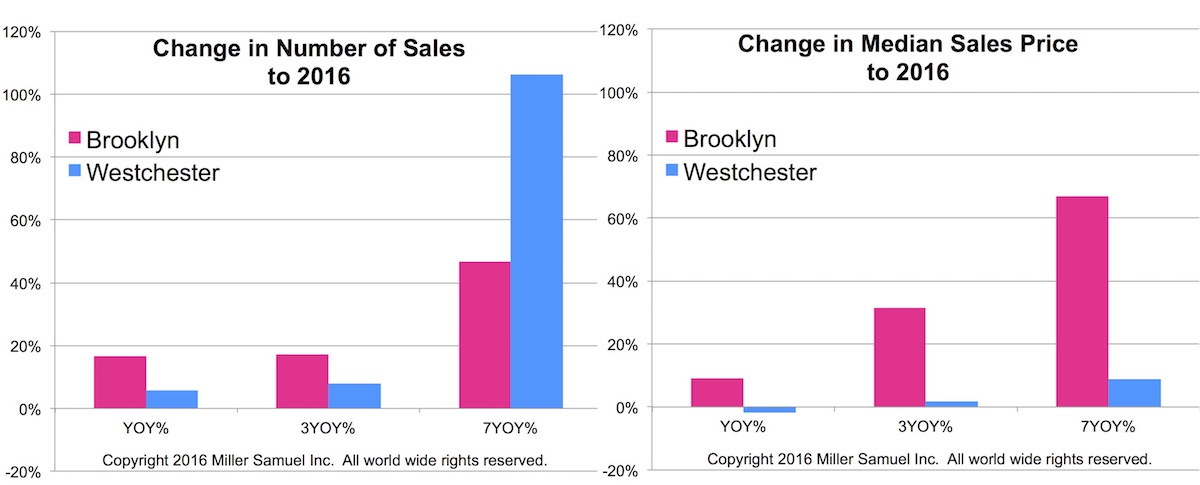
NYT Calculator: Suburban Sales Boom Measured By Houses on Monopoly Board

November 19, 2016 | 7:46 am | | Charts |

The New York Times created another super cool graphic in their new Calculator column, based on my idea. In the fall of 2015 I observed a massive surge of sales in Westchester County (north of NYC for those not familiar with our area). However median sales price was nearly flat during this period. This was phenomenon repeated in all of the counties that surround NYC – except for NJ since I don’t cover that market yet but anecdotally I believe the same phenomenon is occurring there. I believe this moment was the point where the affordability challenge became so severe that renters and move up buyers had to move out of the city.

Specifically, Brooklyn showed a surge in median sales price from 2009 with a modest growth in sales. Westchester reflected the opposite patterns of Brooklyn. Westchester county sales boomed over the same period while the growth in median sales price was much more tepid.

westchestervbrooklyn11-2016

Below is the NYT graphic for the suburban sales boom article.

11-18-16nytcalculator

Tags: , , ,

Get Weekly Insights and Research

Housing Notes by Jonathan Miller

Receive Jonathan Miller's 'Housing Notes' and get regular market insights, the market report series for Douglas Elliman Real Estate as well as interviews, columns, blog posts and other content.

Follow Jonathan on Twitter

#Housing analyst, #realestate, #appraiser, podcaster/blogger, non-economist, Miller Samuel CEO, family man, maker of snow and lobster fisherman (order varies)
NYC CT Hamptons DC Miami LA Aspen
millersamuel.com/housing-notes
Joined October 2007