Matrix Blog

The Real Deal

TRD Quick Question: Jonathan Miller “What’s Happening in the NYC Real Estate Market?”

December 28, 2020 | 1:51 pm | | Explainer |

I recently completed a quick interview with Stuart Elliott, Editor In Chief & CEO at The Real Deal who asked me questions with a uniquely mellow intensity. The Real Deal is required reading for anyone in the real estate profession or interested in real estate. Fun.


Tags: , , ,


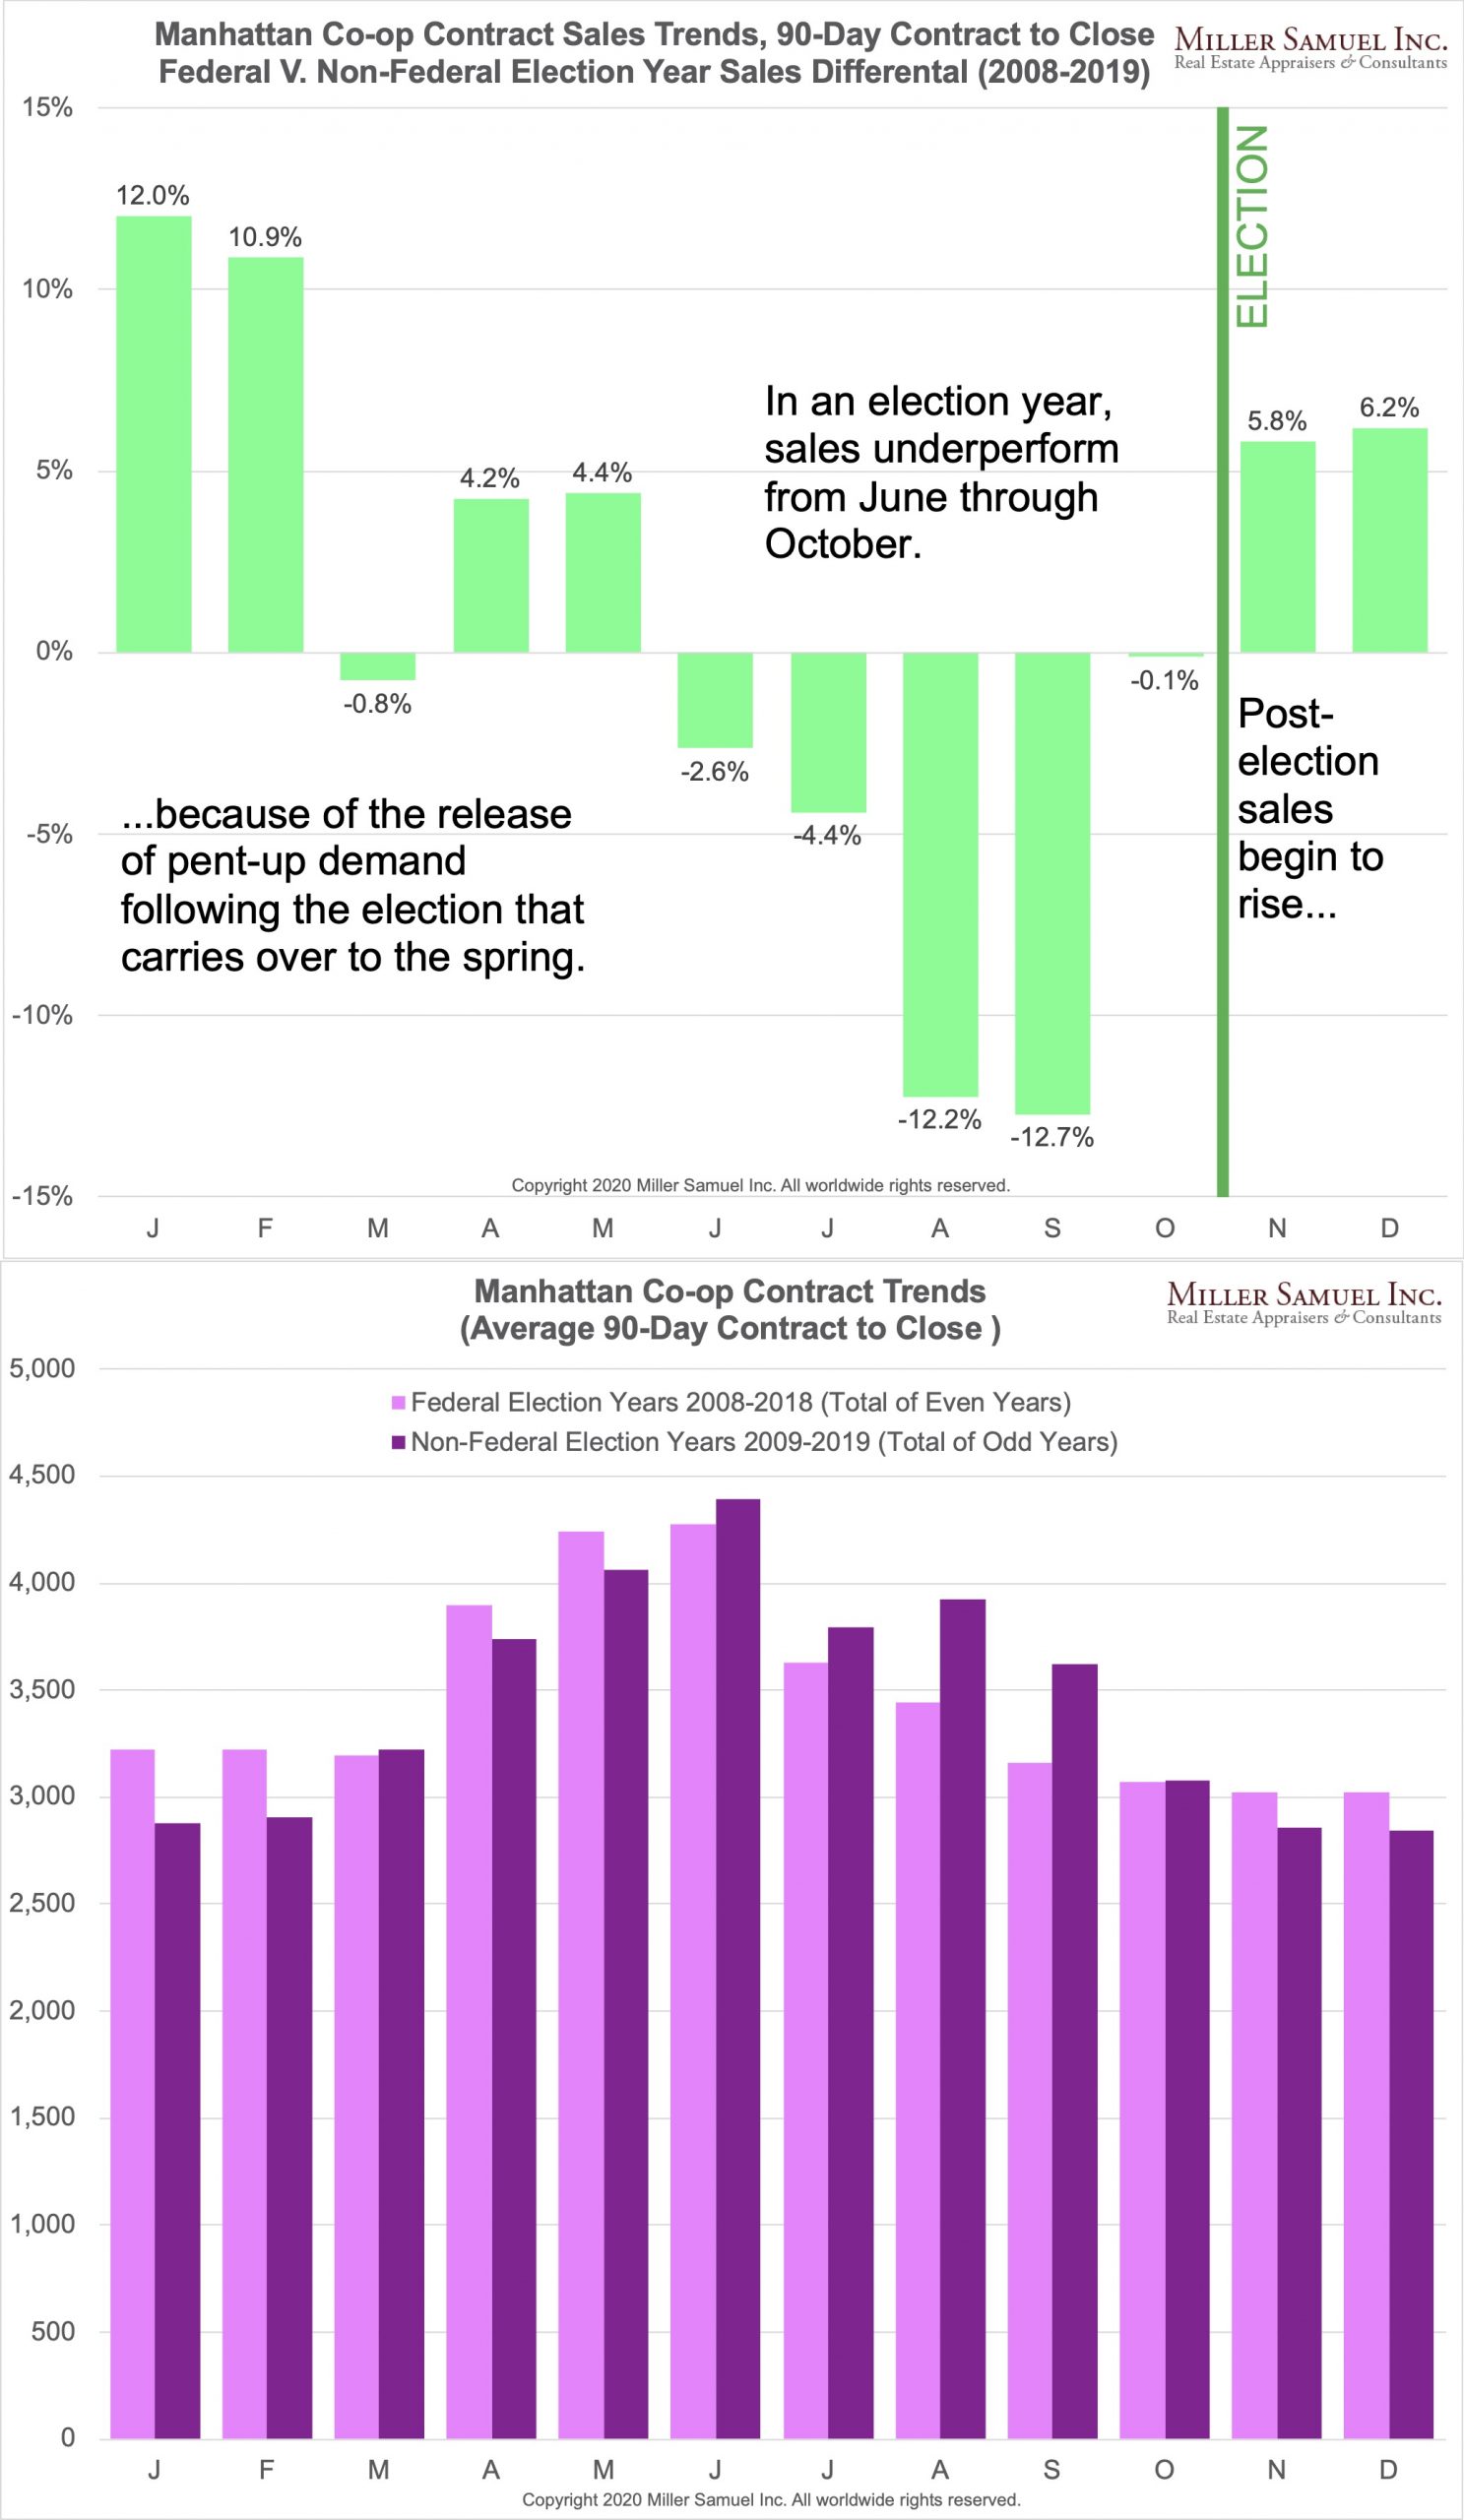
Manhattan Co-op Sales Fall During Federal Election Year

February 5, 2020 | 3:52 pm | | Charts |

For the past decade, I’ve been observing a pullback in sales in the summer of an election year and then a release in sales after the election into the new year, no matter the party or the candidate. I was speaking about this to Sylvia Varnham O’Regan at The Real Deal Magazine, and she asked me to prove it empirically.

So I did.

Her article: This is how presidential elections really affect home sales lays it out for the Manhattan market.

My methodology:

  • The data set was co-op based because they account for 74% of the apartment market and doesn’t have the wild fluctuation of contract versus closing date because of condo new development lags.
  • We don’t have all the contract dates for co-ops, but for those we do, they have been remarkably consistent at around 90 days. That 90-day average was applied to all the closing dates to reverse-engineer contract dates.
  • Contracts for even and odd years were compared: Even years represented federal election years, including midterms.

The results compared federal election years to non-federal election years, finding that beginning in June of an election year, sales were progressively weaker than their non-election year counterpart. The most significant difference occurred in September during an election year with a 12.7% weaker sales market than a non-election year. Beginning in November during an election year, sales overpower their non-election year counterpart, with the release of pent-up demand occurring well into the following spring.

Tags: , , ,


China: A Housing Market Without Re-sales?

November 27, 2016 | 5:54 pm | | Favorites |

I just returned from China for the second time in a little over a year and have yet been able to make sense of their domestic housing market. I am not talking about their must discussed housing bubble phenomenon or whether they have a housing bubble in the truest sense. I am talking about what seems to be a lack of a re-sale market.

After years of communist rule, the concept of home ownership in China is relatively new and appears to be in its early stages of development. Because growth in housing construction has been astronomical with all sorts of distorted metrics – their use of cement in 3 years (2011-2013) was more than the amount used in the U.S. over 100 years (1901-2000).

cementuseinchina-gates

Housing accounted for at least 15% of GDP in 2015, down from 22% in 2013. This is why we are seeing large Chinese construction companies working all over the globe these days – due to oversupply of new housing in China. The opportunities for revenue growth at the same pace seems limited.

On the bullet train we rode from Bejing to Shanghai, there were high rises under construction on both sides of the train tracks for most of the 5.5 hour trip. It’s hard to comprehend how much construction is underway without seeing it first hand, but it is massive.


Ghost Cities v. Ghost Towns
Unlike ghost towns in the U.S. which are abandoned after the economic forces are no longer in play, ghost cities have never been occupied. I think this is a pretty obvious flaw of central planning. I learned that incentives play a big role in unnecessary construction. In order for provinces to receive income from the central state, they are encouraged to generate GDP. Construction of apartment buildings is a quick way to boost GDP but there didn’t seem to be concern about their eventual occupancy (a la, build it and they will come). Also since the government owns the land, developers pay ongoing fees for using it. Our tour guide said that there were at least 40 ghost cities in China although this study says there are less. Here is a map of known ghost cities:

ghostcities

Multiple generations pooling their equity
Housing prices have been rising at about 17% annually for a decade – versus 11% disposable income growth of city dwellers. Rising prices have forced many buyers to pool the financial resources of as many as 3 generations of family. This shows how much is at stake for the Chinese government – if the housing bubble was to collapse. Yet same people I spoke with that expressed faith in the housing market showed grave concern over the integrity of their stock market. What alternative investments aside from housing does the typical domestic investor have? Especially since Chinese housing prices increased 53% in the past year?

fpchinesehousing16

However I am trying to get an answer for a much more basic point.

Is there a substantial Chinese re-sale market?
I feel way out on a limb when I say the following: few investors actually sell their apartments in the newly constructed apartment buildings.

I asked investors and real estate professionals in the Chinese housing market; four of our tour guides of the past few years; various people I met there during The Real Deal Shanghai conference: “Do investors sell their new apartments?” I consistently got a blank stare for a few moments as if the question had never come up before. A few people told me that buyers hold on to their investments for the long term and “no one sells.” On one of the real estate panels I moderated in Shanghai, a real estate professional made a comment that Chinese investors always prefer new.

The government has been trying to cool the market, requiring much larger down payments for investors, i.e. 70% and limit purchases to 1 per investor, but demand and creative work arounds, such as bogus divorces to skirt restrictions, remains high.


U.S. re-sales (existing sales) have accounted for roughly 85% of total U.S. housing sales over the long run. Granted, China is new to the concept of home ownership so the re-sale market would not dominate housing sales like it does in the U.S. But without a vibrant re-sale market, the “value” derived from Chinese housing market indices tell us Chinese housing price trends must be almost exclusively based on the newest home construction sales prices and that equity is not tangible.

Home sales seem to be a one-way transaction. Investors that buy a home feel wealthier as their investment rises in value. Theoretically that gets them to go out and consume, i.e. the wealth effect. However the market share of consumer spending in China is roughly half the 60% market share seen in the U.S. so they have a long way to go. While the Chinese investor may enjoy rental income when an active rental market exists, domestic housing purchases seem to be driven by a long term equity play.

I have found no anecdotal evidence of the widespread selling of existing properties that were recently developed. There doesn’t seemed to be a tangible moment when the recent investor expects to cash out the equity realized on their purchase of several years ago. If this is an incorrect observation and there indeed is a vibrant and active re-sale market of newly constructed housing, I was unable to see one or be told of one by consumers and real estate investors who live there.

So please clue me in.

Tags: , , ,


[Video] TRD Forum: Getting A Sense of the New Development Frenzy

May 23, 2014 | 4:24 pm | | TV, Videos |

I stumbled across this clip taken at the recent New Development Showcase hosted by The Real Deal. The publisher and founder, Amir Korangy, pulls off a couple of well-timed video-bombs!

This video gives you a good sense of the excitement, if not frenzy in the residential development space in New York City. There was a long line of people waiting to enter the venue for the event when I arrived.

Tags: , , , ,


[TRD] Here’s The New Development Showcase Panel, Including Heckler

May 20, 2014 | 6:30 am | | TV, Videos |

The Real Deal has posted the full video of the panel discussion I participated on last week with developers Steve Witkoff, Miki Naftali and Michael Stern. The Real Deal’s publisher Amir Korangy deftly kept the conversation going and candid, despite the technical challenges, sweltering heat and a heckler (i.e. just another day in NYC).

Tags: , , , , ,


[Panelist] May 15 – The Real Deal’s New Development Showcase

May 9, 2014 | 1:40 pm | | Public |

trdshowcase5-2014
[click to see full flyer as pdf]

They’re expecting 2,000 attendees! You can sign up here.

I’m looking forward to it.

Tags: , , ,


[Video] Talking Housing on CNBC TV’s Street Signs 9-25-13

September 25, 2013 | 7:29 pm | | TV, Videos |

I’m not quite ready to use the word “haunted” in my housing language, but I had a nice chat with Brian Sullivan and Mandy Drury of CNBC TV’s ‘Street Signs’ – 30 Rock is always quick walk from my office to do the remote. Although my firm’s name was announced backwards on air (It’s really “Miller Samuel” I swear), I think my logic was forward (sorry).

Fun. Plus Mandy gives The Real Deal Magazine a shout out.

Tags: , , , , ,


Manhattan Diverged From NYC At US Housing Boom Peak

February 14, 2013 | 10:54 am | | Charts |


[click to expand]

As the above chart illustrates, the aggregate median housing price in New York City, based on co-op, condo and 1-3 family property sales, with and without Manhattan sales go their separate ways circa mid-2006, at the Case-Shiller Home Price Index peak of the national housing market. This also makes the decline in the New York Case Shiller HPI all that more maddening (because it’s not Manhattan, or co-ops or condos or new development and includes Long Island, Fairfield, Westchester, Northern New Jersey and a county in Pennsylvania).

The market share for new development sales in Manhattan peaked in 2Q 06 at 57.9%. The 4Q12 market share was 12.5% but fear not, more new development is coming per The Real Deal.

During the boom through today, the shift in the mix towards Manhattan luxury property, largely from the combination of new development activity as well as vigorous Wall Street and international demand has expanded the difference between Manhattan and the rest of New York City. In other words, the gain in median sales price for NYC was caused by a shift in the mix toward higher end properties.

Tags: , ,


Housing Data as Pop Culture

February 14, 2013 | 7:00 am | | Charts |


[click to open article]

A recent post in CNN/Money featured Andy Warhol’s 1984 “U.S. Unemployment Rate. No Campbell Soup Cans but it feels strange to associate his art with economic data from the 1980s. It somehow works for me. One of the coolest property inspections I made was through “The Factory” years ago.

In 2007 the “Stand-up Economist” Yorman Bauman led the way with this much watched video on the difference between macro and micro economists. “Microeconomists are wrong about specific things while macroeconomists are wrong about things in general.” HI-larious.

And recently the TV game show “Teen Jeopardy” had 5 questions about the “Federal Reserve.”

Christie’s sales rep said:

“Economic data has become popular culture. While we used to think of it as being some kind of verified information only for people who are really knowledgeable about the economy, it’s popular culture now. You can talk to a taxi driver about it.”

I completely agree. Gangnam Style and GDP now go hand in hand.

We devour housing data ie the recently released Real Deal Data Book (I’ve got a lot of charts and tables in there!)

Throw in the heavy downloads of our report series for Douglas Elliman, NAR Research, CoreLogic, Case Shiller, RealtyTrac, etc. it’s clear to me that housing data is an obsession and embedded in popular culture (thank goodness).

Tags:


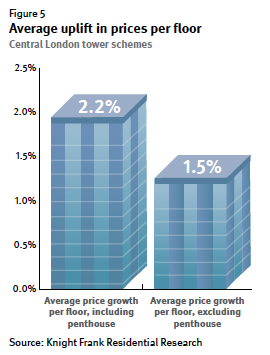
Knight Frank Tall Towers Report Shows London With Similar Manhattan Height Premium

November 6, 2012 | 10:00 am | | Reports |

Knight Frank released their new report exploring the floor level premium in London’s high-rise residential developments with the coolest report name ever: Knight Frank Tall Towers Report 2012

While NYC has a taller residential housing stock than London but the premium per floor is similar. London shows a 1.5% increase in value per floor. My rule of thumb for Manhattan has been 1% to 1.5%, but closer to 1%. However we treat floor level as a different amenity than view and that’s probably the reason for the slightly larger adjustment in London. What’s particularly of interest is how much more the per floor cost of development is for higher floors:

Net to gross area ratios in tower schemes are lower, since the percentage of space taken up by the cores and service provision areas are comparatively high. This means that the effective revenue-generating 43% Uplift in construction costs per sq ft between the 10th and 50th floor.

I’ve explored the subject myself in New York Magazine and The Real Deal Magazine.


Tall Towers Report 2012 [Knight Frank]
Manhattan Values By Floor Level [Matrix/New York Magazine]
The cost of a view [The Real Deal]

Tags: , ,


Treasures of New York: “Building Stories” Profile of Architect Costas Kondylis

June 14, 2012 | 3:36 pm | | TV, Videos |

Watch Treasures of New York: Building Stories on PBS. See more from THIRTEEN Specials.

If you missed this show on TV, it is now available in its entirety online. It’s an excellent collaboration between WNET/THIRTEEN and The Real Deal on the noted architect. I loved the way the assemblage of development air rights – basically a high stakes secret chess match – was presented.

Note to self: ask Amir Korangy, TRD’s publisher to do a doc on me someday – it would be brief, boring and attract little interest, but hey, who wouldn’t want their own doc?


  • Treasures of New York: Building Stories reveals the private life and the creative process of Costas Kondylis [WNET/THIRTEEN]

Tags: , , ,


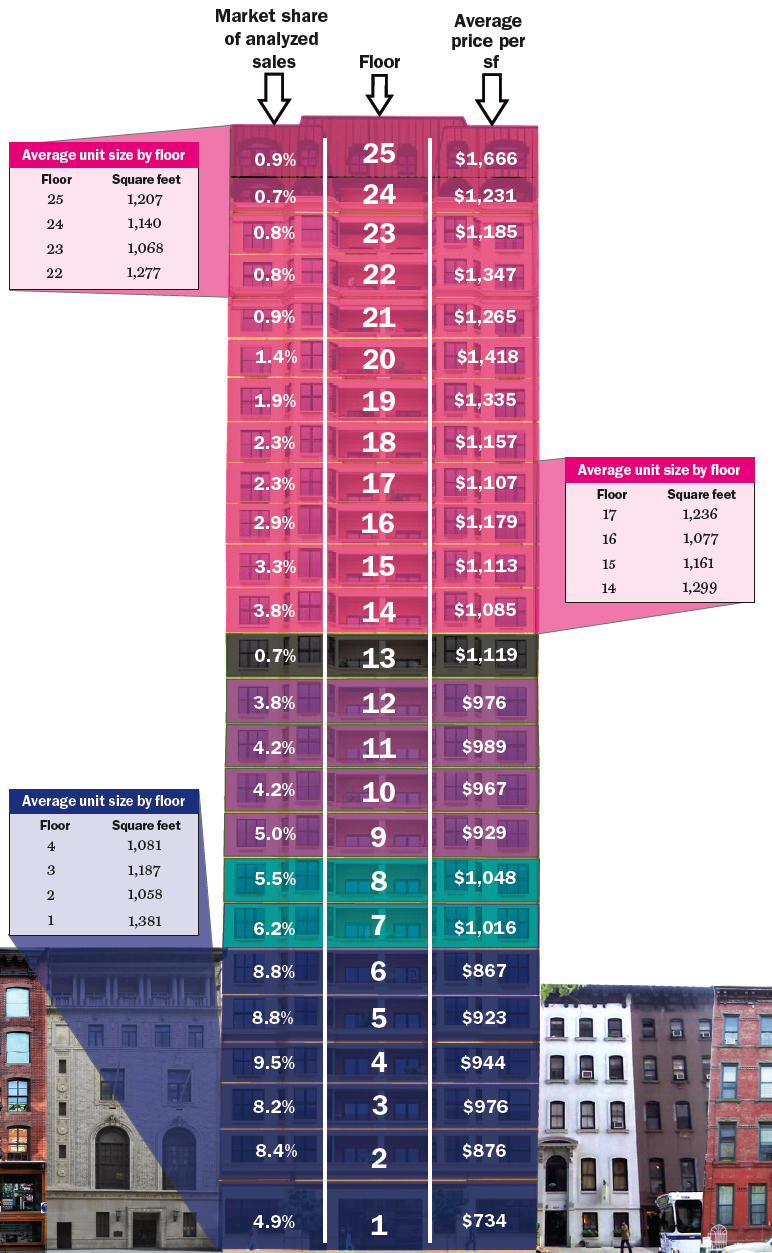
[ChartFloor] Manhattan Price Per Floor Breakdown

June 9, 2010 | 6:18 pm | | Favorites |

trdfloorlevel

Floor pricing has been the stumbling block for credibility with automated valuation models (appraisal replacement tools) used by banks and for services like Zillow. StreetEasy gets it right, in the way they display information – grouped by building so the patterns are apparent.

Matthew Strozier over at The Real Deal Magazine asked me to crunch apartment prices to show some sort of floor level relationship to value. I took the down and dirty approach (because SPSS is way over my head) and looked at all closed co-op and condo sales in 2009. I broke those sales down by floor level and crunched the metrics for each floor. The results are seen in this very cool chart. Click on the graphic to the right that TRD created to open the big version.

  • First Column – % share of units on that floor compared to all sales in 2009
  • Second Column – floor level
  • Third Column – Average Price per Square Foot of all sales in 2009 on that specific floor.

Some observations

  • 1st floor – 19.3% jump to the second floor reflecting concerns about security, privacy, and noise levels.
  • 2nd floor – 11.4% jump to the third floor reflecting concerns about security (scaffolding), privacy, and noise levels.
  • 7th floor – jump reflects penthouse and roofline breaks from adjacent 6 story buildings.
  • 13th floor – data suggests only 18.4% of buildings with a 13th floor actually call it that.
  • above 13th floor – market share declines with height, reflecting fewer apartments and the floor level price per square foot continues to rise.

In addition, the erratic price per square foot patterns on the higher floors reflect the differences in views. In our appraisals, we make adjustments for floor level and view separately.

I ended the presentation at the 25th floor only because the data set gets so thin that it was more difficult to extract or infer a pattern.

Tags: , ,

Get Weekly Insights and Research

Housing Notes by Jonathan Miller

Receive Jonathan Miller's 'Housing Notes' and get regular market insights, the market report series for Douglas Elliman Real Estate as well as interviews, columns, blog posts and other content.

Follow Jonathan on Twitter

#Housing analyst, #realestate, #appraiser, podcaster/blogger, non-economist, Miller Samuel CEO, family man, maker of snow and lobster fisherman (order varies)
NYC CT Hamptons DC Miami LA Aspen
millersamuel.com/housing-notes
Joined October 2007