Matrix Blog

Housing Indices & Portals

Zillow Offers As A Proxy For ‘Big Data’ Shows The Lack Of Qualitative Analysis

November 7, 2021 | 8:24 pm |

Yes, big data usually infers ‘quantitative’ analysis, as in “relying on numbers.” The Zestimate legacy of profound inaccuracy finally reached a devastating conclusion with the collapse of Zillow Offers this week and the loss of hundreds of millions in shareholder equity. Zillow never figured out the qualitative part that enables the actual precision in the pricing of a home sale.

There is a lot of talk right now about how other iBuyers are continuing to buy and sell properties so the space is still viable – business as usual. But step back for a moment and think about this:

  • The iBuyer market is currently overcrowded, even with the loss of Zillow Offers.
  • The iBuyer bold-faced name is OpenDoor who was the unicorn of Softbank who famously backed WeWork without any apparent due diligence.
  • The iBuyer segment is characterized by its razor-thin margins and billions of investment required.
  • It was created and run in a rising market, most of it a boom, and was recently turned off during the recent downturn.
  • It is wholly dependent on housing markets with homogenous housing stock and will always need high volume just to survive.

I feel pretty confident there will be further fallout over time, but the iBuyer space will settle into a small segment of the overall transaction universe. It has been wildly overhyped (at real estate brokers and real estate appraiser’s expense) as investors, burdened with high volumes of capital, desperate for upside in housing in this fintech boom.

Tags: , , ,


Zillow Gets Pillowed

February 9, 2021 | 11:07 am | TV, Videos |

I met Rich Barton, Zillow CEO, at an Inman/Curbed party held during an Inman conference in Manhattan a long time ago, the evening before Zillow’s launch. I asked Rich, a very nice and fascinating person, what he did for a living, not realizing he was the co-founder of Expedia. Ugh. He also said they were launching their latest effort the following morning – a web site called “Zillow,” and he added “as in rhymes with pillow” to the description. Little did I know real estate would never be the same after that.

So this weekend’s SNL skit on Zillow was particularly delicious with all the “pillow talk.” Even Rich got a kick out of it.


Your LOL UPDATE for February 10, 2021

Ted Alexandro Said SNL Stole His Joke, So He Asked for a Million Dollars [VICE]

Tags: , , , ,


Yahoo Finance TV: January 3, 2019, Manhattan & National Housing Trends

January 5, 2019 | 8:53 pm | | TV, Videos |

I had another a fun interview on Adam Shapiro and Julie Hyman on fledgling Yahoo Finance TV. Verizon is going gonzo to get it going with even more original programming. One observation – each time I’ve been invited to talk about the housing market, the stock market plummets at least 600 points. Correlation or Causation?


Tags: , , , ,


Our Manhattan Luxury Housing Price Indices on Bloomberg Terminals

March 4, 2017 | 10:03 pm | Charts |

Bloomberg maintains 6 quarterly charts on their terminals covering the Manhattan luxury sales and rental results we compile.  I periodically throw these charts on this Matrix Blog only because I find myself asking…how cool is that?

Manhattan Luxury Average Sales Price

Manhattan Luxury Average Sales Price Per Sq Ft

Manhattan Luxury Median Sales Price

Manhattan Luxury Average Rental Price

Manhattan Luxury Average Rental Price Per Sq Ft

Manhattan Luxury Median Rental Price

Tags: ,


Declaring A Housing Recovery Using A Threshold Based on Fraud

November 30, 2016 | 3:16 pm | Charts |

S&P CoreLogic used it’s National Non-Seasonally Adjusted Housing Price Index to declare that the housing market has recovered. Even the ironies of this public relations effort have ironies. I’ll explain.

First, look at this classic Case-Shiller chart. Notice how the arrows don’t connect to the lines they are associated? I’m being petty but it looks like the chart was updated and rushed out the door.

csiclassicchart11-2016

Incidentally, who controls the Case-Shiller Indices brand these days? It used to be “S&P/Case-Shiller Indices.” Here are a couple of variations found in the first paragraph of the press release:

  • S&P Dow Jones Indices
  • S&P CoreLogic Case-Shiller Indices

but I digress

Since the financial crisis, I have spent a good deal of time explaining away the reliability of the Case Shiller Index.

To be clear, I greatly admire Robert Shiller, the Nobel Laureate and his pioneering work in economics. I’ve had the pleasure of speaking with him on a number of occasions both publicly and privately. He and I were on stage together at Lincoln Center back during the housing bubble for a Real Deal event.

During the bubble I was the public face of a short lived Wall Street start-up that collapsed when the bubble burst. Like Case-Shiller it was built to enable the hedging of the housing market to mitigate risk using a different methodology, avoiding the repeat-sales method used in CS. The firm had annoyed Shiller by constantly citing the issues with the CS index and we got far more traction from Wall Street with our index that was (literally) built by rocket scientists. It got to the point where he mentioned me and the startup by name at a conference in frustration.

thhpodcastlogo

After I disconnected with the startup before it imploded, I reached out and we made up. In fact he did my Housing Helix podcast (link broken but hope to bring it back online soon for historical reference) at my office back when I was doing a podcast series of interviews with key people in housing). Also we’ve run into each other on the street in Manhattan a number of times. In fact when he learned of my love of sea kayaking he gave me the latitude and longitude coordinates of his island vacation home in case I was nearby. You can see that I feel a little guilty criticizing the use of the index since he is one of the nicest and smartest people I’ve ever had the honor to meet.

But I don’t like the way S&P, Dow Jones and/or CoreLogic have positioned Case-Shiller as a consumer benchmark. And especially yesterday’s announcement as a marker for the recovery of the U.S. housing market. I feel this is a low brow attempt by these institutions to leverage publicity without much thought applied to what is actually being said. Here are some thoughts on why it is inappropriate to use this moment as a marker for the housing recovery.

“The new peak set by the S&P Case-Shiller CoreLogic National Index will be seen as marking a shift from the housing recovery to the hoped-for start of a new advance” says David M. Blitzer, Managing Director and Chairman of the Index Committee at S&P Dow Jones Indices.

Blitzer remains in the very awkward position of explain away the gap between the market 6 months ago and current condition as if there is no difference. He does this by using anecdotal commentary about metrics like supply that has nothing to do with the price index as well as making pithy remarks.

  • The Case-Shiller National Index is being touted for reaching the record set in the housing bubble a decade ago despite the record being set back then by artificial aka systemic mortgage fraud. However their 20 city index has been pushed as the key housing benchmark for more than a decade, not the national index. And they are using the non-seasonally adjusted national index to proclaim the record beaten despite their long time preference of presenting seasonally adjusted indices (the seasonally adjusted national index has not broken the housing bubble record yet).

  • The credit bubble got us to the 2006 peak, not anything fundamental.

cshpitablefrompeak11-2016

  • In my thirty years of valuation experience, I have learned that sales transactions, not prices, should be the benchmark for a housing market’s health.

  • The 0% markets that reached the 2006 peak are super frothy – created by rapidly expanding economies and an inelastic housing supply. Income growth doesn’t always justify their price growth. Click on table below for the markets shaded in turquoise.

csnsazero

Some important background points on the Case Shiller Home Price Index (CS) – that most of its users are unaware of:

  • CS was never intended for consumer use! It was built for Wall Street to trade derivatives to hedge housing market risk much like hedging risk for weather, insurance, non-fat dry milk and cheddar cheese.

  • CS never caught on because housing is a slow and lumbering asset class, unlike a stock which has much more liquidity. The flaw during this bubble period was the way Wall Street and most real estate market participants considered housing as liquid as a stock and how financial engineering had enabled that liquidity.

  • As access to public housing data has become more ubiquitous, the index has been more easily gamed by companies like Zillow, who have been able to accurately predict the index results much sooner rendering the index as useless for hedging.

  • CS lags the actual “meeting of the minds” between by buyers and sellers – when they agree on the price and general terms – by 5-7 months. The November report just released was based on the 3 month moving average of closed sales from July, August and September. If we say that contract to close period is an average of 60 days, then the contracts signed in this batch of data represent May, June and July. And the time between the “meeting of the minds” and the signed contracts can be a couple of weeks, so the results in yesterday’s lease of the Case-Shiller index represents the period around Memorial Day weekend as summer was getting started.

  • CS only represents single family homes (although they have an index for condos).

  • CS excludes new development.

  • There is little if any seasonality in the CS methodology (even though there is a seasonally adjusted version).

  • Geographic areas in the 10 and 20 city CS indices are incredibly broad. For example, the “New York” index includes New York City, Long Island, Hamptons, Fairfield County, Westchester County, a bunch of counties in northern NJ and a county in Pennsylvania. Yet this index is often represented as a proxy for the Manhattan housing market by national news outlets. Manhattan residential sales have about a 1% market share of single family homes.

In other words, the CS index is a great academic tool to trend single family home prices at a 30,000 foot view for research but not to measure the current state of your local market.

Tags: , , , , ,


Charts That Don’t Make Real Estate Trends Into A Stock Ticker

December 21, 2015 | 12:10 pm | | Charts |

MLHRSQFT

If you’re a subscriber to the Bloomberg Terminals, as roughly 350,000 people are (paying $1,600+ per terminal per month), then you may already know there are a half dozen charts on the Manhattan luxury housing market. To be clear, these indices don’t suggest that housing price trends should be presented as a stock ticker.

It’s a good thing too, since the thought of making real estate housing markets equate to stocks was inspired by, and then was crushed by, the housing boom-bubble-bust era 2003-2008.

Here’s why a stock ticker for real estate is a flawed (aka dumb) concept:

  • A stock market moves in the context of nanoseconds rather than weeks or months.
  • Contract data is not available market-wide and if it were, lags the market by several weeks.
  • Closed data used in a ticker would lag the market by months.
  • It implies instant liquidity for real estate holdings.
  • Not all property types see high volume so their trends are extrapolated (and thus diluted).
  • It teaches market participants that short term views on real estate holdings are the norm, the way a stock day trader views the market.

While a daily real estate index can be created with relative technical ease, it doesn’t mean it is a good idea. It infers a level of precision that doesn’t exist and an accuracy based on lagging data that is not understood by users.

Those who push the stock ticker idea either didn’t work through the last cycle in real estate, or they didn’t learn from the experience.

We update 3 charts on the Manhattan luxury sales market and 3 for the Manhattan luxury rental market. I have always defined “luxury” as the top 10% of transactions during a period.

Click on the gallery below to open each of the indices.

bloombergmanhattangallery

Tags: , , ,


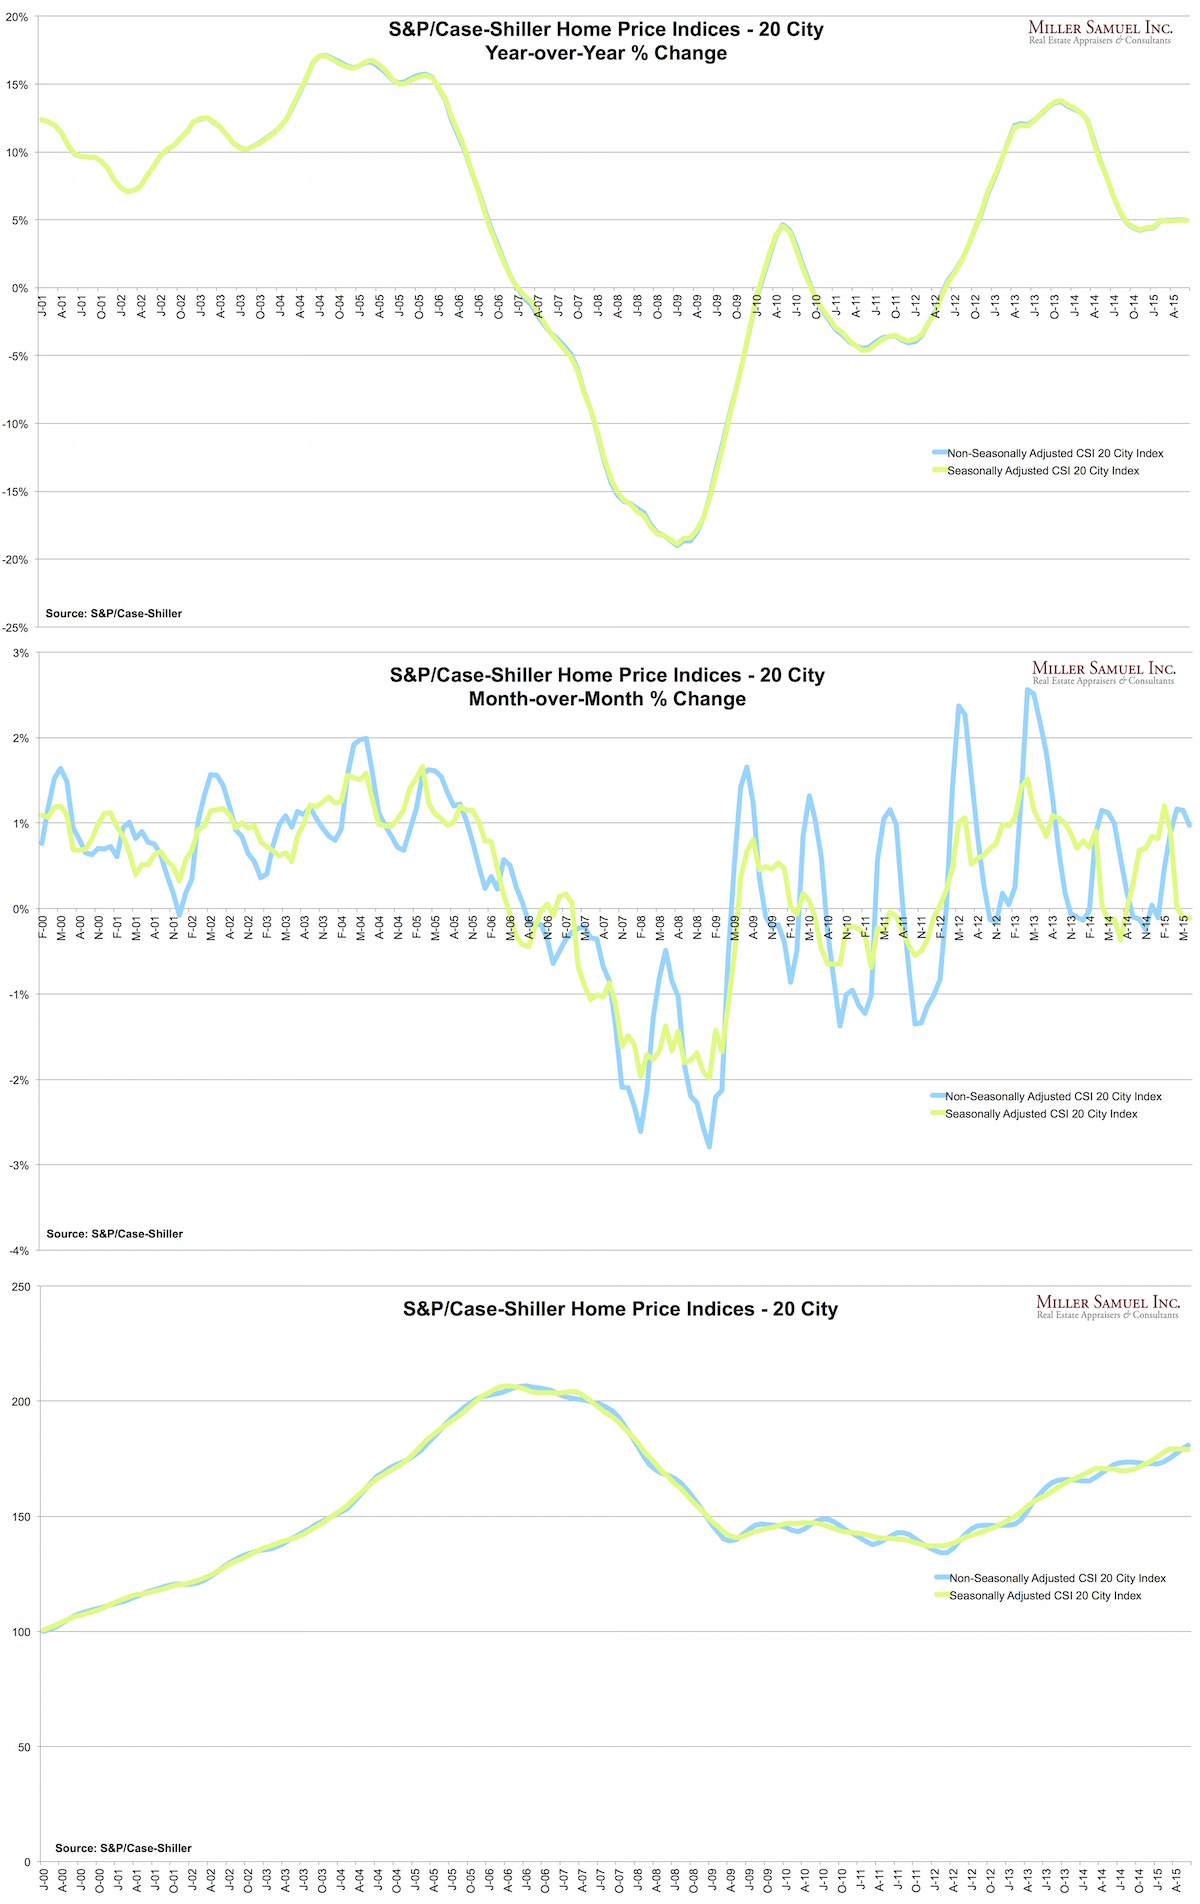
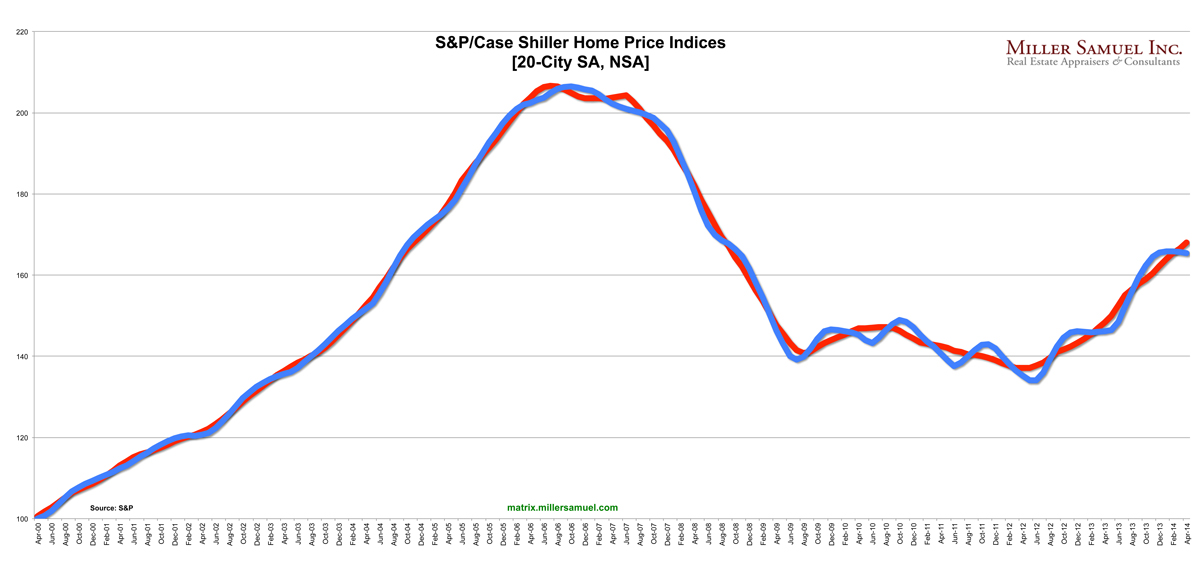
Explainer: Three Ways to Look at S&P/Case-Shiller Index Results

August 25, 2015 | 2:00 pm | Charts |

I have a long history of dissing the relevance of the S&P/Case Shiller Index because of the 6 month lag and the slew of anecdotal link-the-dot official commentary associated with it that literally has nothing to do with the numbers generated (gasping for air). However I feel compelled to look at it periodically because it is part of the media’s monthly market report gauntlet.

The S&P/Case-Shiller Home Price Indices were published today so I thought I’d create a trifecta of ways to look at the same data.

Top Chart – This is the famous year-over-year % change view which I believe is the best way to look at the market and the scariest. They use the seasonally adjusted index and the non-seasonally adjusted index (so did I) but there is virtually no difference. Most news coverage of the index usually link to the press release which embeds this type of chart that uses all the broad indices: 10-city, 20-city and National. The 20-City has long been the primary index that was touted but the references in the media are shifting to the national index and that’s probably a good thing.

Middle Chart – This is the month over month version using the same data. Clearly the seasonal adjustment smooths out the line. However the non-seasonally adjusted versions shows a significant impact from the seasonal nature of real estate – in fact this chart shows that seasonal patterns are becoming more extreme since the financial crisis began. Originally the index was virtually all about the month over month results even though the featured chart was year-over-year. They have since moved year-over-year to the front of the press release and has already influenced the way the index is presented in the media which is good to see.

Bottom Chart – This is the only chart that uses the actual index numbers rather than percentages. It’s a sleepy pattern that seems to wash out seasonality a bit and shows the market in a less intimidating way. Ironically, the actual index trend is visually less interesting. Seems ironic.

8-25-2015CSI
[Click to expand]

Tags: , ,


Bloomberg View Column: The Myth of Real Estate Stigma

August 31, 2014 | 4:52 pm | | Charts |

BVlogo I gave some thought to what the long term impact of a nationally-covered local tumultuous event on a local housing market might be…

The Aug. 9th shooting death of unarmed black teenager Michael Brown by a white police officer has roiled Ferguson, Missouri, thrusting it into the national spotlight. But what happens to the town of 21,000 outside of St. Louis after the turmoil ends — more specifically, what happens to property values?

Read my latest Bloomberg View column
The Myth of Real Estate Stigma. Please join the conversation over at Bloomberg View.


My Bloomberg View Column Directory

My Bloomberg View RSS feed.

Tags: , , , , , , , , , , , , , ,


My Bloomberg View Column: Housing Data Is Old and Moldy

July 31, 2014 | 11:32 am | | Charts |

BVlogo

After being pummeled with confusing sound bits after the release of Monday’s Pending Home SalesIndex by the NAR and the S&P/Case Shiller Index, I thought it was time to set the record straight on the applicability of this research.

This is my second column for Bloomberg View: Housing Data Is Old and Moldy


My Bloomberg View RSS feed.

Tags: , , , , , ,


Bloomberg Surveillance TV – Guest Host 6-25-14

June 25, 2014 | 8:30 am | | TV, Videos |


UPDATE: above clip just added – expanded conversation.

Got to guest host an hour (6am to 7am) of Bloomberg Television’s Surveillance with Tom Keene, Scarlett Fu and Adam Johnson to talk housing. The above is just a couple of minutes of the hour (yes, you’re spared). We spoke about Case Shiller, New Home Sales, biting in World Cup Soccer, my fireman son using a GoPro in fires and LeBron/Carmelo’s real worth among other things. Like I said, we did talk housing.

Adam brought up a great point – while the economy is always characterized as 70% consumer driven, 16% of that is actually health care spending so the overall number is really 54%.

Very smart conversations (the topic of biting included). Always fun to join them.

Tags: , ,


Time-Shifted Case Shiller: Dallas, Denver Crushing it, Polar Vortex a Non-Issue ‘Cause It’s Still December

June 24, 2014 | 5:29 pm | Charts |

matrixCSI-6-24-14 [click to expand]

The above chart is a generic trend line for the seasonally and non-seasonally adjusted 20-City Case Shiller Index released today using the data from the release.

And here’s the same index that I time-shifted backwards by 6 months to reflect the “meeting of the minds” of buyers and sellers. More specific methodology is embedded in the following charts. By moving the index back 6 months, the changes in the direction of the index are in sync with economic events (reality). In my view this index has a 6 month (5-7) month lag rendering it basically worthless to consumers but perhaps a useful tool for academic research where timing may not be as critical. I’m just grasping here.

matrixCSI-6-24-14INDEXshift

[click to expand]

And here’s a time-shifted trend line for the year-over-year change in the 20 city index. You can see that the pace of year-over-year price growth began to cool at the end of last year. Talk about the weather is still premature since the polar vortex occurred after the new year.

matrixCSI-6-24-14YOYshift

And here is the ranking by year-over-year changes for each city as well as the 10 and 20 city index. Dallas and Denver are no longer under water and Las Vegas, despite recent good news has a long way to go to get to the artificial credit induced high it reached in 2006.

matrixcsi6-2014ranking

Tags: , , ,


[Bloomberg TV] Guest Host of ‘Surveillance’ 5-28-14

May 28, 2014 | 6:00 pm | | TV, Videos |

This morning, I got to join Tom Keene, Adam Johnson and Cristina Alesci on Bloomberg TV’s Surveillance to talk housing for the 6am to 7am hour. Definitely worth getting up at 4am to make into the studio. No, really!

Covered a lot of ground this morning on the show. Here’s another clip.

Tags: , , , ,

Get Weekly Insights and Research

Housing Notes by Jonathan Miller

Receive Jonathan Miller's 'Housing Notes' and get regular market insights, the market report series for Douglas Elliman Real Estate as well as interviews, columns, blog posts and other content.

Follow Jonathan on Twitter

#Housing analyst, #realestate, #appraiser, podcaster/blogger, non-economist, Miller Samuel CEO, family man, maker of snow and lobster fisherman (order varies)
NYC CT Hamptons DC Miami LA Aspen
millersamuel.com/housing-notes
Joined October 2007