Matrix Blog

Analysis & Research

[Podcast] Slate Money: Felix Learns What A Condo Is – Jonathan Miller joins to talk all things real estate.

October 10, 2022 | 2:55 pm | Podcasts |

I’m a regular listener to the Slate Money podcast so I was thrilled to be invited to participate.

This week, Felix Salmon, Emily Peck, and Elizabeth Spiers are joined by housing market analyst and real estate appraiser Jonathan Miller to answer all their burning real estate questions including what’s going on with mortgage rates, how do new luxury buildings affect prices, and why is rent so damn high?

Tags: , , , ,


Zillow Offers As A Proxy For ‘Big Data’ Shows The Lack Of Qualitative Analysis

November 7, 2021 | 8:24 pm |

Yes, big data usually infers ‘quantitative’ analysis, as in “relying on numbers.” The Zestimate legacy of profound inaccuracy finally reached a devastating conclusion with the collapse of Zillow Offers this week and the loss of hundreds of millions in shareholder equity. Zillow never figured out the qualitative part that enables the actual precision in the pricing of a home sale.

There is a lot of talk right now about how other iBuyers are continuing to buy and sell properties so the space is still viable – business as usual. But step back for a moment and think about this:

  • The iBuyer market is currently overcrowded, even with the loss of Zillow Offers.
  • The iBuyer bold-faced name is OpenDoor who was the unicorn of Softbank who famously backed WeWork without any apparent due diligence.
  • The iBuyer segment is characterized by its razor-thin margins and billions of investment required.
  • It was created and run in a rising market, most of it a boom, and was recently turned off during the recent downturn.
  • It is wholly dependent on housing markets with homogenous housing stock and will always need high volume just to survive.

I feel pretty confident there will be further fallout over time, but the iBuyer space will settle into a small segment of the overall transaction universe. It has been wildly overhyped (at real estate brokers and real estate appraiser’s expense) as investors, burdened with high volumes of capital, desperate for upside in housing in this fintech boom.

Tags: , , ,


[WNBC] The State of New York Real Estate

May 18, 2021 | 9:55 am | | TV, Videos |

Adam Kuperstein at WNBC reached out to do a story on the state of the Manhattan housing market for Douglas Elliman. He got all the nuances right and featured the results of our market research. It was my first tv interview back in my Manhattan office and afterwards I realized I need to warm up my background after using my home office for the past 14 months!


Tags: , , , ,


[Bloomberg TV] Bloomberg Markets 7-6-20: A Busy Housing Market This Summer

July 6, 2020 | 5:17 pm | | TV, Videos |

Had a wonderful, nearly 7.5-minute conversation with Vonnie Quinn on Bloomberg Television’s Markets today discussing how the housing market will likely look over the summer. The interview touched on the analysis in the Douglas Elliman Report series I author.

Some ‘inside baseball’ fun. I was connected to Bloomberg via Zoom from my home for this. If you look closely at the 5:15 mark, you can see my garage door open as my wife drives in. My wife panicked when watching this clip, thinking she would be on TV as she walked out of the garage, but randomly ended up using the other door.


Tags: , , ,


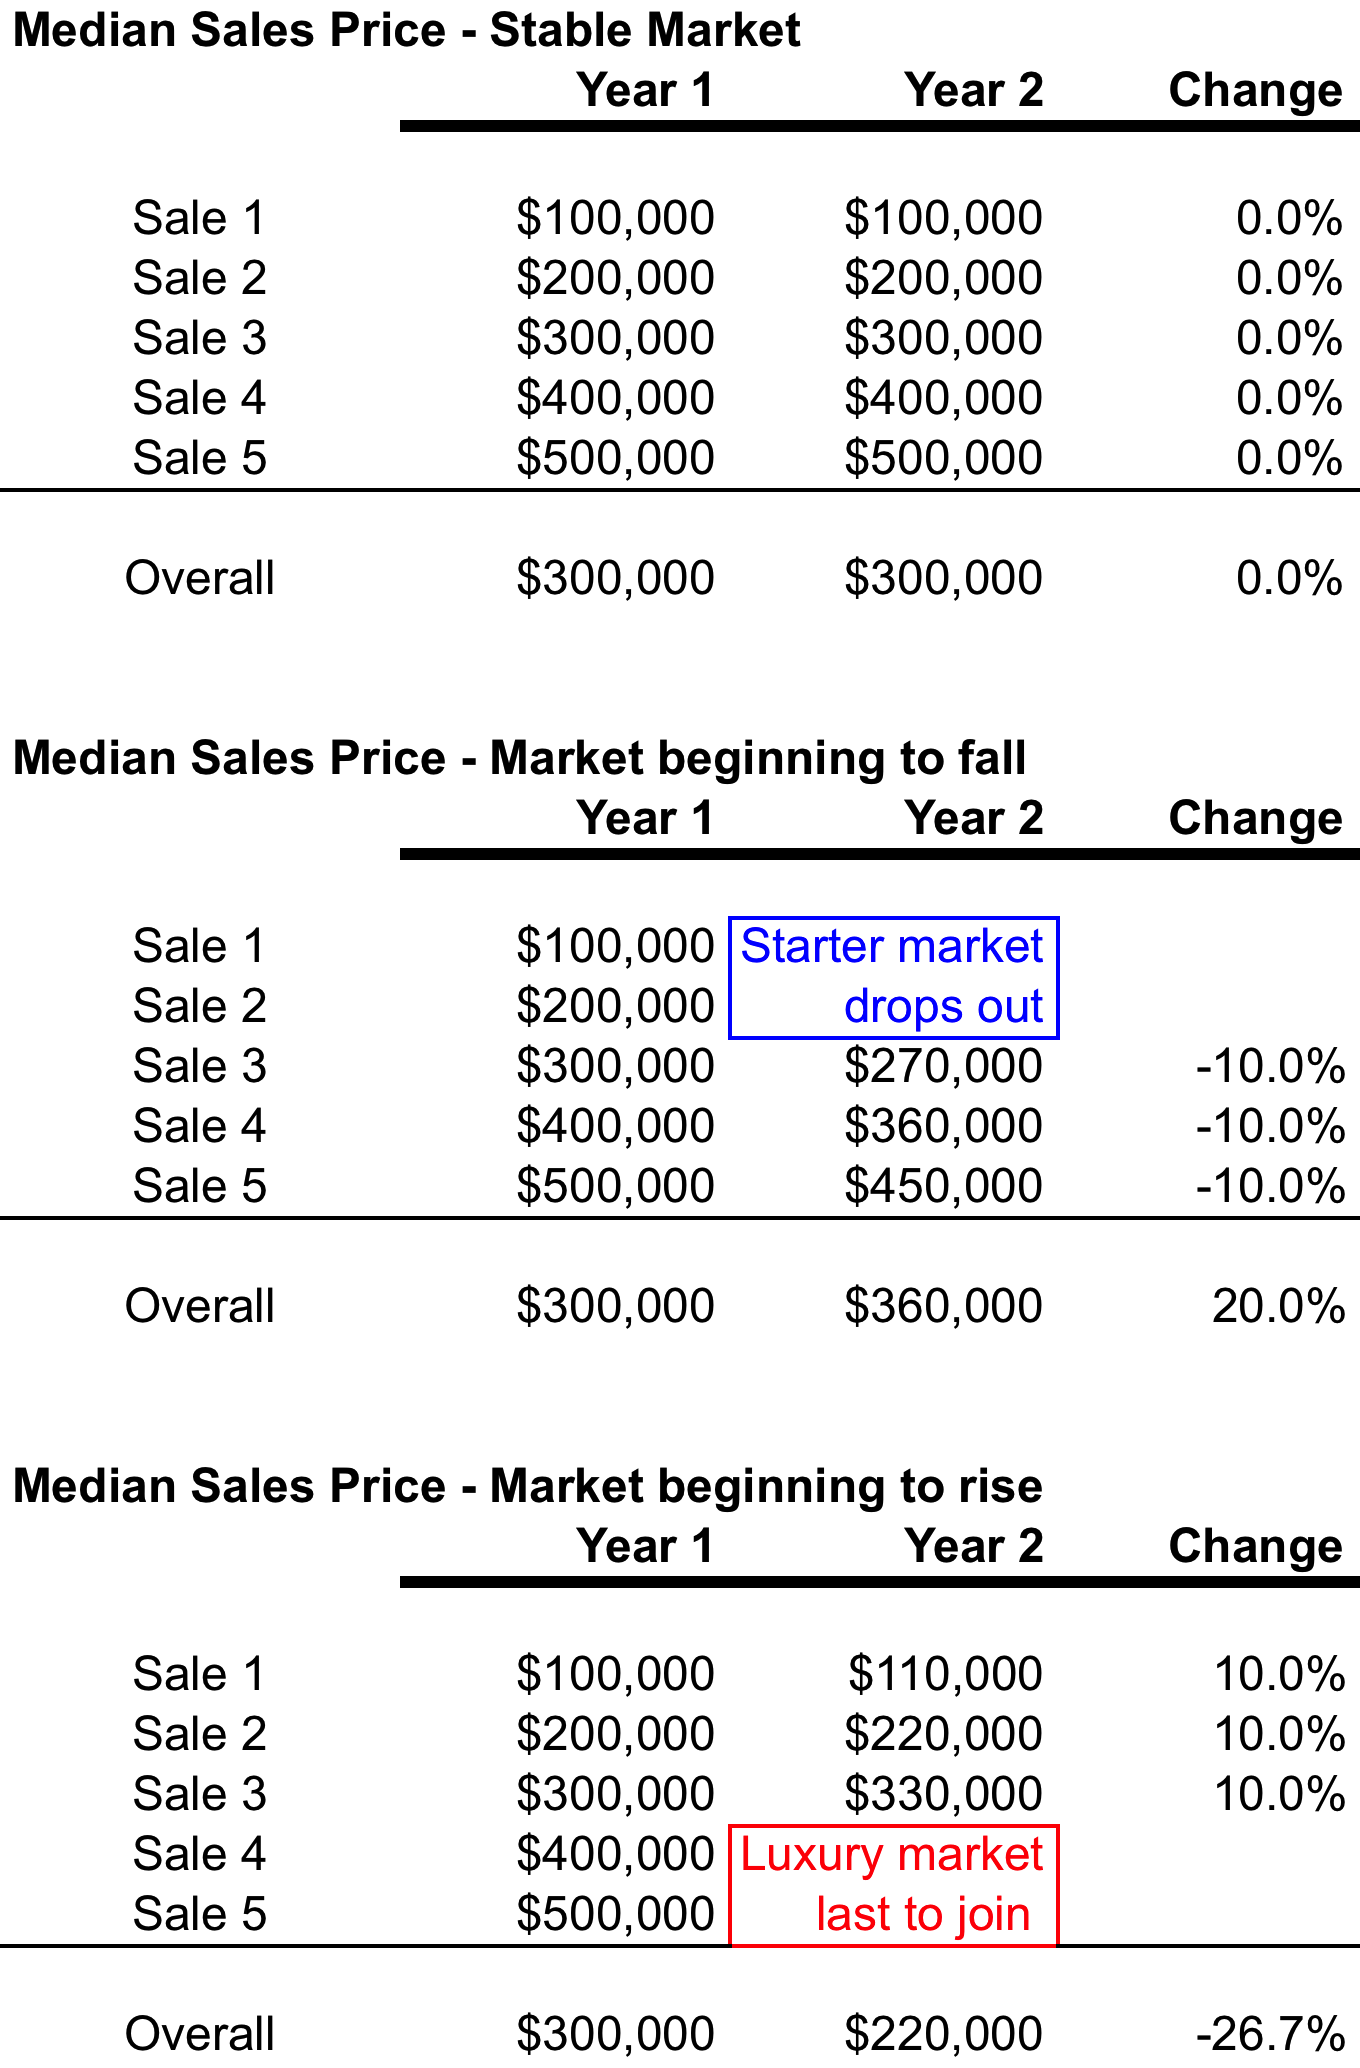
Median sales price can be subject to skew by consumer behavior more than math

May 12, 2020 | 11:19 am | Explainer |

Here’s an updated excerpt from my Housing Note newsletter dated October 28, 2016, digging into the median sales price. You can subscribe to Housing Notes and other housing resources for free.


I wrote about the median sales price a decade ago, and the message still holds. A couple of years ago, I whipped up a table that shows how median sales price can perform in a changing housing market. The median sales price is the default price trend indicator of real estate because it eliminates the extreme highs and lows of a data and merely represents the middle number. However, it is also subject to skew by consumer behavior that can overpower the math. So I always provide two to three price trend indicators depending on the quality of available information (average sales price, median sales price, median sales price) for all of the reports in my Elliman Report Series. The relationship between median and average sales price can also tell a story.

Click on the graphic below to expand.

medianexplained

Tags: ,


Contract Data Is Pending Data Is Lagging Data

April 29, 2020 | 11:50 am | Explainer |

In our post-Coronavirus world, it is clear that market conditions and our understanding of the future are subject to change every day. In my prior post Establishing the COVID-19 Demarcation Line: From ‘Hanks To Banks’, data that falls after the line represents a different market.

So how do we determine what data falls in after the demarcation line? It’s not as straightforward as it sounds.

Throughout my career, I have seen brokerage firms publish pending/contract reports, touting pending trends as more reliable than reports based on closings. I don’t look at them as better or worse, just a different way to look at the market. The simplistic, uninformed argument for pending sales is that contract dates occur before closing dates, so they are more current. Incidentally, contract prices are not readily shared. I get all of this. Yet I have seen the failure rate of contracts be as high as 40% – in other words, many contracts might not close whereas closing reports are solely based on successful transactions. Still, pending sale trends are useful as long as the reader understands their shortcomings. I plan to develop one someday.

Closing data and contract/pending data lags the “meeting of the minds.

Meeting of the minds (also referred to as mutual agreement, mutual assent, or consensus ad idem) is a phrase in contract law used to describe the intentions of the parties forming the contract. In particular, it refers to the situation where there is a common understanding in the formation of the contract.

While we know that closing dates lag the “meeting of the minds,” we also need to understand that signed contract dates are lagging indicators, often by 2-4 weeks. During this crisis, I’m speculating the failure rate will be high initially, and the time lag will be on the longer end rather than, the shorter end of this 2-4 week range.

Here’s why contract dates are a lagging indicator and not necessarily more insightful than closing data:

1) The “meeting of the minds” occurs when buyers and sellers negotiate price and terms, usually facilitated by a real estate agent or broker.

2) The price and terms are handed off to transaction attorneys who work together to craft language agreeable to both parties.

3) The contract is signed by both parties and often indicated as such in an MLS-type system.

4) In some markets or marketing periods, especially when a market is cooling, many contracts never close, so their initial inclusion makes pending trends reports suspect.

If there is a four week signed contract lag from the meeting of the minds, and considering the March 15 demarcation line for post-Coronavirus, that means that with us being six weeks into the crisis, we are only able to see two weeks worth of post-Coronavirus data. And even with that reality and current shelter in place rules, many current contracts might have been older deals that were facilitated by the buyer who had already inspected the home in January/February – we are seeing some of that now.

In other words, relevant data on the new market remains extremely limited.

Tags: , ,


January 2019 YOY% Change in Manhattan Co-op/Condo Listing Inventory

February 7, 2019 | 1:53 pm | Charts |

Tags:


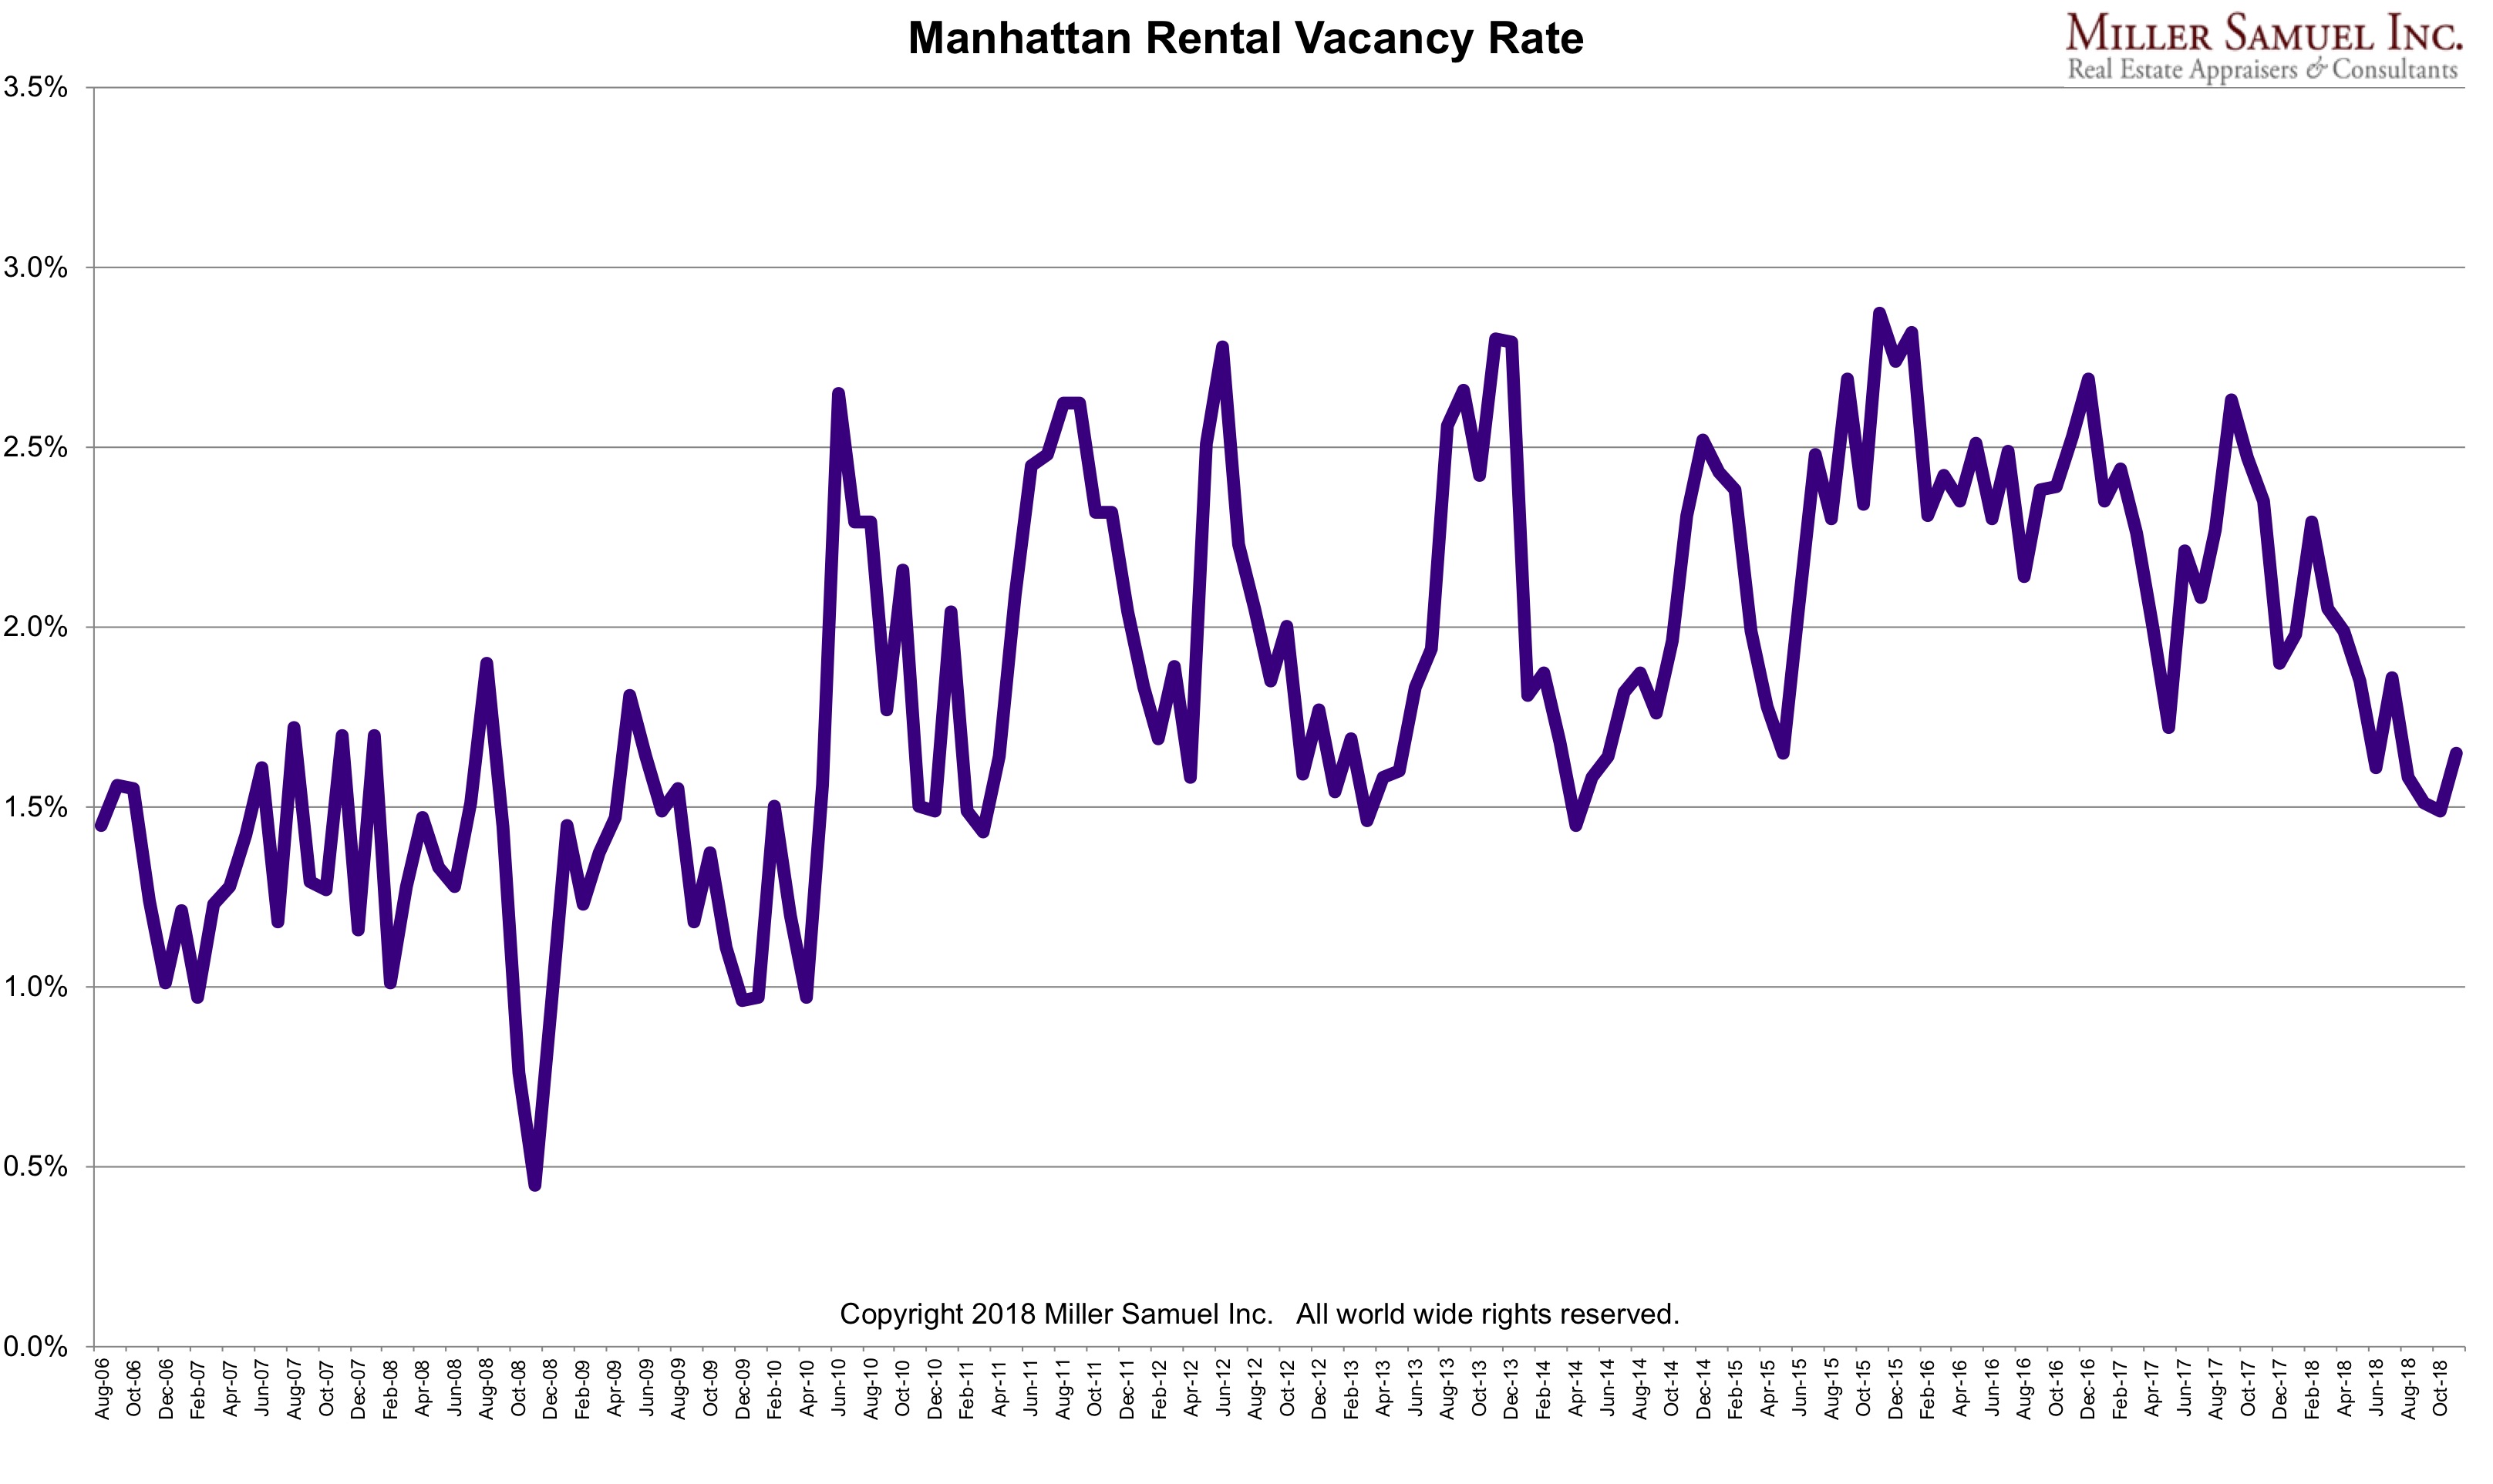
Manhattan Residential Vacancy Rate Isn’t Seasonal?

December 13, 2018 | 1:01 am | Charts |

Since housing market trends are all about seasonality, I thought it was interesting that the Manhattan residential vacancy rate seems devoid of such patterns.

What am I missing here?

Tags: , ,


[Media] Bloomberg Markets Interview January 11, 2018

January 11, 2018 | 11:07 pm | | Milestones |

So I was walking down Fifth Avenue in Midtown Manhattan in the late morning after a meeting and got a call from Bloomberg TV. Apparently, two different stories that featured two of the market reports I author – published by Douglas Elliman – were the number one and two most emailed on the Bloomberg Terminals worldwide.  They wanted to talk about them.

So I took a left and walked over Bloomberg HQ.  Got to speak with Vonnie Quinn and Shery Ahn on set – who knew how to make an interview go well.

This is a 2-minute clip of the 5-minute interview, but you’ll get the gist. I’ll expand on this discussion tomorrow at 2 pm when my weekly Housing Note is released.

[click to view video]

Tags: , , ,


Real Estate ChartArt in Elliman Magazine’s Fall 2017 Issue

September 18, 2017 | 3:12 pm | | Charts |

Douglas Elliman Real Estate just published their fall issue. I created the content for pages 208-209 and I think it looks pretty snazzy (and interesting).

Click on image below to expand.

EllimanMag

Tags:


[Forbes] Penthouse Juxtaposition – What Developer Wants v. What Market Supports

June 15, 2017 | 5:14 pm | TV, Videos |

No one will argue that a $70 million penthouse can be special. But when a penthouse has many open houses and sits on the market for more than a year, it seems reasonable to wonder about pricing.

Samantha Sharf at Forbes presented a great video that juxtaposes the amenities of the apartment with my perspective on the state of the super luxury market and the next possible housing cycle in front of us. When they filmed this in Bryant Park, there were many people standing and watching off camera which was kinda fun despite my serious slouching.


[click on image for video]

Tags: , , ,


Agricultural Land versus Manhattan Parking Per Acre

March 26, 2017 | 8:19 pm | Infographics |

Well here’s a first for me.

Our Manhattan parking stats were compared with the average value per acre of agricultural land in FarmLife magazine.

In 25 years, the cost of an acre of agriculture farmland rose 309% while a Manhattan parking space rose 855% over the same period. Cost? $7,700 per acre for California agricultural land versus $55.5 million per acre for a Manhattan parking spot.

Gotta love this comparison.


UPDATE A colleague pointed out that we don’t know how large the average farmland was or whether it had reasonable access to water and electricity. I pointed out that Manhattan parking spaces don’t have electric and water service and seem to be about 100 feet from the elevator. LOL.

Tags: , ,

Get Weekly Insights and Research

Housing Notes by Jonathan Miller

Receive Jonathan Miller's 'Housing Notes' and get regular market insights, the market report series for Douglas Elliman Real Estate as well as interviews, columns, blog posts and other content.

Follow Jonathan on Twitter

#Housing analyst, #realestate, #appraiser, podcaster/blogger, non-economist, Miller Samuel CEO, family man, maker of snow and lobster fisherman (order varies)
NYC CT Hamptons DC Miami LA Aspen
millersamuel.com/housing-notes
Joined October 2007