Matrix Blog

Manhattan

Listing Inventory Trends In The Time Of COVID

December 2, 2021 | 2:49 pm | | Charts |

The Winter 2022 issue of Elliman Magazine was published this week and it is quite a beautiful publication. I created a chart for the publication which compares month listing inventory trends across a number of the markets we cover for Douglas Elliman.


[click to expand image]

Tags: ,


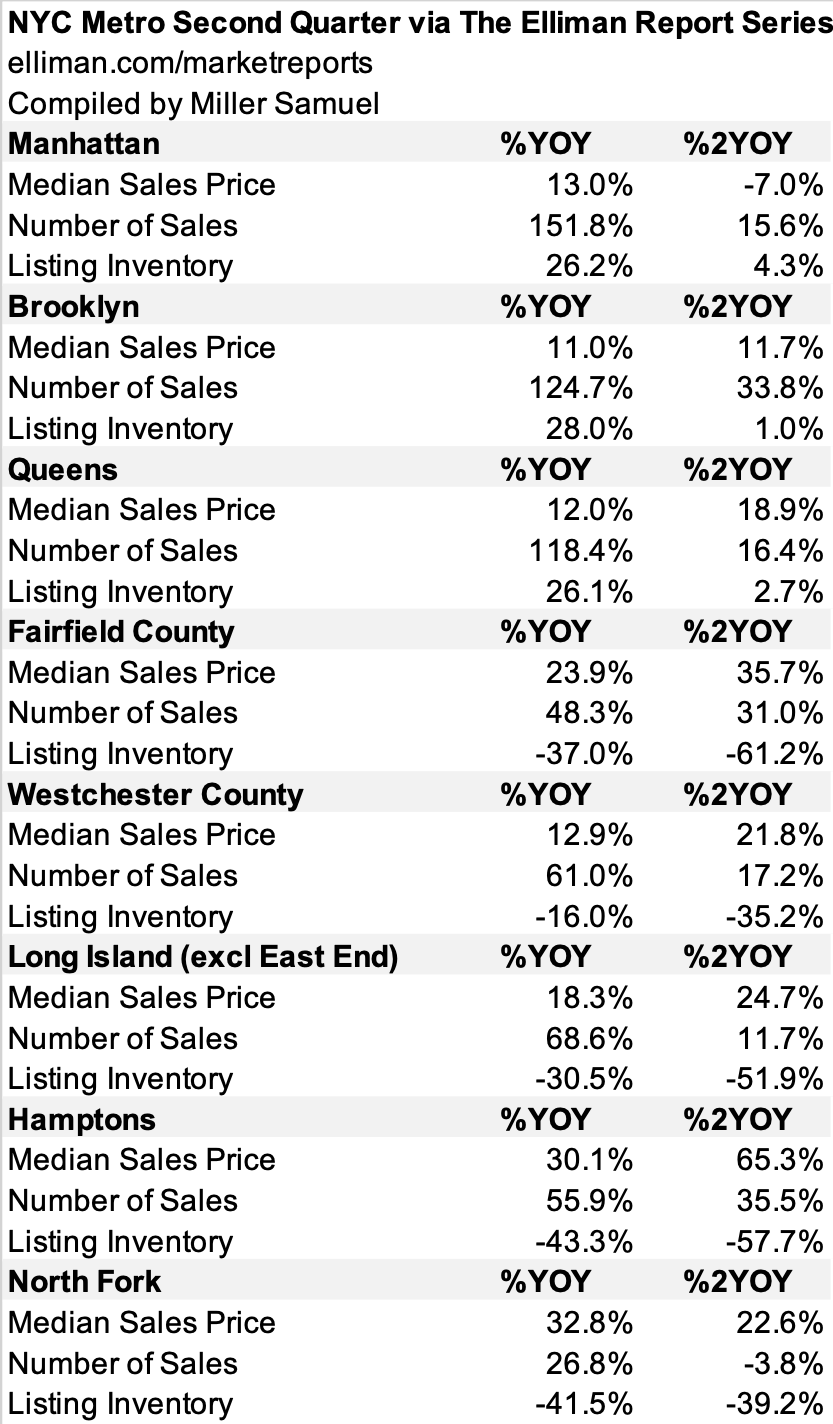
NYC Metro Conditions Much More Robust Than Two Years Ago

August 20, 2021 | 12:56 pm | Infographics |

One of the problems with my normally preferred year-over-year comparisons with metrics to diffuse seasonal impact is that the year-ago period happened to be the pandemic lockdown.

I went through the region using our market report series for Douglas Elliman, comparing the same period two years ago to capture the pre-COV ID market and prices. and sales are up with the exception of Manhattan and North Fork. Listing inventory is up slightly within the city boroughs and plunged in the suburbs.

Tags: ,


[WNBC] The State of New York Real Estate

May 18, 2021 | 9:55 am | | TV, Videos |

Adam Kuperstein at WNBC reached out to do a story on the state of the Manhattan housing market for Douglas Elliman. He got all the nuances right and featured the results of our market research. It was my first tv interview back in my Manhattan office and afterwards I realized I need to warm up my background after using my home office for the past 14 months!


Tags: , , , ,


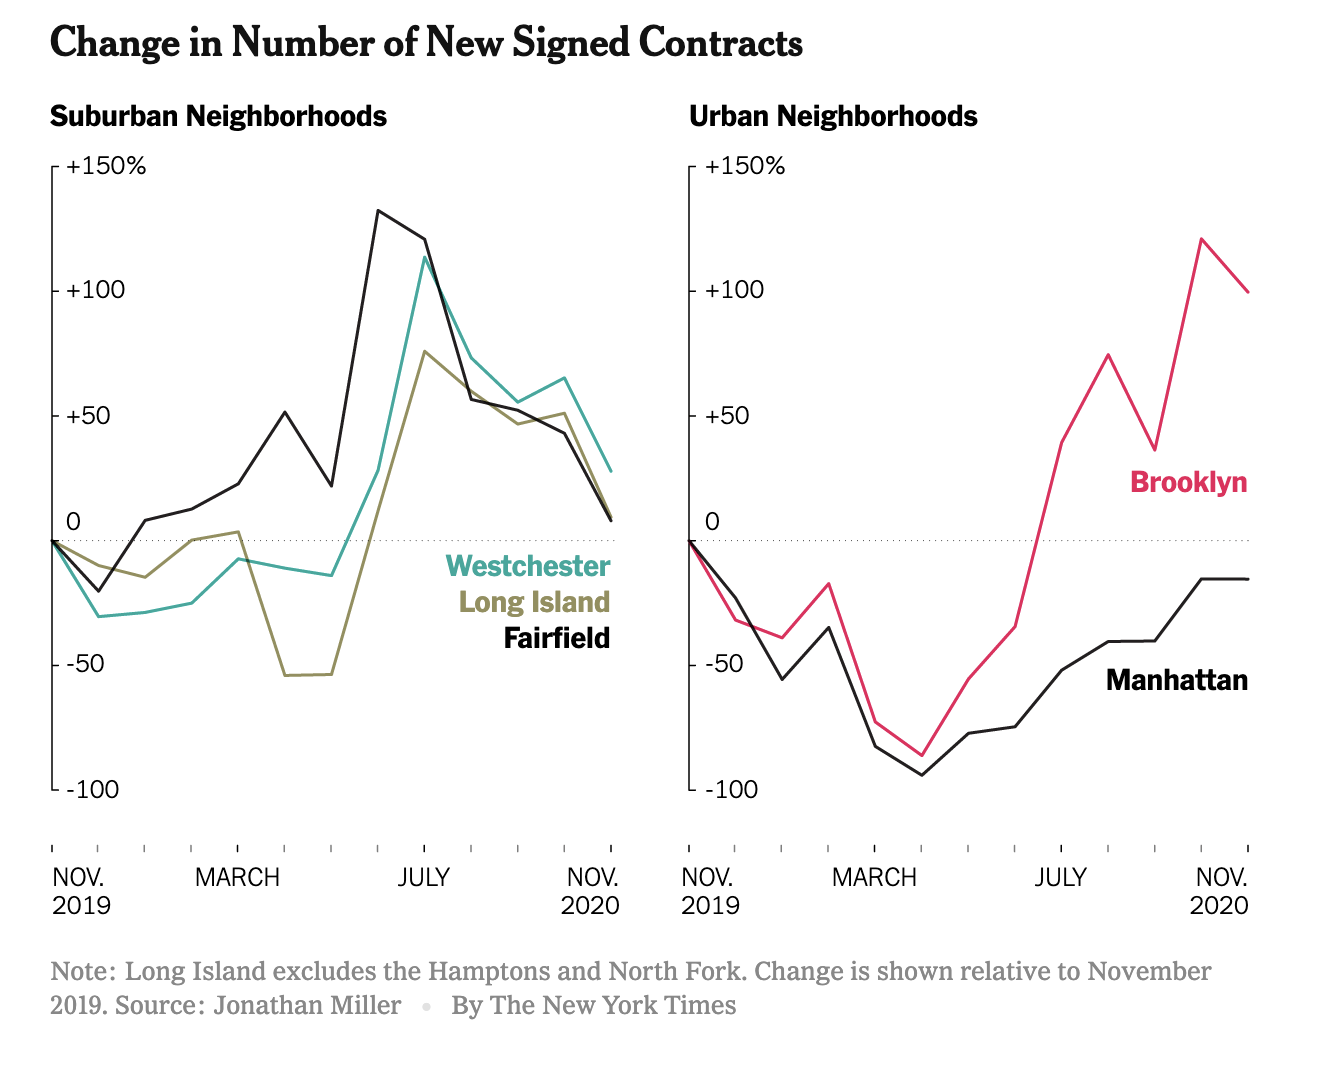
Peak Suburb Has Passed

December 28, 2020 | 2:22 pm | | Explainer |

The New York Times got the market nuances right in their epic end of year The Real Estate Collapse of 2020.

And including epic charts makes it even better.


I noticed that the Streeteasy median rent chart used in the piece shows the same pattern as my recent chart in Bloomberg. That drop in rent is gigantic.


[Source: Bloomberg – click image to open article]

Tags: , , , , , ,


TRD Quick Question: Jonathan Miller “What’s Happening in the NYC Real Estate Market?”

December 28, 2020 | 1:51 pm | | Explainer |

I recently completed a quick interview with Stuart Elliott, Editor In Chief & CEO at The Real Deal who asked me questions with a uniquely mellow intensity. The Real Deal is required reading for anyone in the real estate profession or interested in real estate. Fun.


Tags: , , ,


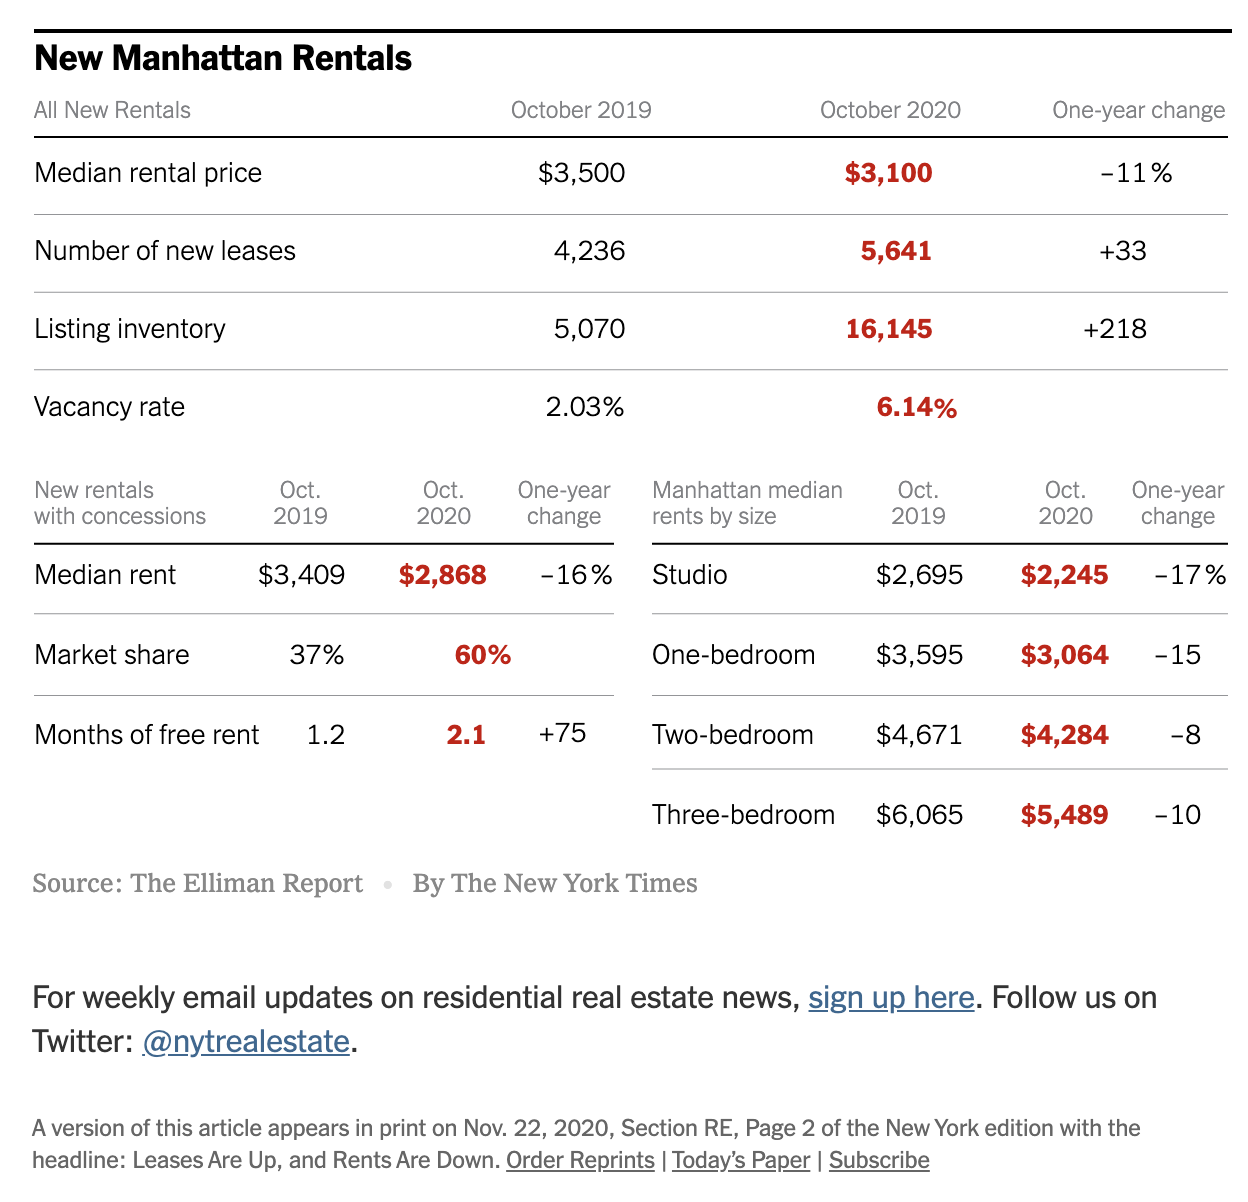
NYT Real Estate: Signs of a Manhattan Rental Market Recovery

November 21, 2020 | 12:49 pm | | Charts |

This weekend’s New York Times Real Estate Calculator column provides a visualization of the recent rental market results in The Elliman Report: October 2020 Manhattan, Brooklyn & Queens Rentals

The Manhattan changes were the most interesting to me – record highs set for the vacancy rate, concession market share, concession amount, yoy% change in median net effective rent overall, studio, 1-bed, & 2-beds. Yet we saw for the first time in fourteen months, a jump in YOY% new lease signings and the highest October new lease signing total on record.

The significantly weaker rental market final hit a point that caused demand to begin to flood back into the market.


[click to open article]

Tags: , , ,


The ‘Urban To Suburban’ Narrative Is Really ‘Manhattan To Suburban’

August 19, 2020 | 1:26 pm | | Charts |

This post previously appeared in the August 14, 2020 edition of Housing Notes. I’ve been writing these weekly summaries on housing topics for more than five years. To subscribe for free, you can sign up here. Then you can look forward to each issue every Friday at 2pm New York Time.

The New York Times created a terrific graphic on our Elliman New Signed Contract Report by illustrating the performance of Manhattan and Brooklyn versus Westchester County. Brooklyn’s sales market performance is closer to Westchester than it is to its city counterpart.


Tags: , , , ,


[Spectrum TV/NY1] Stuy Town Vacancies Surge 7/6/20

July 7, 2020 | 8:34 am |

Michael Herzenberg of NY1 did a great story on the exodus from Stuy Town after the landlord provided terms for people to break their leases. The story was inspired by a press release from CHIP (I haven’t seen) which talked about the pandemic exodus as the reason for the rising vacancies. I thought that was a bit of hyperbole since the other key factor has been the inability of the real estate brokerage industry to do in-house showings by state mandate until June 22nd. The lack of mobility has also been a key factor in driving vacancy higher.

Tags: , , ,


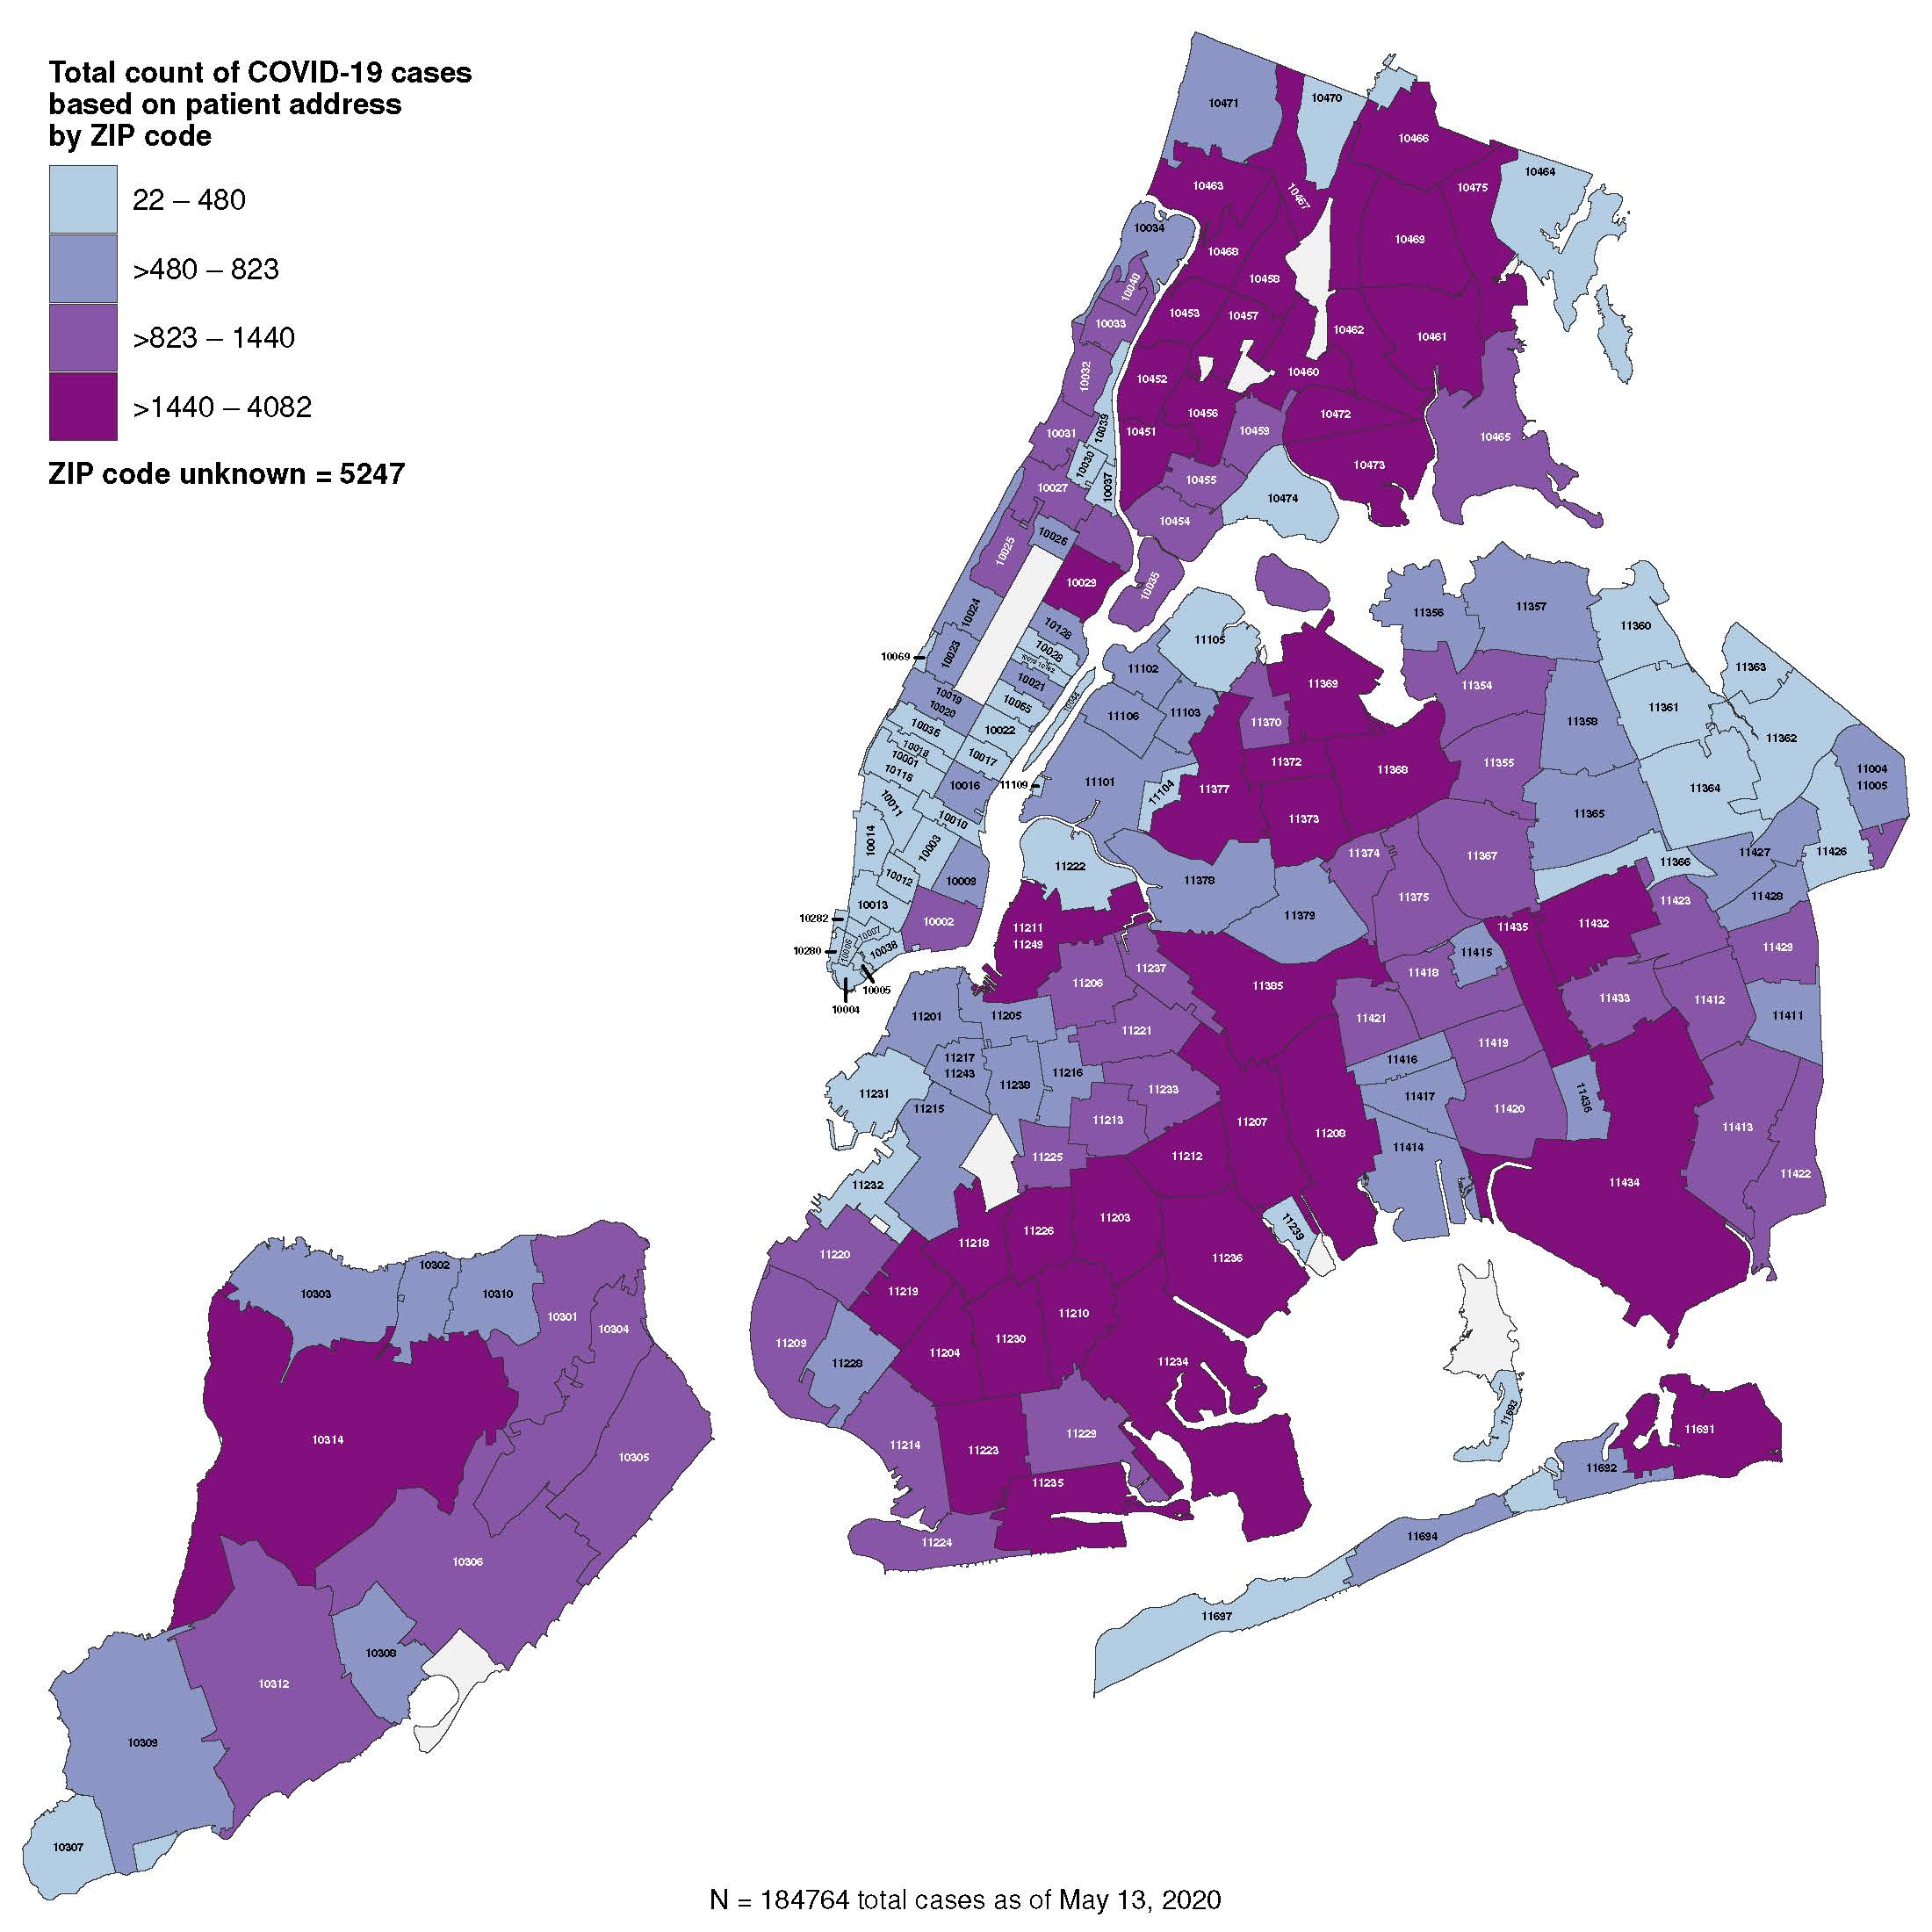
The Overstated COVID-19 Blame on Urban Density in Favor of Suburban Living

May 20, 2020 | 1:06 pm | Explainer |


[NYC.gov]

One of the pieces of conventional wisdom we have picked up during the COVID-19 crisis is that high-density residential living will be less favored. The city to suburban migration pattern is already beginning in New York City and could last several years. The rising number of suburban single-family rental inquiries from the city has provided the initial evidence of a trend. City residents seem to be looking to test drive the suburbs and commute to their city job when “shelter in place rules begin to ease.”

Unfair Reputation?

New York City has developed a national reputation as a hotbed of Coronavirus infection because of our higher density. We live a lot closer together than a sprawling suburb in Dallas and have a greater dependency on public transportation such as the subway and buses instead of driving cars. I live in Fairfield County, Connecticut, a bedroom suburb of New York City with a county-wide COVID-19 ratio of 1068 deaths per its 943,332 population. Dallas County, Texas, had 153 deaths per its 2.636 million people. My county has a wildly higher death rate than a county that contains an urban core like Dallas.

Is the city to suburban trend sustainable?

New Yorkers buy into the urban to the suburban narrative, so I believe the push to the outlying NYC metro suburbs could be quite significant in the near term. While the outbound migration began a few years ago, it is not clear whether the trend can continue for more than a few years. The pattern could ultimately be different from what is currently expected including:

  • A boost for second-home markets: There might be an influx of demand to areas the Hudson Valley, Northern Connecticut The Hamptons, and the North Fork, to name a few. Consumers made begin to view a second home as an equal asset to the primary home to have similar quality options. This potential trend would be contrarian to other significant economic downturns as second-homes are not considered “second-priority.”

  • And because the implications of the SALT tax will remain in place on the other side of the COVID-19 crisis, Florida and Texas can make a compelling pitch to New York City couples with small children cooped up in 1,000 square foot 2-bedroom apartments right now. They are realizing they aren’t as tethered to their work location as they once thought – and schooling via Zoom is not all it’s cracked up to be.

I think that the high-density lifestyle of New York City is what makes living there so great. I’ve lived in or around New York City since the mid-80s. Before we moved to the city, my dad used to proclaim:

Where else can you buy strawberries at 3 am in the morning?!?!?

Placing strawberries aside, I remain skeptical that the urban to suburban outbound migration can be sustained long term. We saw the same outbound pattern after 9/11 and then an inbound return only a few years later.

Density is not the only reason

Urban density is just one reason for the high COVID-19 infection rate that is driving outbound migration. It is not the reason. Other factors influencing the disparity in the infection rate include neighborhood characteristics such as wealth, commute time, and the concentration of multi-generational households.

The map above confirms the argument that it’s not all about density – the highest infection rates are in the “suburban-like” areas of the city including Staten Island and the outer reaches of Brooklyn and Queens. Manhattan, home for many of the tall commercial and residential towers the city is famous for, has the lowest infection rate.

These Manhattan results might help maintain the enthusiasm for that occasional 3 am strawberry run to the corner market.

Tags: , , , , ,


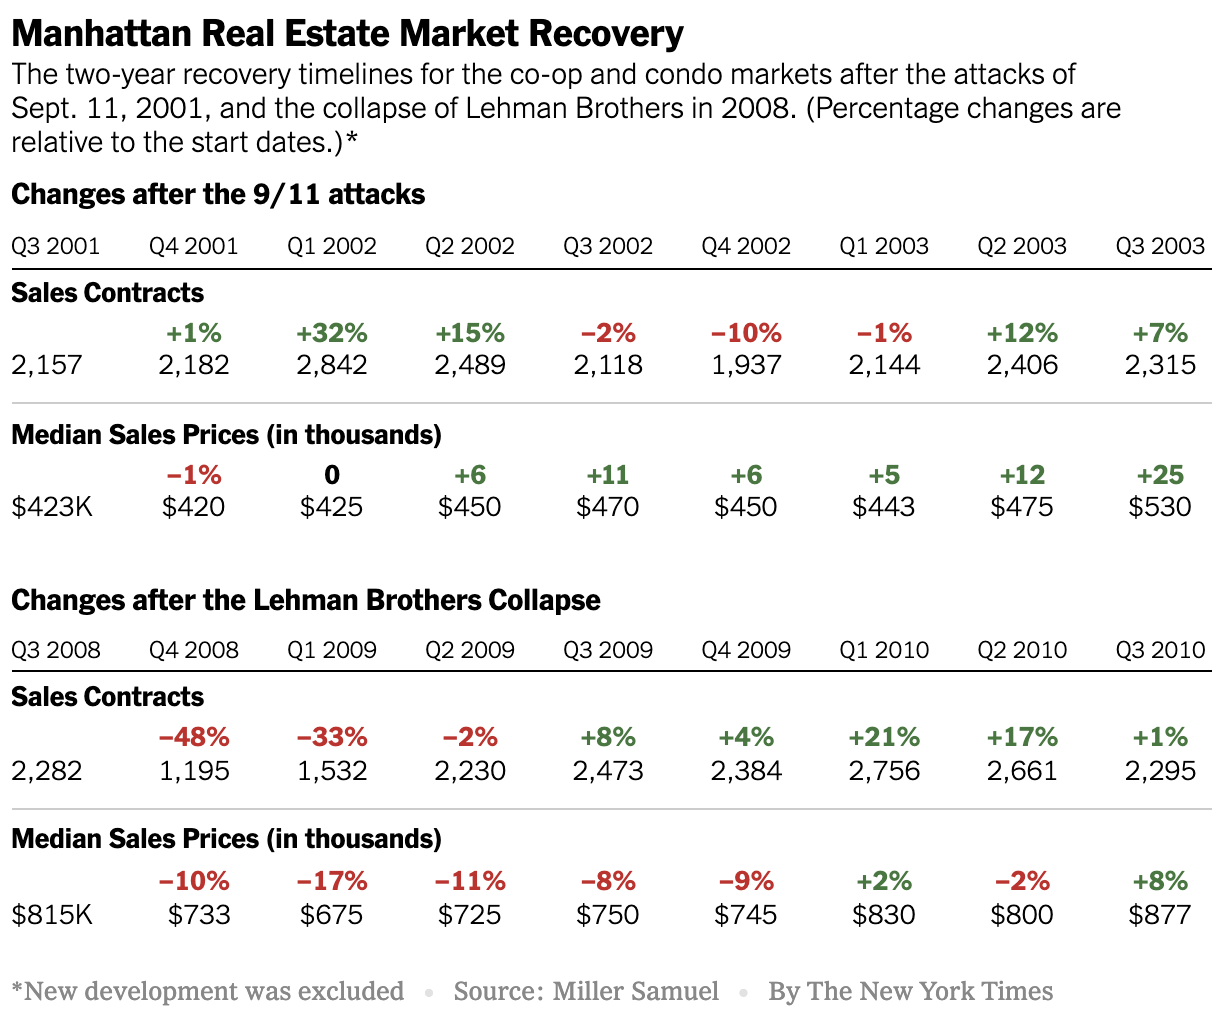
Manhattan Crisis: What Does Our Housing Past Tell Us About Our Housing Future?

May 7, 2020 | 1:02 pm | |

In this Sunday’s New York Times Real Estate Section (online now), the Calculator column featured some data trends I’ve gathered during two significant prior housing market events: What Can 9/11 and the Great Recession Tell Us About Coronavirus Recovery?

Tags: , , , , , , ,


Establishing the COVID-19 Demarcation Line: From ‘Hanks To Banks’

April 28, 2020 | 5:26 pm | Milestones |

This topic was explored in last Friday’s Housing Notes.

In order to understand what is happening now, we need to ween ourselves off of what happened before this crisis and focus on finding data exclusive to the post-COVID-19 era. In Manhattan, that data set is not yet apparent because we are in nearly a total market shut down but it is evident elsewhere to a limited degree. From my perspective, the demarcation line for the onset of the crisis is where market participants would have to be living in a cave on a desert island to be unaware of the sharp pivot in market sentiment.

March 15, 2020

I believe that date is March 15th which is the date of the Federal Reserve federal funds rate cut to zero and was their second cut in less than two weeks.

March 11, 2020

My friend and California appraiser Ryan Lundquist proclaimed March 11th which was the date Tom Hanks announced he and his wife had contracted COVID-19. Phil Crawford of Voice of Appraisal said the demarcation line was March 5, 2020 dubbing it “data point zero” and I had originally said the demarcation line was March 3, 2020, on the day of the 0.5% rate cut in March.

I was talking about this difference in these dates with a friend, Chicagoan, and RAC appraiser Michael Hobbs who brilliantly dubbed this four-day window from March 11 to March 15 as: “From Hanks To Banks.”

And if you do the math, the median and average date of March 11 and March 15 is literally Friday the 13th so what more confirmation of a demarcation line do you need?

Whatever your specific local demarcation line is, use it to keep the data for these two market periods separate.

Tags: , , ,


More Bloomberg Media Hits On Real Estate and the Coronavirus

April 5, 2020 | 2:29 pm | | Podcasts |

If you missed this week’s Housing Notes, here are two Bloomberg clips (from radio and TV) where I break down the state of the market post-Coronavirus:


Bloomberg Radio: Surveillance – ‘Jonathan Miller…details how the housing market is dealing with fallout from the coronavirus.’

I spoke with Tom Keene and Lisa Abramowicz on Bloomberg Radio’s morning show “Surveillance” on the state of the housing market.

The full segment is a great listen. My interview starts at 21:33.


[click image to play]


Bloomberg TV: Markets – ‘Manhattan Home Sellers Hold Back Listings During Coronavirus’

I joined network Vonnie Quinn in New York to talk about the state of the market since the coronavirus hit. She is always wonderful to speak with. The stock photo they used for me was taken about 15 years ago (when I was 15, obviously). At the last second, they had me speak through their London bureau for technical reasons, so each question and answer saw a small delay. The interview was based on this Bloomberg article: Manhattan Home Sellers Hold Back Listings in Coronavirus Retreat:


Tags: , , , , , ,

Get Weekly Insights and Research

Housing Notes by Jonathan Miller

Receive Jonathan Miller's 'Housing Notes' and get regular market insights, the market report series for Douglas Elliman Real Estate as well as interviews, columns, blog posts and other content.

Follow Jonathan on Twitter

#Housing analyst, #realestate, #appraiser, podcaster/blogger, non-economist, Miller Samuel CEO, family man, maker of snow and lobster fisherman (order varies)
NYC CT Hamptons DC Miami LA Aspen
millersamuel.com/housing-notes
Joined October 2007