Matrix Blog

Palm Beach

Listing Inventory Trends In The Time Of COVID

December 2, 2021 | 2:49 pm | | Charts |

The Winter 2022 issue of Elliman Magazine was published this week and it is quite a beautiful publication. I created a chart for the publication which compares month listing inventory trends across a number of the markets we cover for Douglas Elliman.


[click to expand image]

Tags: ,


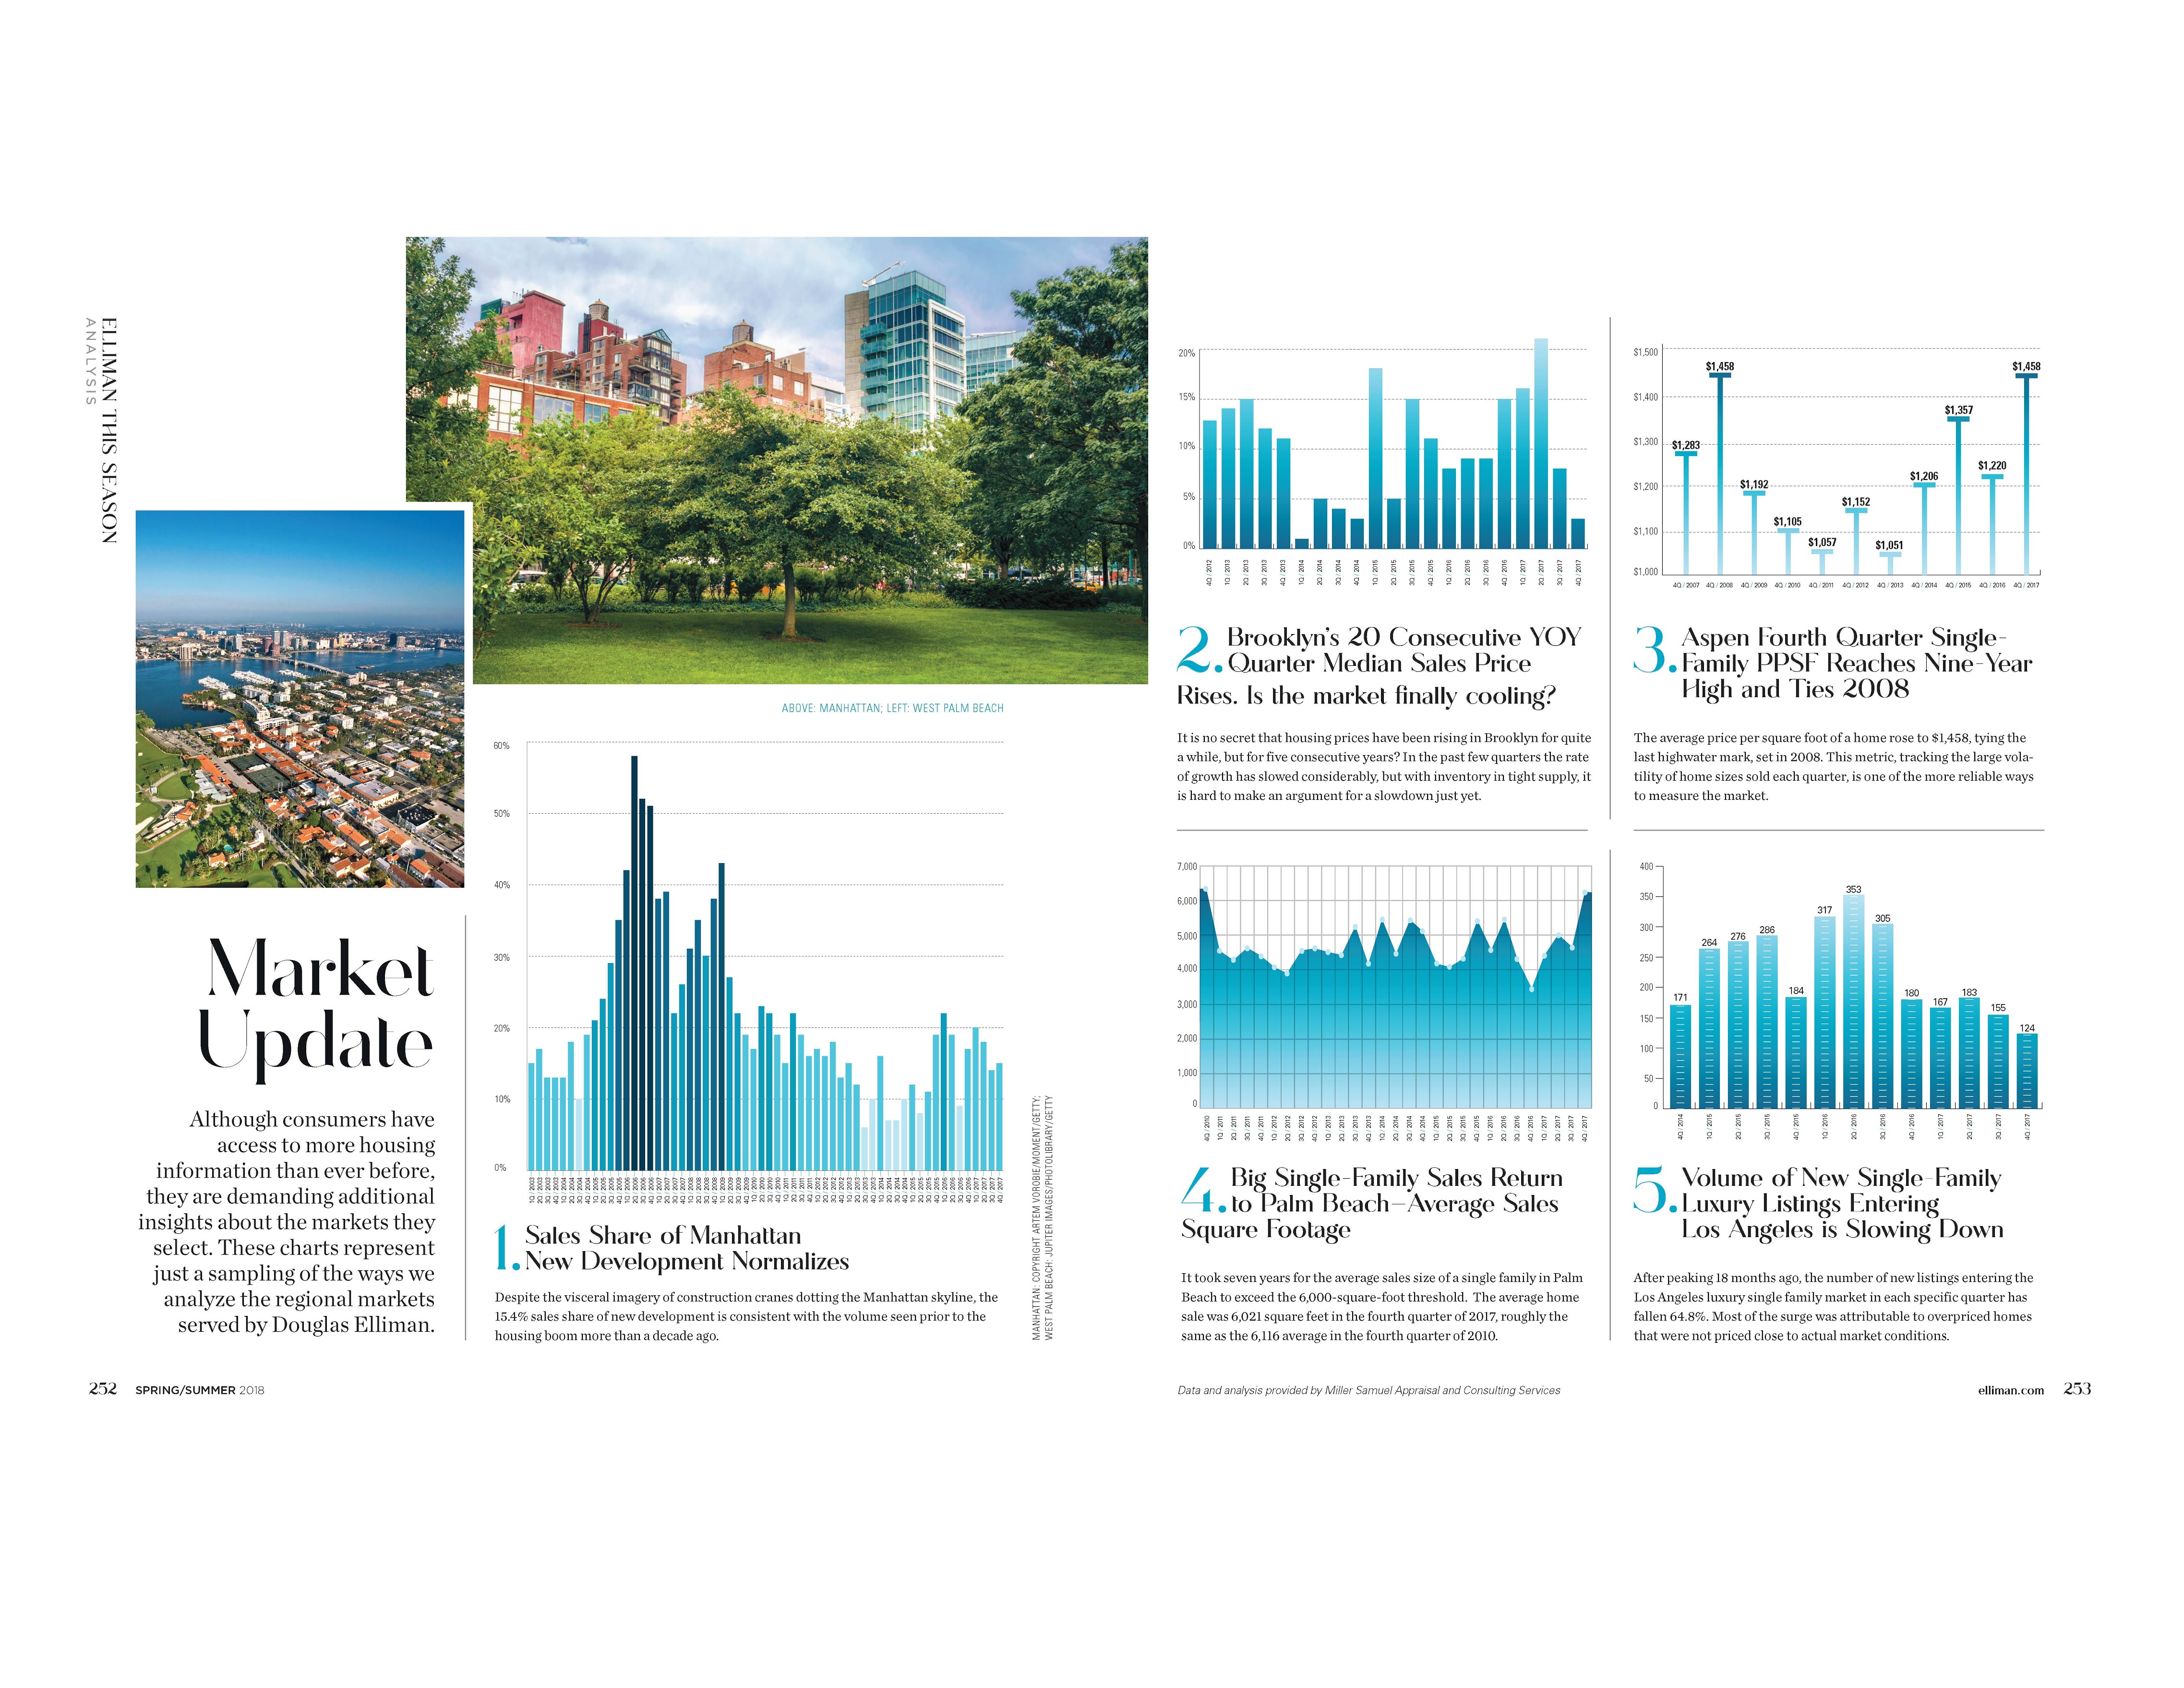
Elliman Magazine Spring Edition – 5 Charts

April 15, 2018 | 4:10 pm | | Infographics |

Every seasonal edition, Douglas Elliman Real Estate asks me to provide a visual market update for their magazine in any 5 of the markets they cover nationwide. The following graphic is found in their latest Elliman Magazine.

Click on the following graphic to see my charts in all their majesty.

Tags:


John Burns Has It Wrong, Luxury Home Sales Are Not Increasing

December 11, 2016 | 8:56 pm |

Last week a newsletter from John Burns Consulting got big SEO points by exclaiming that Wall Street Has It Wrong: Luxury Home Sales Increasing. Normally his firm is a good source of housing research, but this time they missed the mark on New York City, even when using facts.

While facts are provided and luxury sales are rising in markets like DC, there is a lack of proper context and this is a challenge that national analysts face when looking at specific market subsets. In this analysis, the luxury market was arbitrarily defined as having a $600,000 threshold. In a number of high cost housing markets on the following chart, their luxury threshold is equivalent to the entry or middle market, which I agree, is booming.

I took a look at markets I report on: Kings County (Brooklyn) and Manhattan. Their respective median sales prices of $735,000 and $1,073,750 are higher than $600,000. The John Burns definition for luxury would include more than half of these respective housing markets.

jbc-yoysalesabove600k

Besides the random threshold selection, their reasons seem to be weak. This list of common perceptions that would explain our underestimate of the strength of the luxury sales market are provided by them. I provide a subsequent clarification for each.

1. New disclosure laws. Foreign-buyer activity has slowed in two high-profile markets, Manhattan and Miami, due to threat of enforcement of new disclosure laws that began in 2016.

The market in both of these markets actually slowed sharply well before the new disclosure laws were in place. And foreign buyer participation in NYC has long been over-hyped.

2. High-profile Florida second-home markets. High-priced homes have indeed slowed in two of the highest-profile second home markets in the country, Naples (Collier County) and Palm Beach. These are two of the six counties where sales have declined.

Again county-wide prices set way below the actual luxury market may be the problem. Within Palm Beach County, I cover Palm Beach and the luxury market starts just below $5 million. In arguably the most expensive city in this county, the median price for all property types is just below their $600,000 luxury threshold.

3. Fortune article on Greenwich, CT. The sales slowdown in high-profile Greenwich, CT, was featured in Fortune magazine. The article included some very misleading headlines about a national luxury slowdown that were supported only by the fact that prices have appreciated 5% at the high end compared to more appreciation at lower prices.

This is an odd interpretation of the Greenwich market. I track this market in my research, live near it and have relatives that live there. This Fortune article was not misleading. Prices have not appreciated 5% at the Greenwich high end and $600,000 might not even buy you a starter home there. In fact, their luxury market has still not recovered from housing bubble.

4. Increased $1 million new-home supply. New-home sales have slowed in a few new-home markets due to a surge in competitive supply. Coupling this surge in supply, builders have pushed prices too high in comparison to the resale competition due to rising costs.

Why is this perception wrong? Excess or rising luxury supply is apparent across the 28 markets I research.

5. Improving entry-level sales. Entry-level sales are also improving at a faster rate than higher-priced home sales. Indeed, the market for lower-priced homes is stronger, but that does not mean that luxury sales are struggling.

True, but I think the disconnect is just the opposite. The luxury market is soft so many market participants assume the entry level is soft as well and yet it is seeing heavy sales volume.

Since housing across the U.S. is softer at the top, Wall Street looks like they have been correct about luxury. Placing a uniform threshold across a slew of different U.S. housing markets doesn’t tell us anything. Stick to specifics since that’s where you provide solid research.

Tags: ,


Tracking the Flock of (Ultrawealthy) Seagulls

March 6, 2016 | 10:02 am | |

There has been voluminous discussion in recent years about following and marketing to the high end of the demographic scale, especial the real estate market. It’s been the focus of much of the new housing development action of the past five years, especially in big U.S. coastal cities. The high end development market has been widely chronicled here and within my weekly Housing Notes newsletter.

For buyers in the super luxury housing market, owning multiple homes is less about a primary residence with a second home and more about owning “stops on the big circuit.”

And as the rich own a greater share of real estate, major cities like New York, Los Angeles and London are going through a kind of “resortification,” familiar to posh beach towns or ski resorts, as their populations become more seasonal.

For Manhattan, these birds are rare in February and squawking on all treetops (bad pun for super tall condo penthouses) at full capacity in June.

nytcityhopping

And no, I never liked that band.

Tags: , , , , , , ,


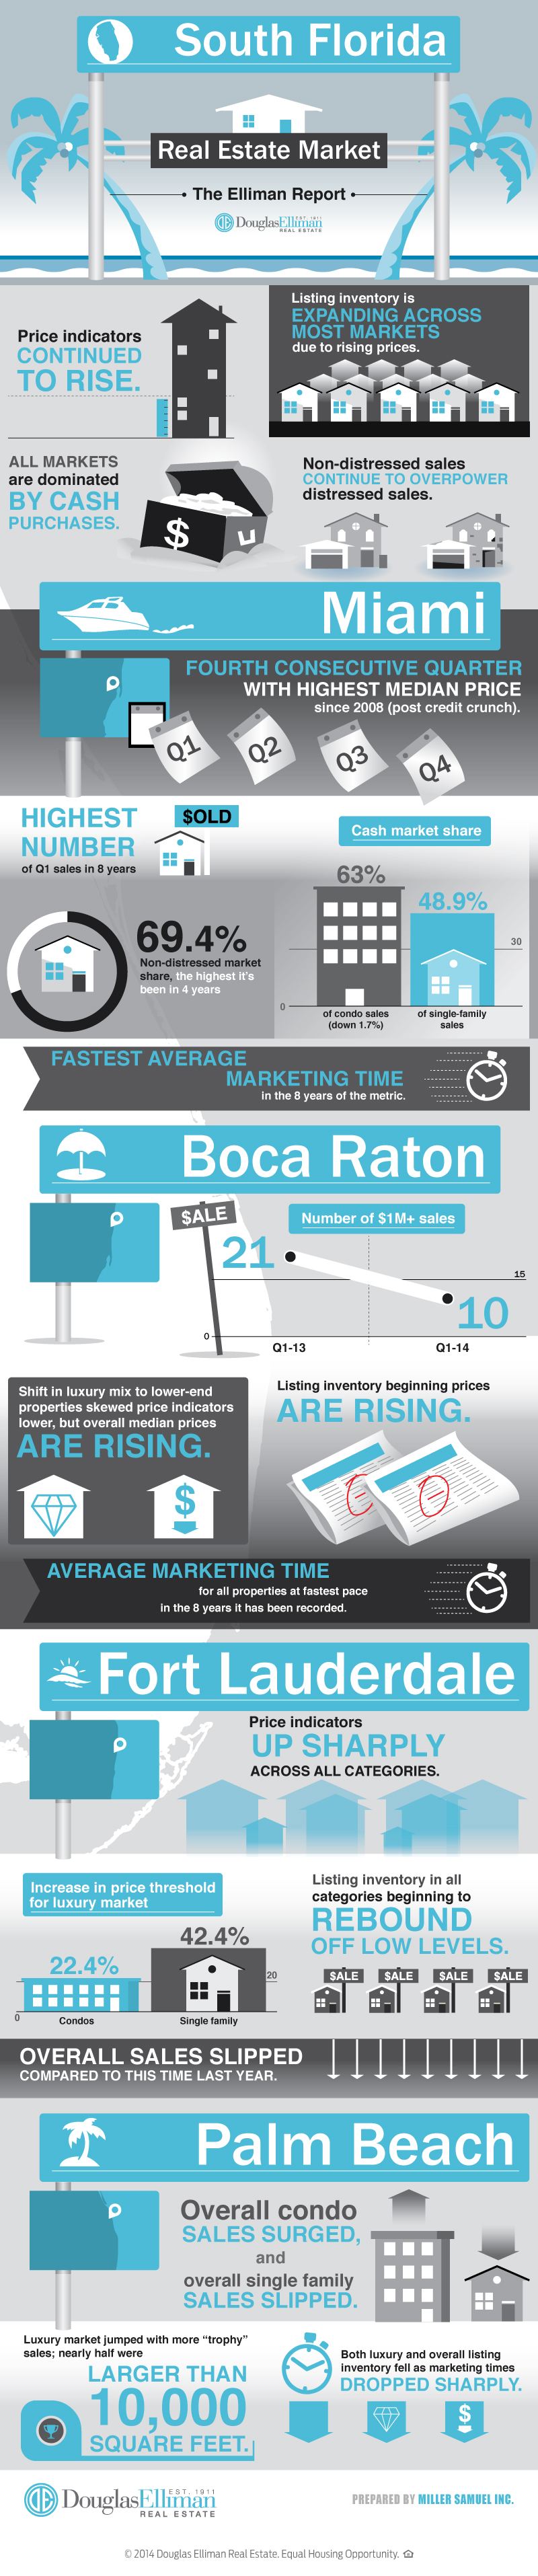
[Infographic] Getting Graphic in South Florida in 1Q 2014

April 18, 2014 | 4:30 pm | | Infographics |

Here’s a jumbo infographic from Douglas Elliman covering the findings of the four market reports in South Florida we prepare for them. Thank goodness Matrix can handle super tall images.

1q14infographicelliman-florida


[Ready, Set, Download] South Florida Market Reports 1Q 2014

April 18, 2014 | 4:01 pm | | Reports |

Our 4 comprehensive reports for Douglas Elliman on the residential sales markets for Miami, Boca Raton, Fort Lauderdale and Palm Beach this week.

Click on each report to download!

Miami_1Q14

MIAMI
With the Miami housing market well into the third year of its recovery, rising prices have begun to pull listing inventory into the market. Median sales price increased 16.1% to $244,000, the highest point reached since 2008. Average sales price jumped 19.1% to $461,374 over last year to a 5 year high and average price per square foot exceeded $305 per square foot for the first time in 6 years. Listing inventory bottomed in the second quarter of 2013, trending higher, up 15.2% to 12,664 from the prior year quarter. Along with the rise in supply, demand continued to rise. The number of sales rose 3.9% to 5,133 from the prior year quarter, to the highest first quarter total in the 8 years this metric has been tracked. The market share of distressed sales, once the majority of the market, continued to decline. Excluding short sales and foreclosures, market share rose to 69.4%, the highest level reached in the 4 years this metric has been tracked. The number of distressed listings and distressed With the Miami housing market well into the third year of its recovery, rising prices have begun to pull listing inventory into the market. Median sales price increased 16.1% to $244,000, the highest point reached since 2008. Average sales price jumped 19.1% to $461,374 over last year to a 5 year high and average price per square foot exceeded $305 per square foot for the first time in 6 years…

BocaRaton_1Q14

BOCA RATON
CONDO Median sales price surged 16.3% to $150,000 and average sales price declined 8.8% to $229,569 respectively from the prior year quarter. Listing discount, the percent difference between the list price at time of contract and the sales price, rose to 7% from 3.8% in the prior year quarter, but fell from 7.7% in the prior quarter…

SINGLE FAMILY Median sales price jumped 19.4% to $370,000 and average sales price rose 5.3% to $528,616 respectively from the prior year quarter. Listing discount edged up to 6.9% from 6.1% in the prior year quarter, as sellers were slightly more optimistic when determining their listing price…

FtLauderdale_1Q14

FORT LAUDERDALE
CONDO Median sales price jumped 19.8% to $255,000 from the same quarter last year, the highest level reached since 2008. Average sales price followed the same pattern, rising 23.9% to $379,391 over the same period also reaching a 5 year high.

SINGLE FAMILY The average time to market a property was 91 days, essentially unchanged from 90 days in the prior year quarter. Listing discount, the percentage difference between the list price at time of contract and the sales price, jumped to 8.1% from 4.5% as sellers pressed list prices higher than market trends support.

PalmBeach_1Q14

PALM BEACH
CONDO There were 68 sales during the quarter, 25.9% more than the same period last year. Listing inventory fell 16.9% to 360 over the same period. As a result the absorption rate, the number of months to sell all inventory at the current pace of sales, fell 34% to 15.9 months from the same period last year. The faster market pace pushed down days on market, the number of days from the last price change to the contract date, by 10 days to an average of 182 days.

SINGLE FAMILY Median sales price increased 10.7% to $3,100,000 from the prior year quarter to the highest first quarter reached since 2009. Average sales price jumped 56.7% to $6,450,093 over the same period. The average square footage of a sale was 5,261, up 20.9% from the prior year quarter.

Tags:


3Q 2013 Market Report Gauntlet Comes to a Close

October 26, 2013 | 5:15 pm | | Reports |

This week marked the end of what I call the “quarterly gauntlet” market report releases that I author for Douglas Elliman. If you’re interested, we’ve analyzed a bunch of markets:

NYC Metro Area
Manhattan Sales
Manhattan & Brooklyn Rentals
Brooklyn Sales
Queens Sales
Westchester/Putnam Sales
Long Island Sales
Hamptons Sales
North Fork Sales

South Florida
Miami Sales
Boca Raton Sales
Fort Lauderdale Sales
Palm Beach Sales

I’ve been writing this expanding report series for Douglas Elliman since 1994. You can also build custom data tables on information included in the reports using our aggregate database and a growing library of market charts.


Reporting from South Florida 2Q13: Miami, Boca Raton, Fort Lauderdale and Palm Beach

July 18, 2013 | 5:05 pm | | Reports |

Today Douglas Elliman published four 2Q 2013 South Florida market reports we prepare that include Miami, Boca Raton, Fort Lauderdale and Palm Beach.


1Q 2013 South Florida Housing Market Reports Gone Wild

May 13, 2013 | 9:20 am | | Reports |


[click images to open each market report]

We recently completed the 1Q 2013 South Florida market report series for Douglas Elliman. These markets include Miami, Boca Raton, Fort Lauderdale and Palm Beach.


[Tightening] 4Q 2012 Palm Beach Report

January 21, 2013 | 10:49 pm | | Reports |

We published our inaugural report on the Palm Beach, Florida sales market for 4Q 2012.   This is part of an evolving market report series I’ve been writing for Douglas Elliman since 1994.

Key Points

  • Luxury market prices outpaced the overall market.
  • Overall price indicators show sharp year over year gains.
  • Overall sales levels trending higher.
  • Days on market expanded as demand worked off older inventory.
  • Negotiability between buyers and seller fell sharply.


    Here’s an excerpt from the report:
CONDO/TOWNHOUSE Median sales price jumped 23.9% from the same quarter last year to $588,750. Average sales price and average price per square foot edged 5.8% and 1.3% respectively over the same period. Number of sales jumped 56.1% year-overyear to 64 sales, but remained unchanged from the prior quarter…

SINGLE FAMILY Although this market segment represents a narrow submarket of Palm Beach, the number of sales nearly doubled from prior year levels, reaching 26. All price indicators showed double-digit year-over-year gains; median sales price increased 13% to $2,775,000 over the period, while average sales price and average price per square foot showed larger gains, rising 32% and 26.1% respectively…

You can build your own custom data tables. We’ll be adding a chart library for this market area shortly.


The Elliman Report: 4Q 2012 Palm Beach [Miller Samuel]
The Elliman Report: 4Q 2012 Palm Beach [Douglas Elliman]
Aggregated Custom Market Data Tables [Miller Samuel]


[Buyers Sellers Closer] 3Q 2012 Palm Beach Report

October 20, 2012 | 2:00 pm | | Reports |

We published our inaugural report on the Palm Beach, Florida sales market for 3Q 2012.   This is part of an evolving market report series I’ve been writing for Douglas Elliman since 1994.

Key Points

-Condo sales reached their second highest level in more than six years.
-Buyers and sellers moved closer together on price and the market appears to be absorbing more of the older listing inventory.
-Single family homes selling 2 months faster than a year ago.


Here’s an excerpt from the report:

CONDO/TOWNHOUSE The number of sales jumped 45.5% to 64 units in the third quarter, from the prior year quarter. The year-to-date number of sales is at its second highest level in more than six years. Median sales price increased 3.3% to $390,000 from the prior year quarter, while average sales price and average price per square foot increased 6.5% and 27.7% respectively…

SINGLE FAMILY Median sales price increased 5.7% to $2,600,000 from the prior year quarter. Average sales price and average price per square foot dropped 16.4% and 15.1% over the same period. Arguably a small submarket that could be characterized as stable, the number of sales fell to 23 from 25 in the prior year quarter…

You can build your own custom data tables on the market – will be updated with 3Q 12 data shortly NOW UPDATED FOR 3Q12. We’ll be adding a chart library for this market area soon!


The Elliman Report: 3Q 2012 Palm Beach [Miller Samuel]
The Elliman Report: 3Q 2012 Palm Beach [Douglas Elliman]
Aggregated Custom Market Data Tables [Miller Samuel]


[Sand and Sales] 2Q 2012 Palm Beach Report

July 31, 2012 | 9:18 pm | | Reports |

We published our inaugural report on the Palm Beach, Florida sales market for 2Q 2012.   This is part of an evolving market report series I’ve been writing for Douglas Elliman since 1994.

Key Points

Palm Beach, Florida

-Condo sales were up sharply over year ago levels while single family sales slipped over the same period.
-Condo median sales price showed large increase as single family median sale price fell below year ago levels.
-Days on market fell from year ago levels for both condos, single family and luxury properties.
-North End sales edged higher as prices declined.
-South End sales were up sharply over year ago levels while median sales price edged higher.

Here’s an excerpt from the report:

CONDO/TOWNHOUSE Median sales price was $470,000, up 16% from $405,000 in the same period last year. Average sales price and average price per square foot increased 11.9% and 2.7% respectively over the same period. There were 119 sales this quarter, 22.7% more than in the prior year quarter…

SINGLE FAMILY There were 39 sales in the second quarter, 11.4% below the 44-sale total in the prior year quarter. The time to sell a property fell by more than two months over the same period. Days on market averaged 250 days, 67 days faster than 317 days in the same period last year…

You can build your own custom data tables on the market – now updated with 2Q 12 data. We’ll be adding a chart library for this market area soon!


The Elliman Report: 2Q 2012 Palm Beach [Miller Samuel]
The Elliman Report: 2Q 2012 Palm Beach [Douglas Elliman]
Aggregated Custom Market Data Tables [Miller Samuel]

Get Weekly Insights and Research

Housing Notes by Jonathan Miller

Receive Jonathan Miller's 'Housing Notes' and get regular market insights, the market report series for Douglas Elliman Real Estate as well as interviews, columns, blog posts and other content.

Follow Jonathan on Twitter

#Housing analyst, #realestate, #appraiser, podcaster/blogger, non-economist, Miller Samuel CEO, family man, maker of snow and lobster fisherman (order varies)
NYC CT Hamptons DC Miami LA Aspen
millersamuel.com/housing-notes
Joined October 2007