Matrix Blog

Statistics, Metrics & Data

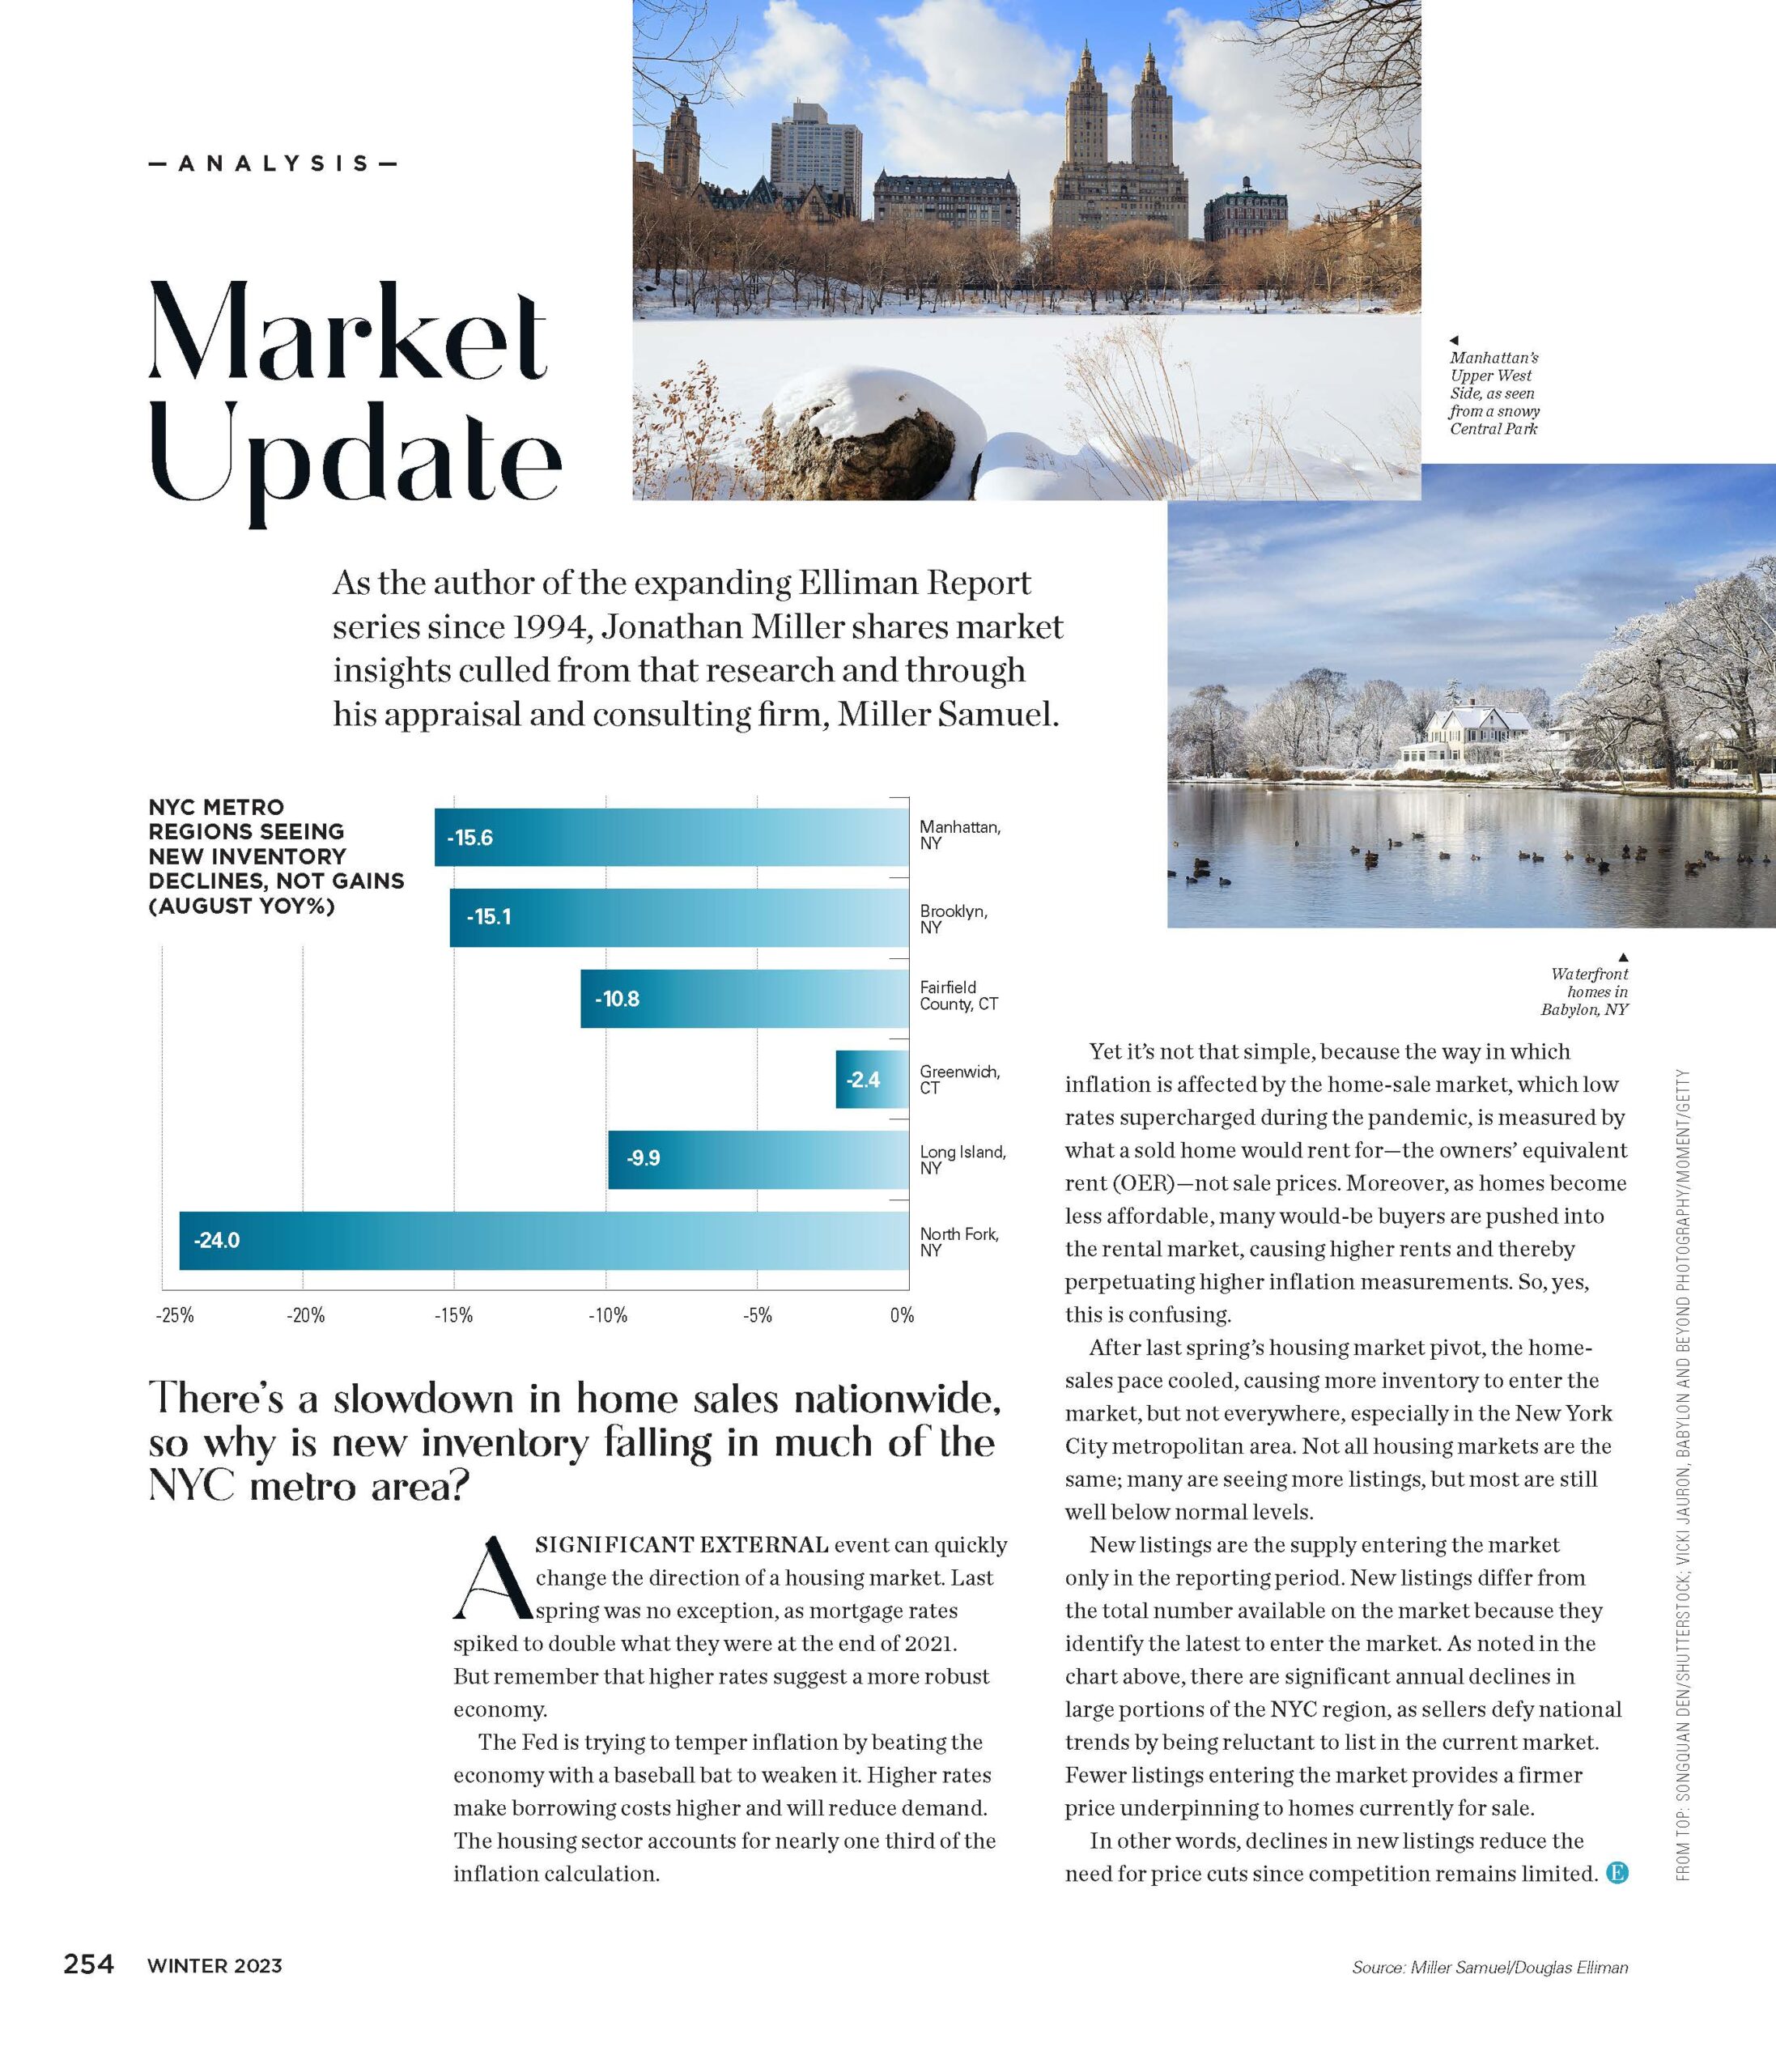
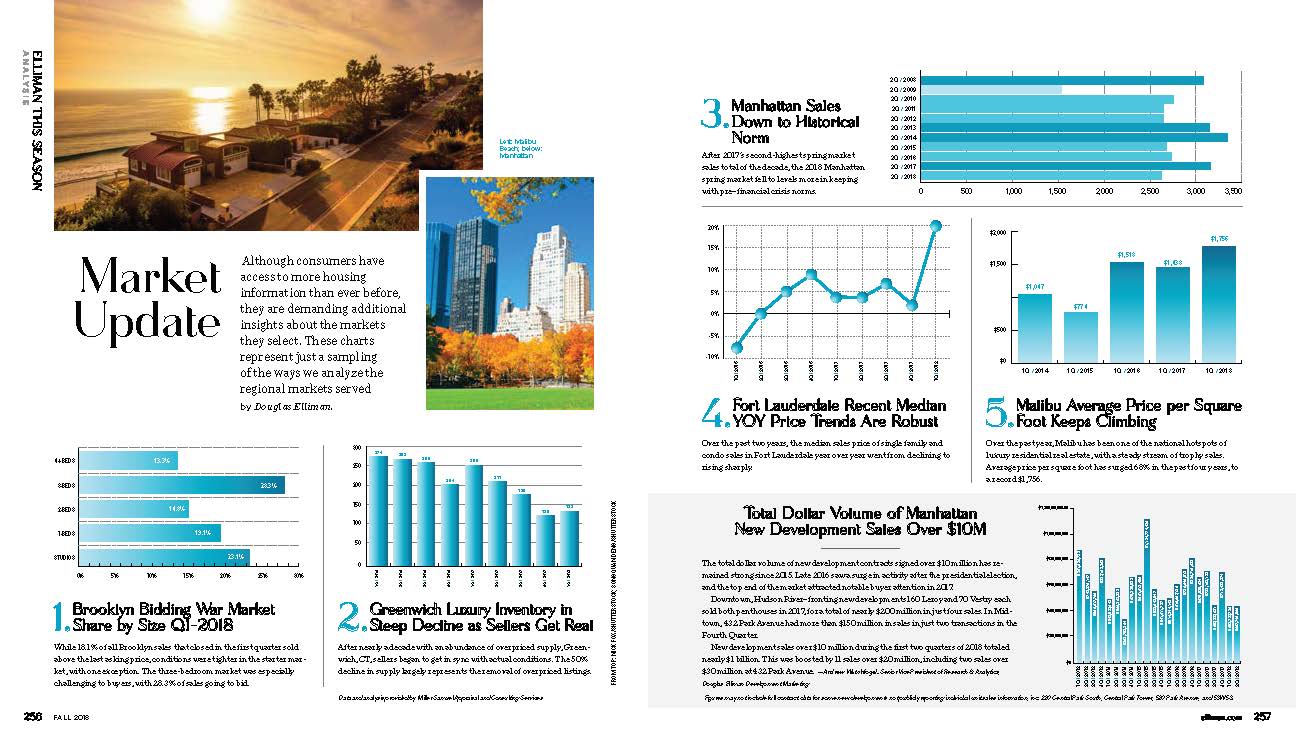
Elliman Magazine Column “Market Update” – New Inventory Is Falling

December 8, 2022 | 2:12 pm | |

I write a column for Elliman Magazine called “Market Update” that presents a chart and context around it. Its kind of like my nine-year column “Three Cents Worth” at the old Curbed but more grown-up and without the snark.


Tags: , , ,


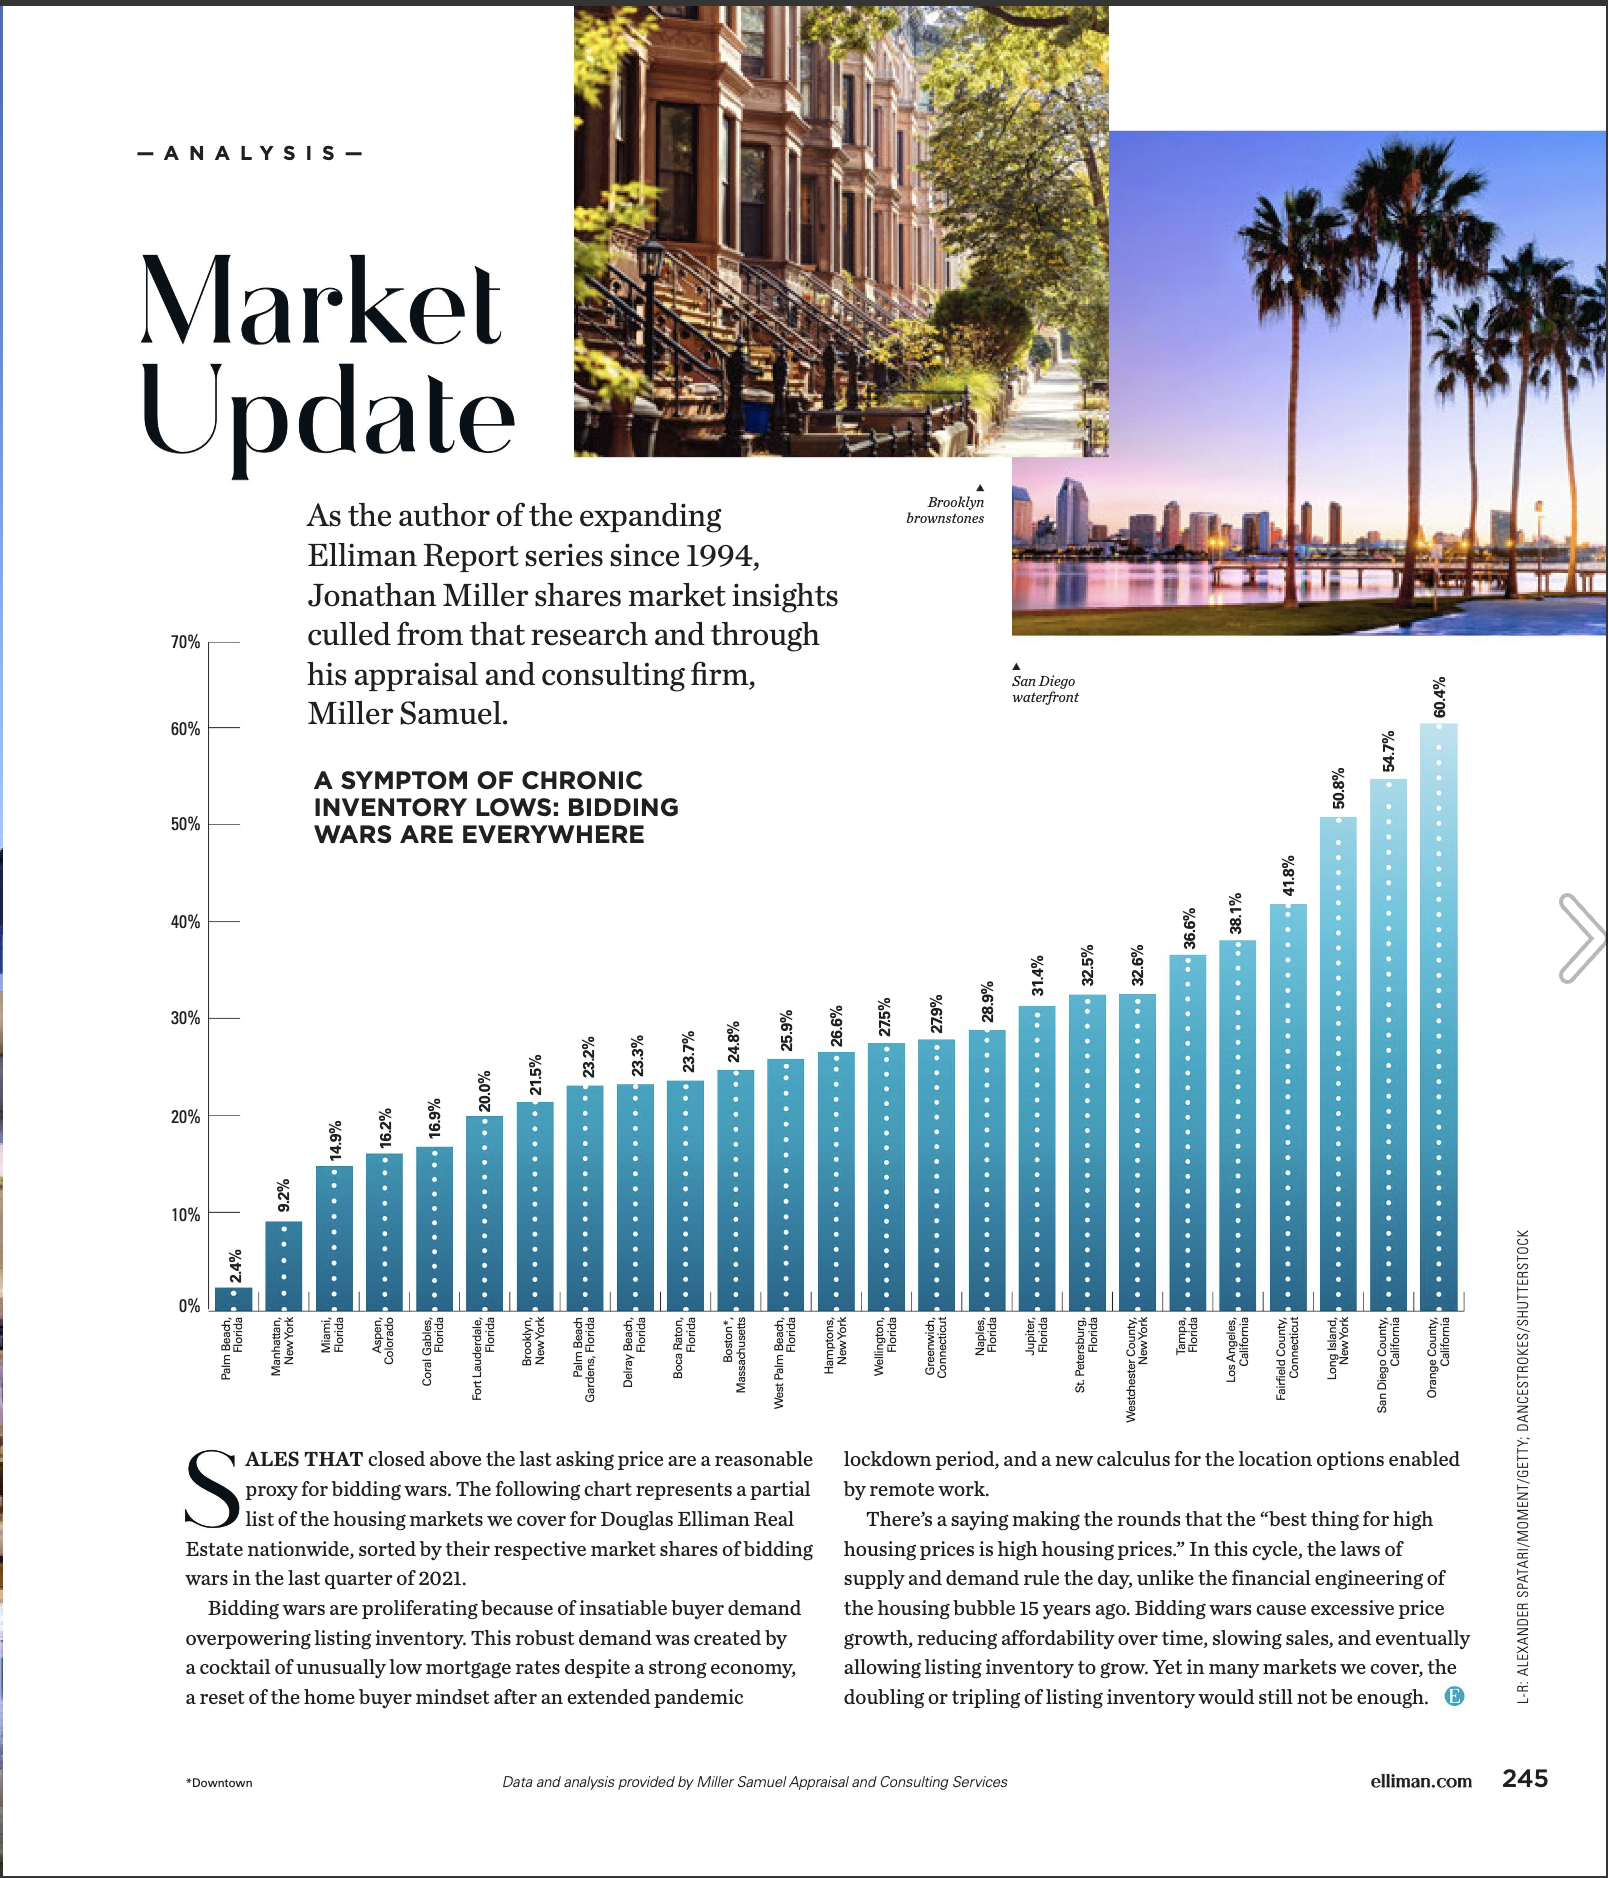
Elliman Magazine Column – A Symptom of Chronic Inventory Lows: Bidding Wars Are Everywhere

April 14, 2022 | 4:35 pm | | Charts |

For each issue of Elliman Magazine produced by Douglas Elliman, the same company that publishes most of our U.S. market research, I write a brief column and create a graphic to illustrate an important issue facing the luxury housing market. Of course, the graphic I create is then supercharged by their very talented graphics staff.

Listing inventory has essentially collapsed in most U.S. housing markets as unusually low rates against the backdrop of robust economic conditions have burned off supply to record lows. Evidence of this is seen in the proliferation of U.S. housings markets with a significant share of bidding wars. Since these are broad markets, various submarkets can see the market share at must higher levels. The proxy for market share is the share of transactions that close above the asking price at time of sale against total period sales.

In the current issue of Elliman Magazine: Spring/Summer 2022, my column “A Symptom of Chronic Inventory Lows: Bidding Wars Are Everywhere”


[click to expand]

Tags: , , ,


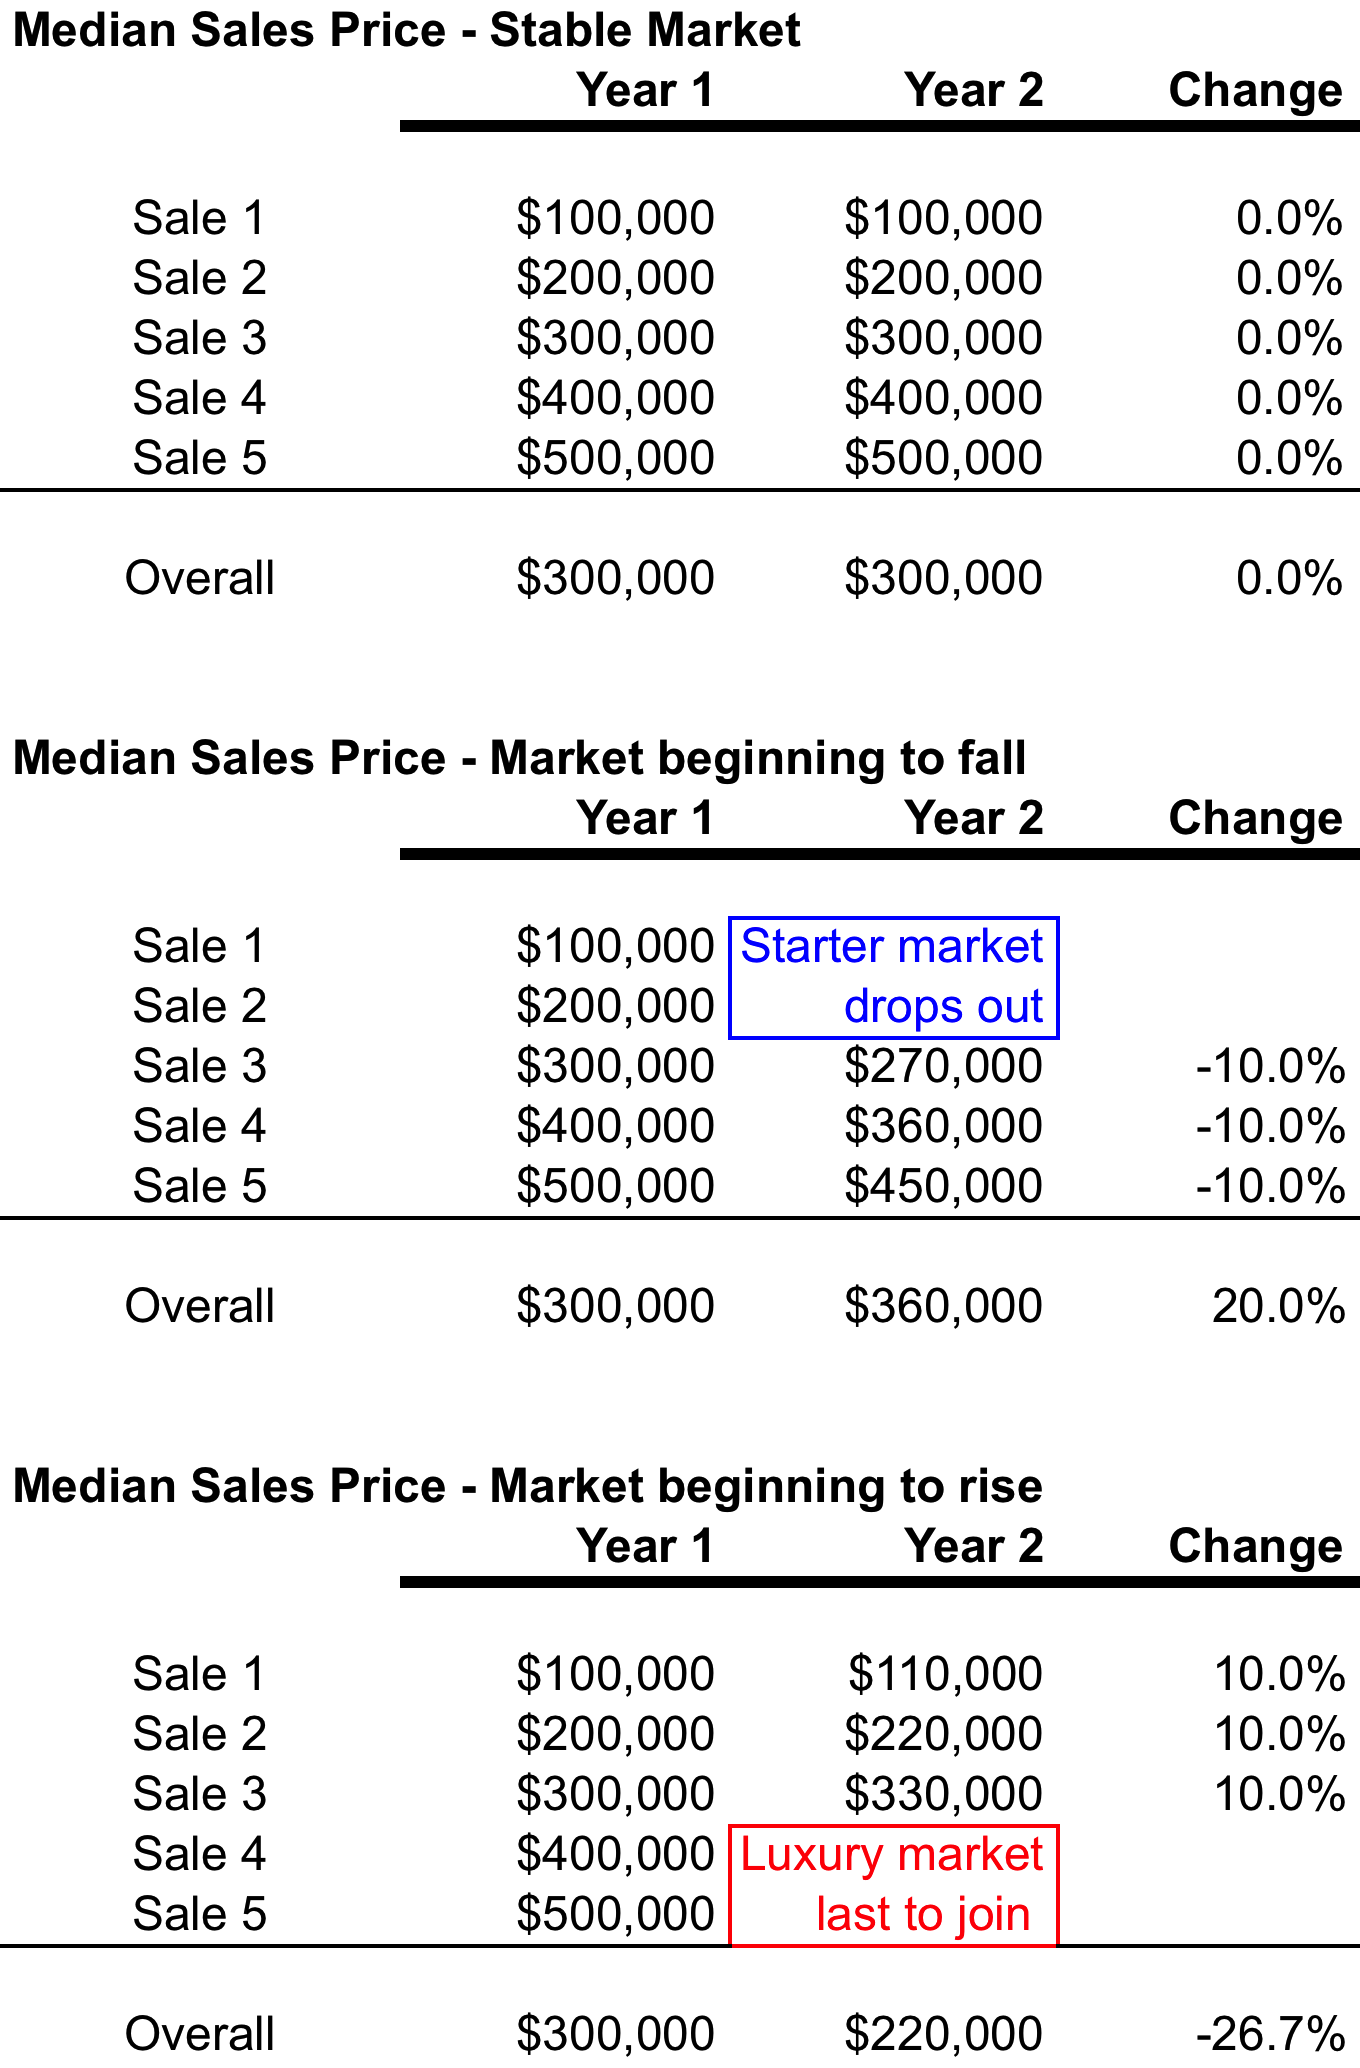
Median sales price can be subject to skew by consumer behavior more than math

May 12, 2020 | 11:19 am | Explainer |

Here’s an updated excerpt from my Housing Note newsletter dated October 28, 2016, digging into the median sales price. You can subscribe to Housing Notes and other housing resources for free.


I wrote about the median sales price a decade ago, and the message still holds. A couple of years ago, I whipped up a table that shows how median sales price can perform in a changing housing market. The median sales price is the default price trend indicator of real estate because it eliminates the extreme highs and lows of a data and merely represents the middle number. However, it is also subject to skew by consumer behavior that can overpower the math. So I always provide two to three price trend indicators depending on the quality of available information (average sales price, median sales price, median sales price) for all of the reports in my Elliman Report Series. The relationship between median and average sales price can also tell a story.

Click on the graphic below to expand.

medianexplained

Tags: ,


Contract Data Is Pending Data Is Lagging Data

April 29, 2020 | 11:50 am | Explainer |

In our post-Coronavirus world, it is clear that market conditions and our understanding of the future are subject to change every day. In my prior post Establishing the COVID-19 Demarcation Line: From ‘Hanks To Banks’, data that falls after the line represents a different market.

So how do we determine what data falls in after the demarcation line? It’s not as straightforward as it sounds.

Throughout my career, I have seen brokerage firms publish pending/contract reports, touting pending trends as more reliable than reports based on closings. I don’t look at them as better or worse, just a different way to look at the market. The simplistic, uninformed argument for pending sales is that contract dates occur before closing dates, so they are more current. Incidentally, contract prices are not readily shared. I get all of this. Yet I have seen the failure rate of contracts be as high as 40% – in other words, many contracts might not close whereas closing reports are solely based on successful transactions. Still, pending sale trends are useful as long as the reader understands their shortcomings. I plan to develop one someday.

Closing data and contract/pending data lags the “meeting of the minds.

Meeting of the minds (also referred to as mutual agreement, mutual assent, or consensus ad idem) is a phrase in contract law used to describe the intentions of the parties forming the contract. In particular, it refers to the situation where there is a common understanding in the formation of the contract.

While we know that closing dates lag the “meeting of the minds,” we also need to understand that signed contract dates are lagging indicators, often by 2-4 weeks. During this crisis, I’m speculating the failure rate will be high initially, and the time lag will be on the longer end rather than, the shorter end of this 2-4 week range.

Here’s why contract dates are a lagging indicator and not necessarily more insightful than closing data:

1) The “meeting of the minds” occurs when buyers and sellers negotiate price and terms, usually facilitated by a real estate agent or broker.

2) The price and terms are handed off to transaction attorneys who work together to craft language agreeable to both parties.

3) The contract is signed by both parties and often indicated as such in an MLS-type system.

4) In some markets or marketing periods, especially when a market is cooling, many contracts never close, so their initial inclusion makes pending trends reports suspect.

If there is a four week signed contract lag from the meeting of the minds, and considering the March 15 demarcation line for post-Coronavirus, that means that with us being six weeks into the crisis, we are only able to see two weeks worth of post-Coronavirus data. And even with that reality and current shelter in place rules, many current contracts might have been older deals that were facilitated by the buyer who had already inspected the home in January/February – we are seeing some of that now.

In other words, relevant data on the new market remains extremely limited.

Tags: , ,


Hamptons Sellers Are Starting To Get The Message

May 16, 2019 | 2:01 pm | | Infographics |

Michael Kolomatsky of the Calculator column in the New York Times real estate section crafted a cool infographic for this weekend using data from the Douglas Elliman‘s Hamptons Sales report that I author. The gist of it is that sellers are slowly pricing closer to market causing days on market and the listing discount to compress somewhat. This faster moving pattern is in sharp contrast to sliding price trends, declining sales, and rising inventory. The narrative in this market clearly reflects a slowdown, but with a vibrant regional economy, the buyers are here, but unwilling to pay at price levels of a few years ago.

Tags: , , ,


Elliman Magazine Winter 2019 – Market Update

December 14, 2018 | 3:18 pm | | Charts |

The Winter 2019 Issue of Elliman Magazine was just released. I provided a two-page spread showing various market tidbits on random U.S. markets where Douglas Elliman has a footprint. The magazine is well done and a good aspirational read.


[click to expand]

Here’s the full online version of the magazine:

Tags:


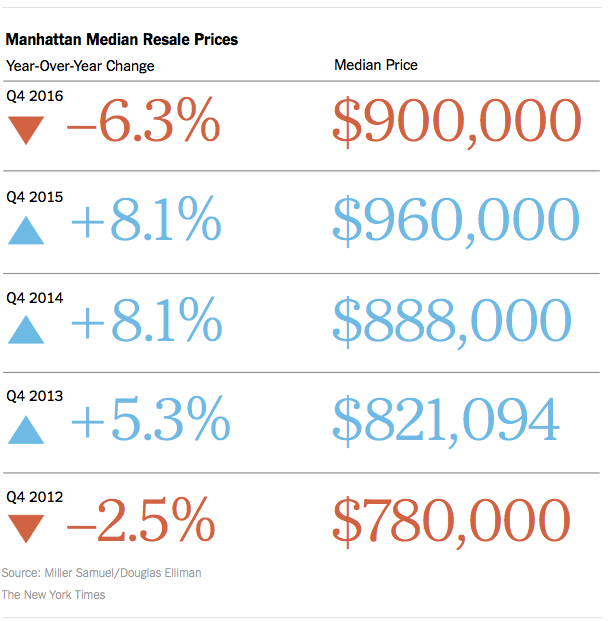
NYT Calculator Chart: The Resale Pendulum Swings Toward Middle

January 21, 2017 | 2:50 pm | | Charts |

I love the way the NYT Real Estate section handled the data from our Elliman Report series to present the Manhattan resale market.

2017-1-22NYTcalculator

I added my chart on bidding wars below – falling as supply enters the market, causing resale prices to soften.

4qoverlistmanhattan

Tags: , , , ,


[Three Cents Worth #288 Hamptons] Comparing Price Trends in the Hamptons and Manhattan

June 3, 2015 | 6:25 pm | | Charts |

It’s time to share my Three Cents Worth (3CW) on Curbed Hamptons, at the intersection of sand dunes and real estate in the East End of Long Island, NY.

Check out my 3CW column on @CurbedHamptons:

Now that we’ve crossed over into June, I thought I’d illustrate the price trend relationship between the Hamptons and Manhattan. The former seeing a majority of single family sales and many second home purchases. The latter with a housing market of 98% apartments and single family family sales are a rounding error. Despite the differences in their housing stock, their behavior in terms of price trends has been similar over the past decade…

3cwH6-1-15

[click to expand charts]


My latest Three Cents Worth column: Three Cents Worth: Comparing Price Trends in the Hamptons and Manhattan [Curbed]

Three Cents Worth Archive Curbed NY

Three Cents Worth Archive Curbed DC

Three Cents Worth Archive Curbed Miami

Three Cents Worth Archive Curbed Hamptons

Three Cents Worth Archive Curbed LA

Three Cents Worth Archive Curbed Ski

Tags: , , , , , , , ,


[Three Cents Worth #286 NY] How Many NYC Apartments Are Bought With Cold Hard Cash?

May 30, 2015 | 5:53 pm | | Charts |

It’s time to share my Three Cents Worth (3CW) on Curbed NY, at the intersection of neighborhood and real estate in the capital of the world…and I’m here to take measurements.

Check out my 3CW column on @CurbedNY:

The Washington Post published an article last year titled “8 in 10 Manhattan home sales are all-cash,” a statement that was (and still is) hyperbole; the actual figure was 45 percent. The data is worth revisiting, though, and I thought it might be a good time to look at the makeup of Manhattan apartment purchases in regards to cash versus financing. Obviously, there has been some confusion in the past, so I thought it would be helpful to display a year’s worth of trend data…

3cw5-27-15

[click to expand chart]


My latest Three Cents Worth column: Three Cents Worth: How Many NYC Apartments Are Bought With Cold Hard Cash? [Curbed]

Three Cents Worth Archive Curbed NY

Three Cents Worth Archive Curbed DC

Three Cents Worth Archive Curbed Miami

Three Cents Worth Archive Curbed Hamptons

Three Cents Worth Archive Curbed LA

Three Cents Worth Archive Curbed Ski

Tags: , , , , ,


[Three Cents Worth #285 Ski] Aspen Real Estate Has Had Many Peaks, But It’s Not Peaking

May 22, 2015 | 8:00 pm | | Charts |

It’s time to share my Three Cents Worth (3CW) on Curbed Ski, whether I’m on the trail or in the base lodge of a ski mountain near you…or I’m in the lift line taking notes with my gloves off.

Check out my 3CW column on @Curbedski:

For my first Three Cents Worth column on Curbed Ski, I felt compelled to provide a look at one of the priciest ski towns around: Aspen, Colorado. As a real estate analyst and appraiser for nearly 30 years (and a skier, of course!) I have relied on information culled during the research for the quarterly housing market report for Douglas Elliman. In Aspen, the first quarter of 2015 reflected a thorough shift towards larger home sales resulting in large aggregate housing prices gains…

3cwASPEN5-21-15

[click to expand chart]


My latest Three Cents Worth column: Three Cents Worth: Aspen Real Estate Has Had Many Peaks, But It’s Not Peaking [Curbed]

Three Cents Worth Archive Curbed NY

Three Cents Worth Archive Curbed DC

Three Cents Worth Archive Curbed Miami

Three Cents Worth Archive Curbed Hamptons

Three Cents Worth Archive Curbed LA

Three Cents Worth Archive Curbed Ski

Tags: , , ,


[Three Cents Worth #283 LA] How Much Does It End Up Costing When a House Lingers on the Market in Los Angeles?

May 21, 2015 | 10:00 am | | Charts |

It’s time to share my Three Cents Worth (3CW) on Curbed LA, texting at the intersection of neighborhood and real estate, just off the freeway.

Check out my 3CW column on @CurbedLA:

Since Los Angeles is all about relationships and you don’t know me (yet), I thought I’d better get started on my first Three Cents Worth Column for Curbed LA. I’ve been compiling and analyzing data for Douglas Elliman’s market report series for more than 20 years and one thing I’ve learned: there is nothing better than a good chart. For this column I thought I’d explore the relationship between days on market and listing discount and how that is changing…

3cw5-21-15

[click to expand chart]


My latest Three Cents Worth column: Three Cents Worth: How Much Does It End Up Costing When a House Lingers on the Market in Los Angeles? [Curbed]

Three Cents Worth Archive Curbed NY

Three Cents Worth Archive Curbed DC

Three Cents Worth Archive Curbed Miami

Three Cents Worth Archive Curbed Hamptons

Three Cents Worth Archive Curbed LA

Three Cents Worth Archive Curbed Ski

Tags: , , , ,


NYC Economy is Expanding Rapidly

January 30, 2015 | 11:05 am | |

NYFedCEI2014

According the Federal Reserve Bank of New York, the NYC economy is crushing it, growing far faster than the states of New York and New Jersey.

They are using an Index of Coincident Economic Indicators:

A coincident index is a single summary statistic that tracks the current state of the economy. The index is computed from a number of data series that move systematically with overall economic conditions.

Get Weekly Insights and Research

Housing Notes by Jonathan Miller

Receive Jonathan Miller's 'Housing Notes' and get regular market insights, the market report series for Douglas Elliman Real Estate as well as interviews, columns, blog posts and other content.

Follow Jonathan on Twitter

#Housing analyst, #realestate, #appraiser, podcaster/blogger, non-economist, Miller Samuel CEO, family man, maker of snow and lobster fisherman (order varies)
NYC CT Hamptons DC Miami LA Aspen
millersamuel.com/housing-notes
Joined October 2007