Matrix Blog

Putnam County

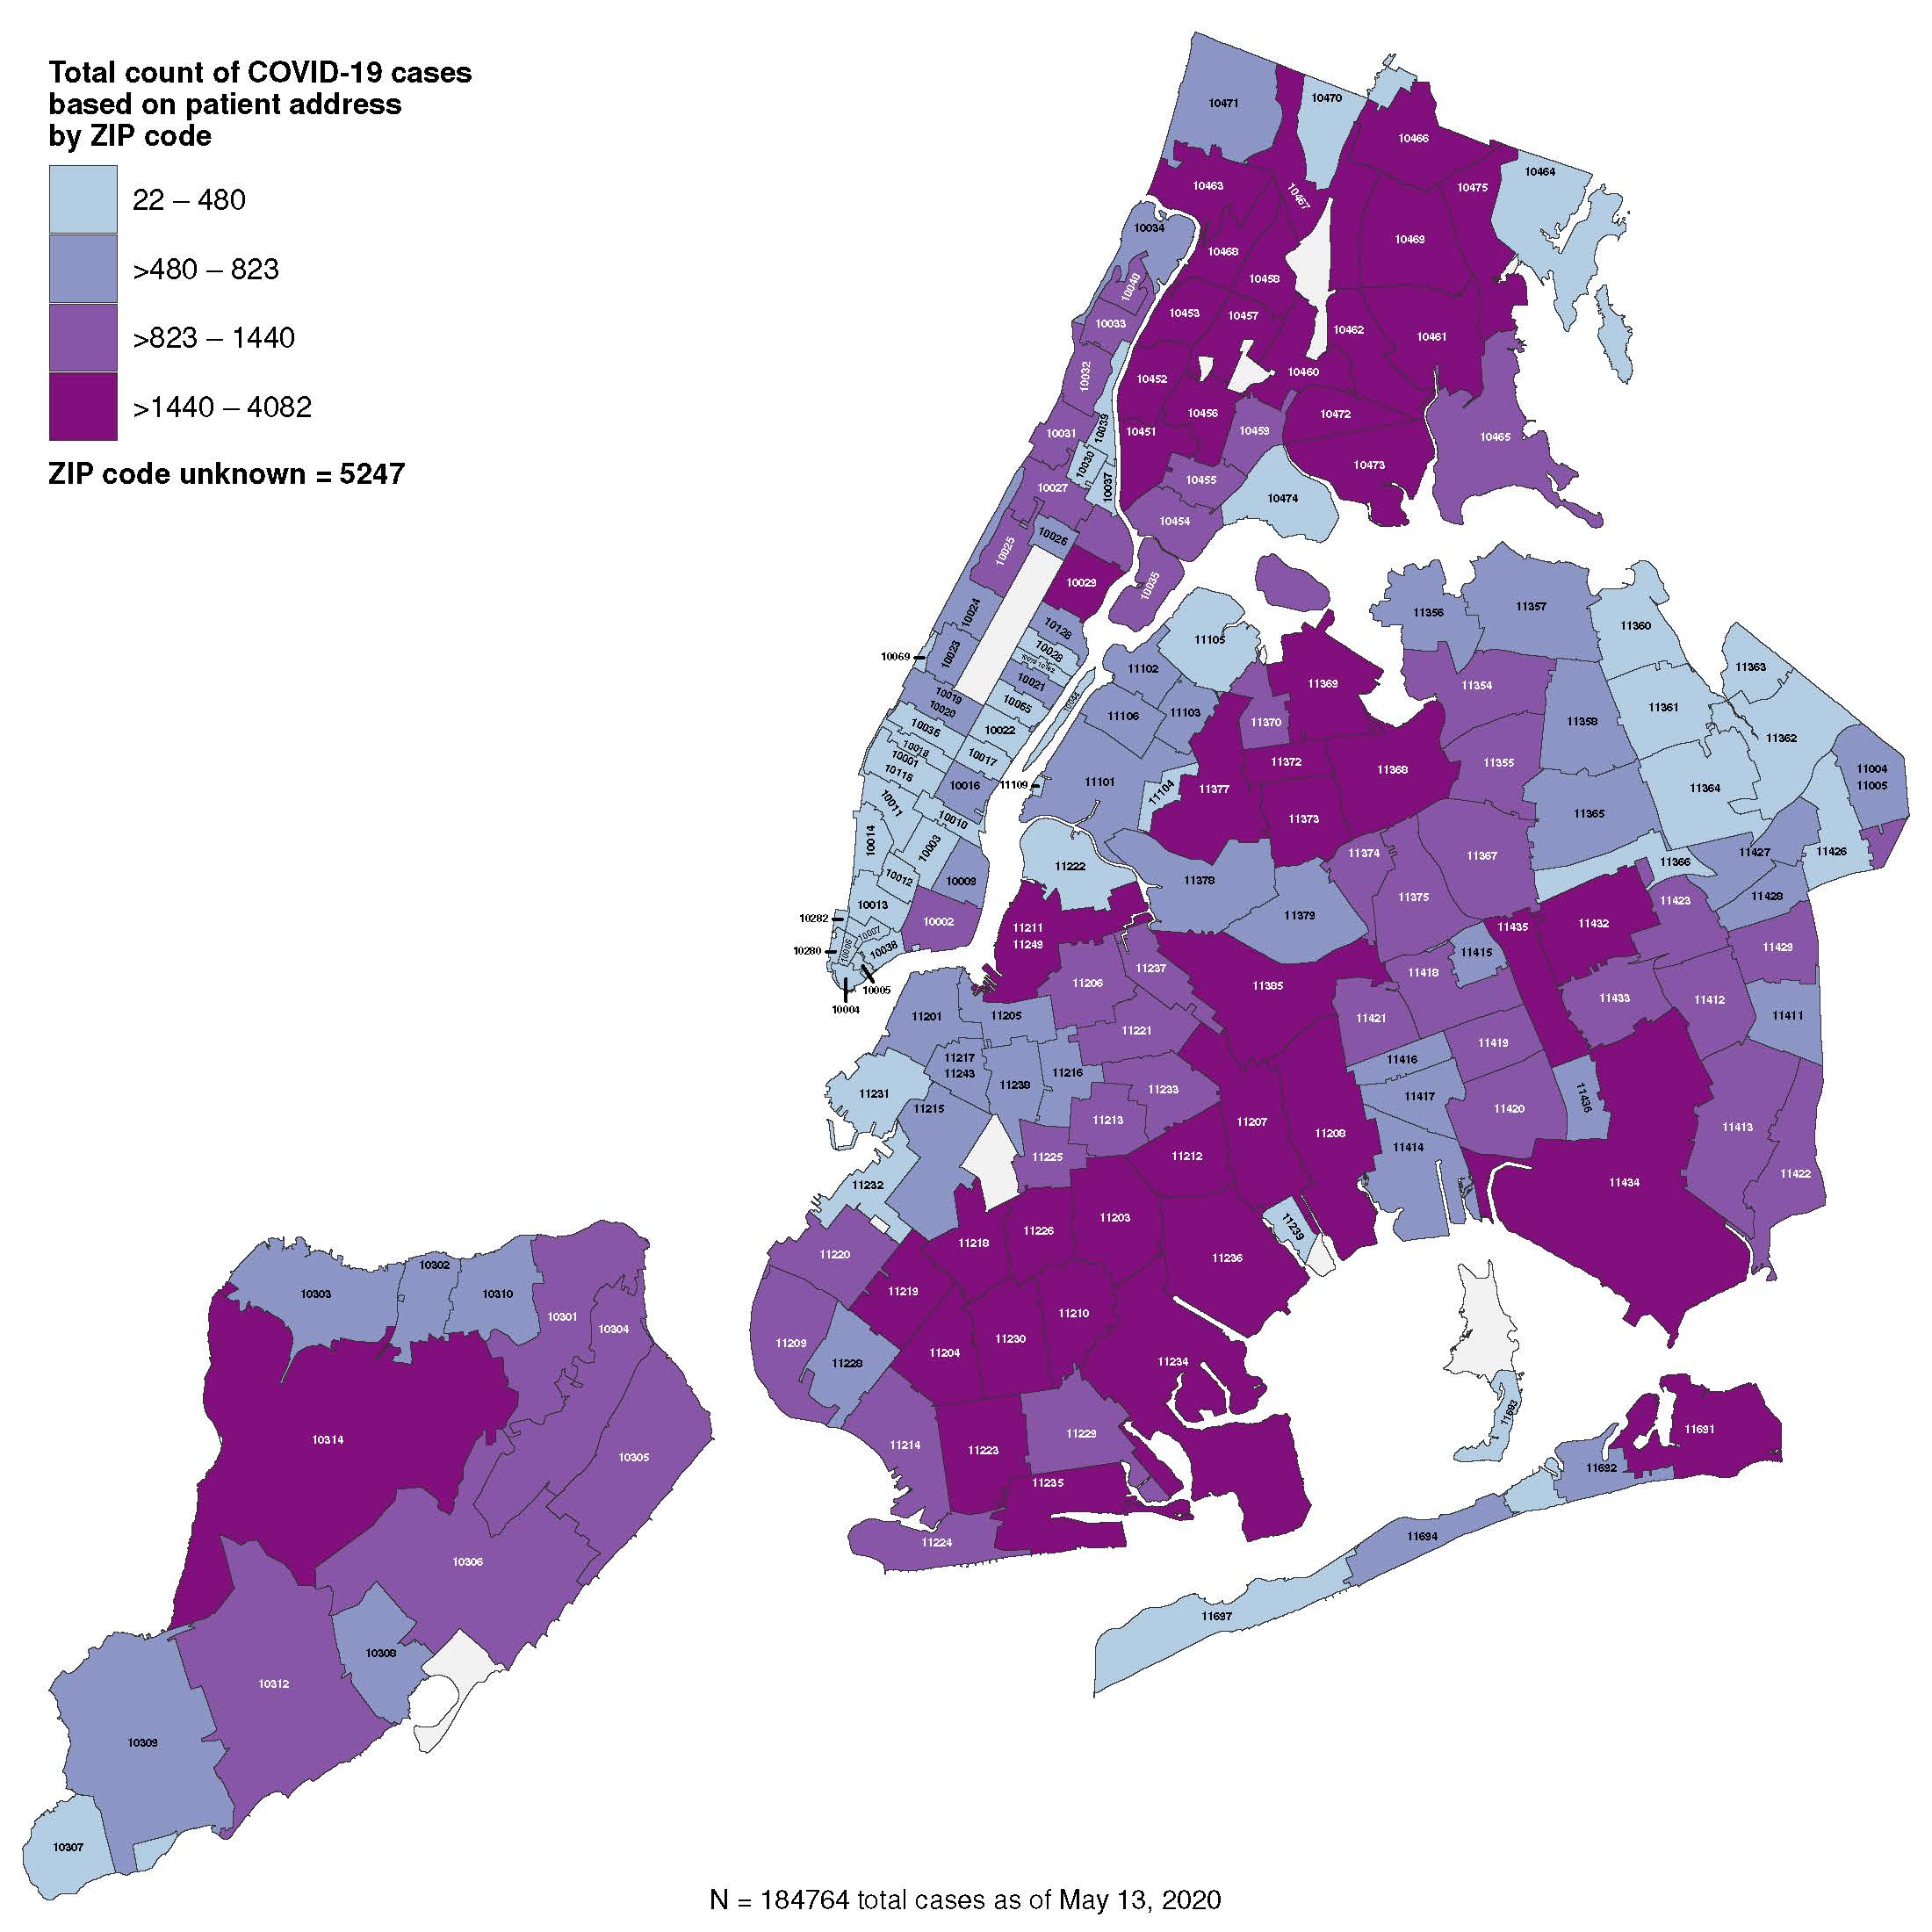
The Overstated COVID-19 Blame on Urban Density in Favor of Suburban Living

May 20, 2020 | 1:06 pm | Explainer |


[NYC.gov]

One of the pieces of conventional wisdom we have picked up during the COVID-19 crisis is that high-density residential living will be less favored. The city to suburban migration pattern is already beginning in New York City and could last several years. The rising number of suburban single-family rental inquiries from the city has provided the initial evidence of a trend. City residents seem to be looking to test drive the suburbs and commute to their city job when “shelter in place rules begin to ease.”

Unfair Reputation?

New York City has developed a national reputation as a hotbed of Coronavirus infection because of our higher density. We live a lot closer together than a sprawling suburb in Dallas and have a greater dependency on public transportation such as the subway and buses instead of driving cars. I live in Fairfield County, Connecticut, a bedroom suburb of New York City with a county-wide COVID-19 ratio of 1068 deaths per its 943,332 population. Dallas County, Texas, had 153 deaths per its 2.636 million people. My county has a wildly higher death rate than a county that contains an urban core like Dallas.

Is the city to suburban trend sustainable?

New Yorkers buy into the urban to the suburban narrative, so I believe the push to the outlying NYC metro suburbs could be quite significant in the near term. While the outbound migration began a few years ago, it is not clear whether the trend can continue for more than a few years. The pattern could ultimately be different from what is currently expected including:

  • A boost for second-home markets: There might be an influx of demand to areas the Hudson Valley, Northern Connecticut The Hamptons, and the North Fork, to name a few. Consumers made begin to view a second home as an equal asset to the primary home to have similar quality options. This potential trend would be contrarian to other significant economic downturns as second-homes are not considered “second-priority.”

  • And because the implications of the SALT tax will remain in place on the other side of the COVID-19 crisis, Florida and Texas can make a compelling pitch to New York City couples with small children cooped up in 1,000 square foot 2-bedroom apartments right now. They are realizing they aren’t as tethered to their work location as they once thought – and schooling via Zoom is not all it’s cracked up to be.

I think that the high-density lifestyle of New York City is what makes living there so great. I’ve lived in or around New York City since the mid-80s. Before we moved to the city, my dad used to proclaim:

Where else can you buy strawberries at 3 am in the morning?!?!?

Placing strawberries aside, I remain skeptical that the urban to suburban outbound migration can be sustained long term. We saw the same outbound pattern after 9/11 and then an inbound return only a few years later.

Density is not the only reason

Urban density is just one reason for the high COVID-19 infection rate that is driving outbound migration. It is not the reason. Other factors influencing the disparity in the infection rate include neighborhood characteristics such as wealth, commute time, and the concentration of multi-generational households.

The map above confirms the argument that it’s not all about density – the highest infection rates are in the “suburban-like” areas of the city including Staten Island and the outer reaches of Brooklyn and Queens. Manhattan, home for many of the tall commercial and residential towers the city is famous for, has the lowest infection rate.

These Manhattan results might help maintain the enthusiasm for that occasional 3 am strawberry run to the corner market.

Tags: , , , , ,


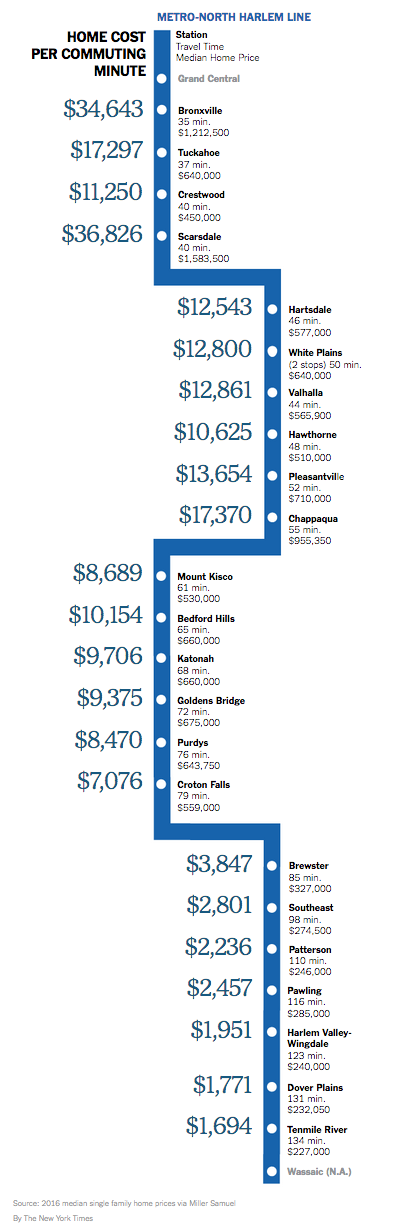
Westchester to Manhattan Commute Time by Housing Cost

April 7, 2017 | 10:34 am | | Infographics |

Because I’m a little behind, the awesome infographic below by Michael Kolomatsky appeared in the New York Times real estate section a few weeks ago: How Much Is Your House Worth Per Minute?.

My original version covering Fairfield County was so popular they wanted me to do recurring versions. This one was much harder since there wasn’t an obvious “sweet spot” but the concept was the same. And best of all, it’s pretty darn cool.

Tags: , ,


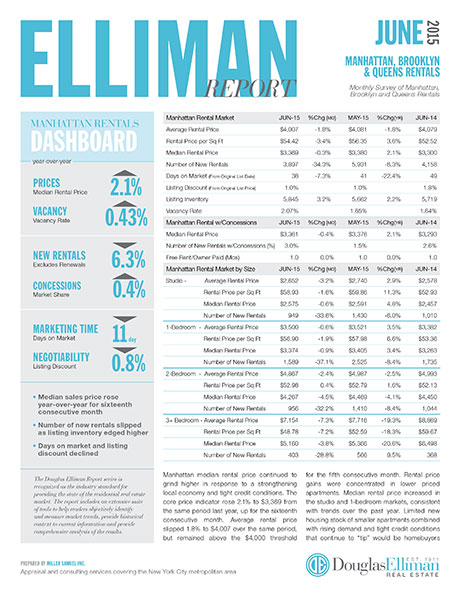
Brooklyn, Queens Set Records, NYC rents jump, Westchester, Putnam and Dutchess Get Busy

October 8, 2015 | 9:05 pm | | Reports |

wsjbrooklyn3q15-600

We published a slew of research today for Douglas Elliman Real Estate:

Manhattan, Brooklyn & Queens Rentals

Manhattan Rentals – Median rental price increased year-over-year for the 18th consecutive month – Median rental price was third highest on record – Brisk employment growth and strong economic conditions kept upward pressure on rents – Mortgage lending conditions remained tight tipping would-be first-time buyers back into rental market – Strength at lower end of market remained as non-doorman rents rose faster than doorman rents – Luxury median rental price slipped, showing weakest conditions of all price segments – Inventory slipped and marketing time remained low, despite rise in vacancy rate

Brooklyn Rentals – Median rental price set a new record for third consecutive month – Median rental price exceeded the $3,000 threshold for first time – Landlord concessions remained at nominal level as inventory slipped – Rental price indicators moved higher across all size categories – Listing inventory as well as negotiability between landlords/tenants fell – Median Brooklyn rent was $288 less than Manhattan

Queens Rentals – Price indicators showed mixed results, suggesting general stability overall – Studios showed strong price growth as 1-bedrooms and 2-bedrooms were flat – New development market share comprised 30.2% of new rentals – Luxury market median price gain was modest, but exceeded the overall market – Median Queens rent was $362 less than Brooklyn and $650 less than Manhattan

Brooklyn Sales – Brooklyn median and average sales price set a new record – Brooklyn remains the only New York City borough with a median sales price above the pre-financial crisis high – Condo, co-op and 1-3 family properties set new median sales price record – Luxury housing prices followed overall market trend – Sales expanded as listing inventory declined, resulting in brisk market pace – Fastest marketing time in 8 years

Queens Sales – Queens median and average sales price set a new record – Condo median sales price set a record for second consecutive quarter – Co-op price indicators set new record – 1-3 Family price indicators set new record – Luxury price indicators set new record – Inventory declined as sales surged – Marketing time fell as negotiability expanded

Westchester County Sales (expanded) – Record number of sales for the quarter, based in historical back to 1981 – Fastest marketing time and least negotiability in the 5.5 years this metric has been measured – Listing inventory for all property types slipped from year ago levels – Absorption rate was fastest market pace in 15 years – Single family and condo median sales price indicated stability – Single family market share declined even though sales increased – Luxury price indicators slipped, out performed by overall market

Putnam/Dutchess County Sales (new)

Putnam County – Price trend indicators increased on a year over year basis – Listing inventory slipped as the number of sales surged – Based on absorption, the market pace was 17.2% faster than the year ago quarter – Marketing time and listing discount expanded despite faster market pace

Dutchess County – Price indicators suggested general stability – Single family prices edged higher as condo prices declined – The pace of the market slowed as sales declined and inventory expanded

Tags: , , ,


Record Queens Condo Prices: Bigger Than Crises in Greece, China

July 9, 2015 | 9:51 pm | |

Rental_0615Douglas Elliman published our research today covering Queens sales, Brooklyn sales Westchester/Putnam sales as well as the rental market for Manhattan Brooklyn & Queens. You can download the reports and more at Douglas Elliman’s market report page.

Like last week’s Manhattan report, there were lots of records set and it wasn’t simply the influence of high end sales – prices were up across the board in most markets.

Incidentally, the Bloomberg News article that covered record Queens condo sales was the second most emailed story world-wide. It stoked more interest than the finance crisis in Greece and the recent Chinese stock market gyrations. Apparently only “investors with satellites” was a more popular read.

Idea (?) for next quarter: Talk about drones and investors in the Queens housing market.

2q15queensrptBLOOMBERGTERMINALS

Tags: , ,


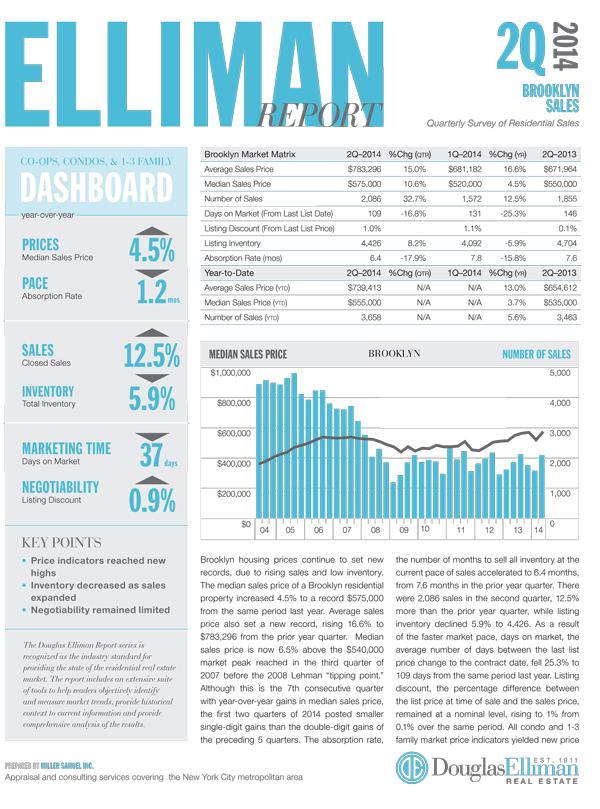
2Q14 Brings Mixed Regional Messages – Brooklyn, Queens and Westchester/Putnam Reports

July 14, 2014 | 8:53 am | | Reports |

If you’ve been:

A. Pouring over state maps of pet ownership
B. Watching the World Cup
C. Watching the Tour de France
D. Fretting about the Russell Stover purchase

Then you may have missed last week’s market report releases for Brooklyn, Queens and Westchester/Putnam Reports. These are part of the report series I’ve been writing for Douglas Elliman since 1994 (20 years!). The reports have a new look – hope you like them.

Click on graphics to open them.

Brooklyn_2Q_2014

BROOKLYN SALES MARKET Brooklyn housing prices continue to set new records, due to rising sales and low inventory. The median sales price of a Brooklyn residential property increased 4.5% to a record $575,000 from the same period last year. Average sales price also set a new record, rising 16.6% to $783,296 from the prior year quarter. Median sales price is now 6.5% above the $540,000 market peak reached in the third quarter of 2007 before the 2008 Lehman “tipping point.” Although this is the 7th consecutive quarter with year-over-year gains in median sales price, the first two quarters of 2014 posted smaller single-digit gains than the double-digit gains of the preceding 5 quarters…

Queens_2Q_2014

QUEENS SALES MARKET The Queens housing market took a breather after 6 consecutive quarters of rising sales. There were 2,404 sales in the second quarter, 3.6% less than the same period last year. Year to date, the number of sales remained 14.2% higher than the same period last year due to the sharp rise in first quarter sales activity. Despite the decline, listing inventory continued to fall for the 13th consecutive quarter. There were 5,892 listings at the end of the second quarter, 5.3% less than the same period last year. As a result of the combination of declining sales and falling inventory, the pace of the market remained stable…

Westchester_2Q_2014

WESTCHESTER/PUTNAM SALES MARKET Westchester single family contract activity was higher than prior year levels as severe winter weather conditions pushed first quarter pending sales into the second quarter. Despite the 16.7% decline in closed home sales, total contracts expanded 3.9% from the prior year quarter and jumped 51.9% from the prior quarter. The rise in contracts from first to second quarter was higher than the 35.5% average increase of the prior 2 years. Listing inventory expanded 7.9% to 3,905 rising from the low water mark set in 2013…


Miller Samuel Aggregate Database [Miller Samuel]
Market Chart Gallery [Miller Samuel]


Ready, Set, Download: 1Q 2014 Market Reports for Brooklyn, Queens and Westchester/Putnam Sales

April 12, 2014 | 1:49 pm | |

We released 3 reports for Douglas Elliman on the sales markets for Brooklyn, Queens and Westchester/Putnam this week. Click on the reports to download!

Brooklyn_1Q_2014 BROOKLYN The Brooklyn housing market was characterized by more modest price growth and chronic lack of inventory, holding back sales growth. Median sales price expanded 1% to $520,000 from the same period last year and the highest first quarter result in 6 years. Average sales price grew 7.3% to $681,182 over the same period. Co-ops posted the largest year-over-year gain in median sales price, rising 12.2% to $340,000 but lost 2.1% of the market share. Condos remained essentially unchanged over the year with a $625,000 median sales price and market share edged 1.6% higher. The 1-3 family median sales price increased 5.1% to $588,733 and market share increased a nominal 0.5%…

Queens_1Q_2014 QUEENS The first quarter Queens housing market was a period of rising prices after an extended period of stability, declining inventory, and rising sales. The bottom of the multi-year decline of listing inventory may have been reached in the fourth quarter of 2013. Although the first quarter listing inventory increased 7% from the prior quarter bottom to 5,617, it was the second lowest level recorded in this report series since 2005 and 13.5% below prior year levels. The number of sales jumped 32.8% to 3,156 from the prior year quarter, the highest first quarter total in 6 years. The combination of declining inventory and rising sales led to a faster market pace. The absorption rate, the number of months to sell all listing inventory at the current pace of sales, fell to 5.3 months, less than half the 11.2 month average over the past 5 years…

Westchester_1Q_2014 WESTCHESTER The Westchester housing market saw the most first quarter sales in 7 years, the highest median sales price in 6 years and initial signs that the trend of declining inventory may be ending. There were 1,525 sales in the first quarter, up 13.1% from the prior year quarter and the most first quarter sales since the same period 7 years ago. Listing inventory fell 3.7% to 5,378 from the same period last year and for the 8th consecutive quarter. With the rise in the number of sales and the decline in listing inventory, the pace of the market was faster. The monthly absorption rate, defined as the number of months to sell all inventory at the current pace of sales, fell by 1.8 months to 10.6 months from the prior year quarter…
PUTNAM After bottoming out two years ago, housing prices have generally trended higher as the number of sales expanded and inventory contracted. All price indicators posted gains from prior year levels. Median sales price increased 12.7% to $302,500 while average sales price rose 15.9% to $379,217 over the same period…

Tags:


[Inventory, Contracts] 1Q 2013 Westchester & Putnam Report

April 11, 2013 | 11:27 am | | Reports |

We just published our report on the Westchester & Putnam County New York housing markets.   This is part of an evolving market report series I’ve been writing for Douglas Elliman since 1994.

Key Points

WESTCHESTER

  • Listing inventory fell to lowest first quarter total in four years.
  • Current supply is just below the 10-year average.
  • While sales are up, contract volume surged above year ago levels.
  • Overall price indicators were mixed indicating stability.

PUTNAM

  • Listing inventory declined as sales edged higher
  • Housing prices edged higher.

Here’s an excerpt from the report:

…The first quarter of 2013 was defined by falling listing inventory and a significant rise in contract activity. Despite the faster pace of the market, price indicators showed stability compared to the same period last year. However, the overall market is expected to see more upward price pressure if the pace of falling supply and rising sales activity continues. The number of closed sales in the first quarter of 2013 showed only a modest gain of 5.6% to 1,348 compared to the same period last year. However, the total number of contracts surged 27% over the same period representing a significant acceleration in the pace of the market since the end of 2012. Listing inventory continued to fall sharply, down 17.5% to 5,587 from the first quarter of 2012, the lowest first quarter total in four years…

You can build your own custom data tables on the Westchester & Putnam market – now updated with 1Q 13 data. I’ll be posting the updated charts soon.


The Elliman Report: 1Q 2013 Westchester & Putnam Sales [Miller Samuel]
The Elliman Report: 1Q 2013 Westchester & Putnam Sales [Douglas Elliman]


[Stronger Finish] 4Q 2012 Westchester & Putnam Report

January 12, 2013 | 9:57 pm | | Reports |

We just published our rreport on the Westchester & Putnam County New York housing markets.   This is part of an evolving market report series I’ve been writing for Douglas Elliman since 1994.

Key Points

WESTCHESTER

  • Housing prices remain stable.
  • Sales up sharply as many anticipated higher taxes relating to the Fiscal Cliff in 2013.
  • Listing inventory continued to fall. Higher sales and tight credit ARE keeping inventory low.
  • Days on market edged higher as older inventory continued to be absorbed.
  • Luxury prices continued to outpace the overall market.

PUTNAM

  • Housing price indicators were mixed.
  • Sales slipped from the same period last year.
  • Listing inventory continued to trend lower.
  • Days on market edged higher as older inventory continued to be absorbed.

Here’s an excerpt from the report:

…The fourth quarter 2012 Westchester housing market was characterized by general price stability, sharply rising sales activity, declining inventory and a faster overall market pace heading into 2013.

Median sales price saw a nominal 0.6% decline from prior year levels to $395,000. Average sales price increased 11.5% and average price per square foot rose 5.2% over the same period. The year-to-date results show nominal declines for all price indicators, including a 1.6% decline in median sales price. In the fourth quarter, the luxury market price indicators outpaced the overall market. Median sales price increased 21.6% from the prior year quarter to $2,150,000…

You can build your own custom data tables on the Westchester & Putnam market – now updated with 4Q 12 data. I‘ve added some charts for Westchester (Putnam coming) and will be adding to them in the future.


The Elliman Report: 4Q 2012 Westchester & Putnam Sales [Miller Samuel]
The Elliman Report: 4Q 2012 Westchester & Putnam Sales [Douglas Elliman]

Get Weekly Insights and Research

Receive Jonathan Miller's 'Housing Notes' and get regular market insights, the market report series for Douglas Elliman Real Estate as well as interviews, columns, blog posts and other content.

Follow Jonathan on Twitter

#Housing analyst, #realestate, #appraiser, podcaster/blogger, non-economist, Miller Samuel CEO, family man, maker of snow and lobster fisherman (order varies)
NYC CT Hamptons DC Miami LA Aspen
millersamuel.com/housing-notes
Joined October 2007