Matrix Blog

Wall Street Journal

NYT v. WSJ Smogdown: Status of Chinese Investment in U.S. Real Estate

December 1, 2015 | 11:39 am | | Favorites |

lianyungangchinaSmogYahoo
[Source: Yahoo News]

Last weekend I read two terrific articles on Chinese real estate investment in the U.S. but they seemed seemed to conflict – check out the headlines:

New York Times Chinese Cash Floods U.S. Real Estate Market

Wall Street Journal Chinese Pull Back From U.S. Property Investments The subtitle says it all – The nation’s economic and stock-market slump puts buyers on the sidelines

Are the Chinese flooding the U.S. market now or are they pulling back? Which is it? Or is it both?

In my recent trip to Shanghai, I spoke to and interviewed many, many real estate investors at The Real Deal Forum. I got the impression that investment has pulled back a bit in 2015 but expectations were high that investment would expand again, although not to the level of the past 5 years. Of course I was doing this in a biased environment – at in investor conference. I was consistently told that government efforts to prop up the stock market spooked much of the smart money out of the market since the actions were taken to calm everyday investors.

The New York Times piece seemed prompted by a P.R. pitch from the Chinese developer for their Dallas suburb project enticed with a suburban angle. It was a refreshing angle since Chinese real estate investment in the U.S. has been an urban narrative and specifically focused on the high end. The article illustrated just how massive the investment patterns have been. To date the narrative has been focused on super luxury condos in expensive metropolitan areas, while the suburbs got limited attention.

NAR2015internationalCHINESEnyt

The WSJ article is more orientated towards the past few weeks while the NYT article is a longer term view. Both publications place emphasis on NAR’s Profile of International Home Buying Activity whose results emphasized the Chinese investment surge of the previous year. The survey results only reflect the market through last March, so it is 9 months behind the current market. The Chinese investment numbers are staggering, and they are probably understated. Since the NAR report is simply a survey of it’s members and NAR has limited exposure to New York City, especially Manhattan – a hotbed of Chinese real estate investment activity.

NAR2015internationalCHINESEwsj

Incidentally, do the above 2 charts look similar? They both relied on the NAR report.

The NYT piece set the table on the entire multi-year phenomenon using a ton of cool charts while the WSJ attempted to illustrate the change in recent weeks Both outlets were forced to rely on a lot of anecdotal to make their case. Both articles are consistent with my views as each provided a different context.

The NYT piece provided the long term historical view and the WSJ was a short term snapshot.

Tags: , , , , , , ,


Brooklyn, Queens Set Records, NYC rents jump, Westchester, Putnam and Dutchess Get Busy

October 8, 2015 | 9:05 pm | | Reports |

wsjbrooklyn3q15-600

We published a slew of research today for Douglas Elliman Real Estate:

Manhattan, Brooklyn & Queens Rentals

Manhattan Rentals – Median rental price increased year-over-year for the 18th consecutive month – Median rental price was third highest on record – Brisk employment growth and strong economic conditions kept upward pressure on rents – Mortgage lending conditions remained tight tipping would-be first-time buyers back into rental market – Strength at lower end of market remained as non-doorman rents rose faster than doorman rents – Luxury median rental price slipped, showing weakest conditions of all price segments – Inventory slipped and marketing time remained low, despite rise in vacancy rate

Brooklyn Rentals – Median rental price set a new record for third consecutive month – Median rental price exceeded the $3,000 threshold for first time – Landlord concessions remained at nominal level as inventory slipped – Rental price indicators moved higher across all size categories – Listing inventory as well as negotiability between landlords/tenants fell – Median Brooklyn rent was $288 less than Manhattan

Queens Rentals – Price indicators showed mixed results, suggesting general stability overall – Studios showed strong price growth as 1-bedrooms and 2-bedrooms were flat – New development market share comprised 30.2% of new rentals – Luxury market median price gain was modest, but exceeded the overall market – Median Queens rent was $362 less than Brooklyn and $650 less than Manhattan

Brooklyn Sales – Brooklyn median and average sales price set a new record – Brooklyn remains the only New York City borough with a median sales price above the pre-financial crisis high – Condo, co-op and 1-3 family properties set new median sales price record – Luxury housing prices followed overall market trend – Sales expanded as listing inventory declined, resulting in brisk market pace – Fastest marketing time in 8 years

Queens Sales – Queens median and average sales price set a new record – Condo median sales price set a record for second consecutive quarter – Co-op price indicators set new record – 1-3 Family price indicators set new record – Luxury price indicators set new record – Inventory declined as sales surged – Marketing time fell as negotiability expanded

Westchester County Sales (expanded) – Record number of sales for the quarter, based in historical back to 1981 – Fastest marketing time and least negotiability in the 5.5 years this metric has been measured – Listing inventory for all property types slipped from year ago levels – Absorption rate was fastest market pace in 15 years – Single family and condo median sales price indicated stability – Single family market share declined even though sales increased – Luxury price indicators slipped, out performed by overall market

Putnam/Dutchess County Sales (new)

Putnam County – Price trend indicators increased on a year over year basis – Listing inventory slipped as the number of sales surged – Based on absorption, the market pace was 17.2% faster than the year ago quarter – Marketing time and listing discount expanded despite faster market pace

Dutchess County – Price indicators suggested general stability – Single family prices edged higher as condo prices declined – The pace of the market slowed as sales declined and inventory expanded

Tags: , , ,


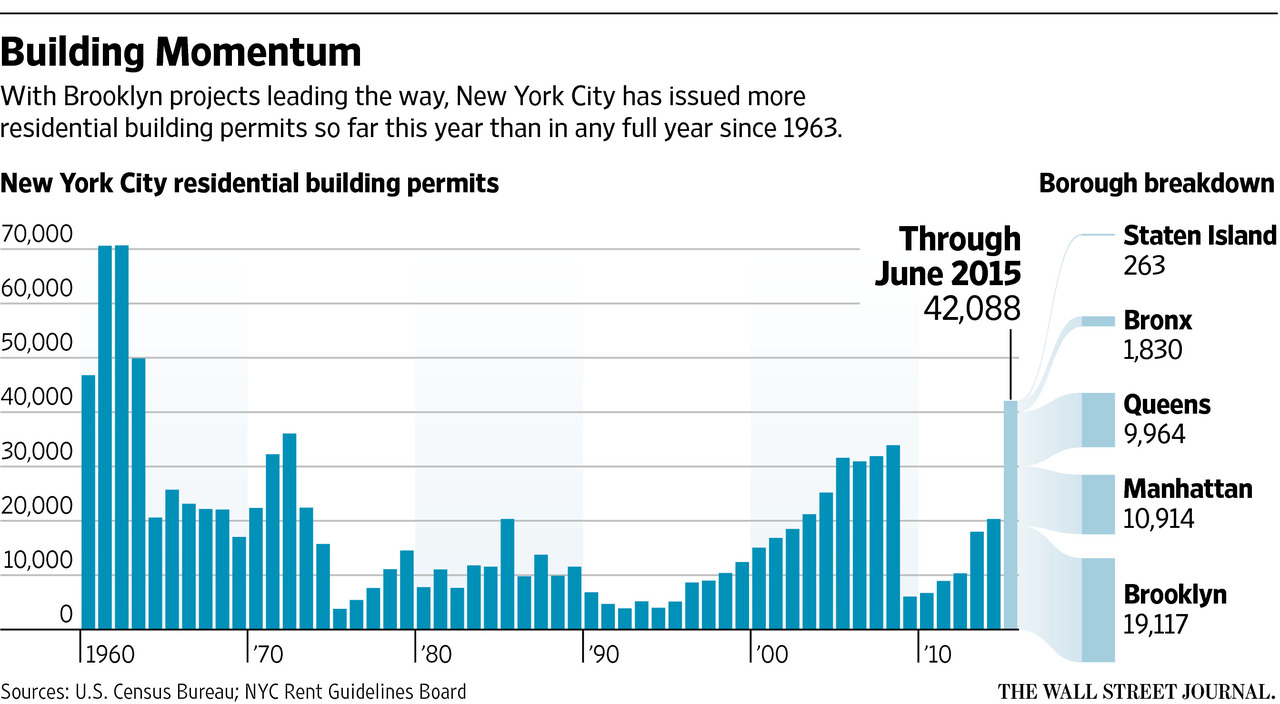
Most NYC building permits since ’63 – Brooklyn nearly equals rest of city

July 30, 2015 | 10:20 am | |

WSJnycpermits7-30
Source: WSJ

Yesterday evening Josh Barbanel at WSJ posted a milestone piece on the current building boom: Construction in New York City Goes Through The Roof: New residential permits surge as developers rush to qualify for tax break

There has been an incredible surge in NYC residential building permits, the most in more than 50 years. It’s amazing to see the Brooklyn permit total nearly reach the total of remainder of the city tallied together.

New York City is entering what could be the biggest building boom in a generation, census figures show, as work gets under way on hundreds of residential projects in neighborhoods across the city. In the first six months of the year, developers received new residential building permits for 42,088 apartments and houses in the city, according to the U.S. Census Bureau, already more than in any full year since 1963, when nearly 50,000 permits were issued.

While permit numbers don’t translate directly to what will actually get built, it is clearly a sign of a significant pipeline in the making.

Reasons?

  • Expiring tax abatement program encouraged developers rush in and start foundation work by June 15
  • Alternative financing around the globe chasing higher returns that low rates can’t deliver
  • Little regulatory oversight because of Dodd-Frank bogging down traditional commercial lenders
  • Significant pent-up demand from 2008-2012 unleashed on the market
  • Improving economy with near record employment growth

UPDATE – I neglected to be more clear and say that this surge will likely collapse in the near future, since the jump in permits is likely to be wildly exaggerated as a result of the first reason above.

Tags: , , , ,


[Video] Why The Rich Get Richer

May 4, 2015 | 11:05 am | |

Here’s one way to look at it.

Tags: , , ,


Cluttering Luxury Housing Markets with Listings Made for TV – Manhattan Edition

June 28, 2014 | 4:55 pm | |

wsjbpcphlistingterrace
[Source: WSJ]

A little over a week ago the WSJ’s Candace Taylor broke the story about 3 contiguous listings to be marketed together at the top of a 15-year old ground lease condo in Battery Park City for $118,500,000.  At 15,434 square feet, that works out to $7,678 per square foot.  CNBC’s Robert Frank provides more details in a video tour that was broadcast shortly after the story broke.

Normally I don’t bother to do the math on this sort of thing but after the Cityspire listing a while back, I thought I’d tweak my thinking a bit as the luxury market gets more than its fair share of confusing “milestones.”

Doing the Math
Here’s my listing price logic using content in the near viral news coverage of the record Battery Park City listing – I break down the 3 units:

$56,500,000 ($7,406/sqft) listing – 7,628 sqft 5-bed listed last year for 5 days and removed.

$11,700,000 ($3,330/sqft) purchase – 3,513 3-bed in April 2014.

$19,000,000 ($4,425/sqft) listing – 4,293 sqft 4-bed $23M January listing dropped to $19M, then removed.

$87,200,000 is the aggregate total for the 3 units that total 15,434 square feet ($5,640/sqft). The current list price of $118,500,000 represents a $31,300,000 premium for the combination of all 3 units before we might assume the millions in renovations to combine if you believe that the $87,200,000 total is what aggregate of the individual properties are worth.

Given the $3,330 ppsf recent sales price of the 3-bed and the unable to be sold for $4,293 ppsf after 6 months on market 4-bed and the not-market tested 5 day listing period 5-bed at $7,406, I can’t figure out how the listing agent gets to $7,678 ppsf as an asking price for all 3 together before the cost of renovation to combine? Perhaps the seller set the price.

The listing broker tells us that the pricing “is justified by the square footage“, as well as the views and building’s amenities.”

Got it.

Tags: , , , , , ,


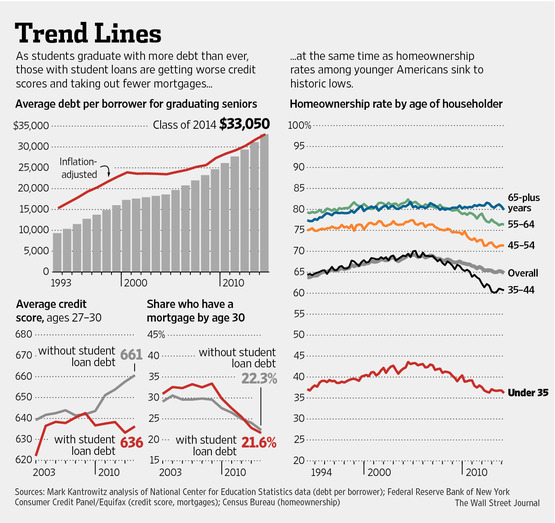
Terrific Chart on Homeownership by Age

June 23, 2014 | 11:03 am | |

wsjstudentdebttrend
[Source: WSJ]

I really like the way this chart illustrates the 20 year decline in the homeownership rate. A few thoughts on what it shows:

Under 35 – Lowest in 20 years – record student debt and tepid economy plays a significant role in falling rate.

35-44 – most volatile, has overcorrected – large gain during credit boom and fell well below 1994 levels.

45-54 – fell below 1994 levels but didn’t rise as much during credit housing boom.

55-60 – higher than 45-54 group but followed a similar arc – fell below 1994 levels but didn’t rise as much during credit housing boom.

65 and above – only category to finish higher than 1994 levels – not heavily influenced by credit bubble.

Overall – is currently higher than 1994 levels. Coming down from artificial credit bubble high – probably won’t stop declining until credit begins to normalize.

Tags: ,


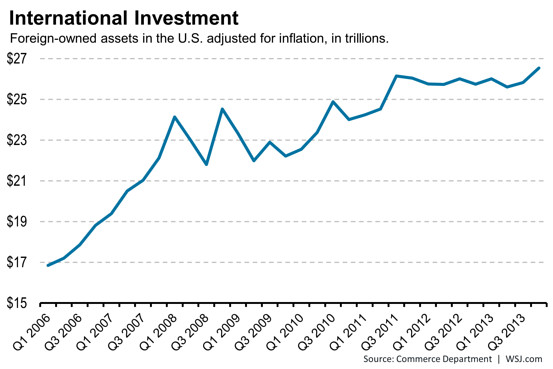
New Record of Foreign-owned Assets in the United States

March 27, 2014 | 4:06 pm | |

3-14commerceForeignInvestors

According to the WSJ Real Time Economics Blog there are the record investment gains. This is good news/bad news…and:

has worried some economists, because it makes the U.S. more vulnerable to major shifts in the global economy. But it also could show strengthening confidence in the American economy.

These gains are largely due to the rising US stock prices rather than more investment. However in the housing sector, I do think rising property values are attracting even more new capital for investment – whether for new development or unit purchases. We can see this in markets like New York City and Miami. Foreign investors seem to be chasing safety and a long term equity play.

Tags: , , ,


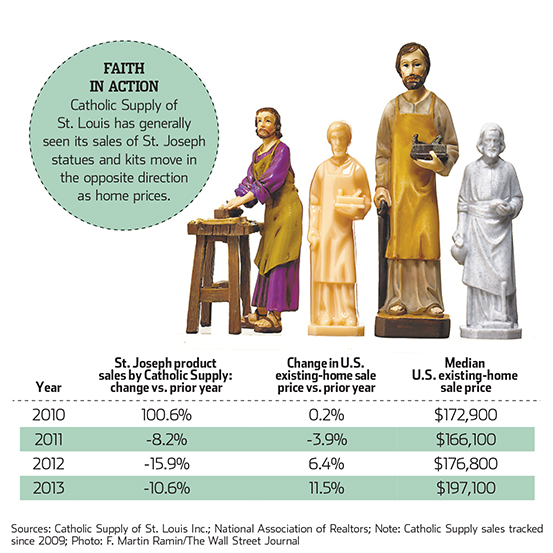
It’s St. Joseph’s Day – What Does It Tell Us About Housing Trends?

March 19, 2014 | 11:16 am | |

wsj3-14stjoseph
[Source: WSJ]

Last week I can across Sanette Tanaka’s WSJ column “Spreadsheet” titled “Bless Our Happy Home Sale” that talked about the tradition regarding St. Joseph. I waited to blog about it until today since March 19th is actually St. Joseph’s Day (BTW: who is getting any work done this week with 3/17 St Patrick’s, 3/18 March Madness brackets and now this?).

I love the phrase within the WSJ graphic: “Faith in Action.”

I previously wrote about this here in September 2005 and in October 2007.

Traditionally, Joseph, the husband of Mary, is hailed as the patron saint of home and family. Some believe that burying a statue of St. Joseph in the yard helps sell a house.

Here’s how it the process works when selling your home:

  1. Bury the St. Joseph statue upside-down in your yard, facing toward the house listed for sale.

  2. Sell the house.

  3. The Seller digs up the statue and puts it in the new home in a special place.

The last 4 years of statue sales show a pattern consistent with NAR’s existing home sale pattern with the housing market rebound beginning in 2011.

Who says housing trend analysis is devoid of emotion. Got it?

Tags: , ,


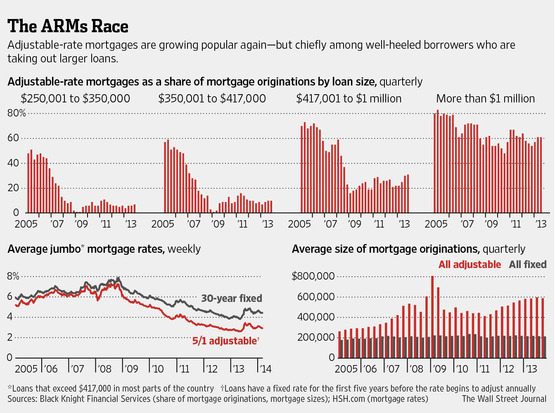
With Plunge in Loan Volume, Lenders Push ARMs to Jumbo Borrowers

March 17, 2014 | 12:00 pm | |

wsjthearmsrace3-16-14
[Source: WSJ, click to expand]

There’s a good article in yesterday’s WSJ “Adjustable-Rate Mortgages Make a Comeback” focusing on the rise in their use. In fact the title on the window bar is the web page is “ARM Loans-A Vestige of the Housing Bubble-Are Making a Comeback.

With mortgage volume down sharply since mortgage rates creeped higher last year, lenders are focusing on jumbo mortgages, especially ARMs that can expand affordability. There’s also a good audio clip embedded in the piece.

Lenders are pricing ARMs roughly 1.5% below a fixed rate, the largest spread in a decade.

ARMs comprised 31% of mortgages in the $417,001-to-$1 million range that were originated during the fourth quarter of 2013, according to data prepared for The Wall Street Journal by Black Knight Financial Services, formerly Lender Processing Services, a mortgage-data and services company. That is up from 22% a year earlier and the largest proportion since the third quarter of 2008.

I find it interesting that many suggest that ARM products – including within this article – were one of the causes of the housing bubble. I disagree. I saw them merely as a tool to be misused, just like a hammer or a chainsaw.

At least for now, with credit remaining very tight, it is unlikely that they would be abused in the same way they were during the prior housing boom. However with the 70% plunge in lucrative refi volume, one has to wonder when business decisions will start to overwhelm risk paranoia.

Tags: , , , ,


The Bi-Partisan Fannie and Freddie Solution That Isn’t A Fix

March 16, 2014 | 11:35 am | |

fanniefreddieredone
[Source: WSJ, click to expand]

Roughly 90% of the residential market has passed through Fannie and Freddie since the onset of the financial crisis. Reliance on these institutions was only around 50% before the crisis – and are they making a lot of money for the federal government right now. I’ll leave out the part where FHA stepped in to pick up the high risk slack. The private secondary mortgage market was obliterated by the credit crunch/housing crash and in the half decade that has passed, investors are just now dipping their toes in the water.

There is a great summary piece by Nick Timiraos at WSJ: “What Can Take the Place of Fannie and Freddie” on the proposed Fannie and Freddie “overhaul.”

Big Dumb Banks
As my friend Barry Ritholtz over at Big Picture once told me that the former GSEs are merely “Big Dumb Banks.” In other words, they do as they were told.

Swapping them with another alphabet soup named agency doesn’t solve the problem. In fact, I contend that replacing Fannie and Freddie completely would likely create more problems since little if anything has been done to reduce the systemic risks that nearly brought down the financial system – and whose impact are still being felt by most Americans today.

If we can agree that Fannie and Freddie created a stable mortgage market environment for decades (Fannie since the Depression and Freddie since the 1960s) and then blew up in the recent decade or more (problems began back in late 1990s), there are clearly other issues in play. I’ve always seen Fannie and Freddie as the symptom not the cause of our current economic problems.

Fixing the symptom may make some feel better, but it does nothing to reduce the probability of a systemic credit collapse. The bailout of the GSEs was a result of policy from Washington – the congress, the executive branch and both political parties who in various ways encouraged proactive neutering of regulatory powers, allowed the revolving doors of regulators with Wall Street, allowing Wall Street to compete directly with commercial banks with mind boggling leverage, limited separation of competing interests (ie rating agencies and investment banks) and incentivizing a shifting culture to serve the shareholders over the taxpayers.

I suspect that last point is the impetus for this bi-partisan proposal – reduce the risk exposure to the taxpayer by getting the private market to take over. Congress clearly has an image problem that it is trying to fix as of late (until mid-terms).

Setting Standards to Follow
One of the under appreciated functions of Fannie Mae and to a lesser degree Freddie Mac, was to serve as the leader to the private mortgage market. When Fannie Mae adopted a standard or policy, the private market (ie jumbo mortgage investors), followed their lead. With Fannie and Freddie floating in limbo with a potential looming overhaul, it’s hard to imagine a robust private market developing anytime soon. This would be a completely new institution that would replace and reinvent the former GSEs, you simply invite anywhere from chaos to uncertainty into the financial system and instability to the housing market, a key economic engine for the economy.

The whole plumbing of the mortgage market runs through these companies. You can’t just take these things away without having a very clear and specific view about what’s going to replace them,” said Daniel Mudd, Fannie’s former chief executive, in an interview last year.

No real alternative to the system has been proposed that I’m aware of and this is really window dressing to show bi-partisanship in Washington. There is no time frame proposed and very little details to reinvent the secondary mortgage market have been brought forward.

Here’s a great podcast from WNYC called “Money Talking” featuring Heidi Moore and Joe Nocera covering the proposal.

Key Issues to Fix
The WSJ piece summarizes the key issues that need to be address quite succinctly:

  • Make the “implied” guarantee explicit and require any successors to Fannie and Freddie to pay a fee for that guarantee.
  • Get rid of those investment portfolios, or shrink them to the point where they don’t create systemic risks.
  • Require more capital and tighter regulation, since too little of both is what got Fannie and Freddie into trouble.

The trouble is, the solution to over-reliance on Fannie and Freddie is too complex for Congress to solve in this era of gridlock. Record revenue being generated by the former GSEs make long term solutions unobtainable for now. I don’t see how any major changes can be inserted into the financial systems for a long time.

Tags: , , , , , ,


[WSJ] Good Overview on 2014 US Housing Expectations – Jed Kolko, Trulia

February 26, 2014 | 12:32 pm | |

Jed Kolko does a nice job summarizing what the general housing market may look like in 2014 after the new home sales report came out today.

My big takeaway was that any housing market improvement will be more affected by local job and income growth rather than the “rebound effect.” This phenomena occurred in markets that were hit hardest by the downturn, yet saw the largest price increases.

I’ve added “rebound effect” to my 2014 phrase list, right after “polar vortex.”

Tags: , , , , , , ,


Group Claims Glass Curtain Walls “A Major Step Backward Environmentally”

February 4, 2014 | 4:42 pm | | Radio |

wsjglasshouse2-3-14

The Wall Street Journal released an intriguing article about the use of glass curtain walls on new buildings: Study: Glass Condos Could Pose Health Threat Through Overheating: Hot Summer Could Raise Temperatures Into Triple Digits.

The piece was inspired by content provided by the Urban Green Council, who are trying to push for more rigorous building standards in the aftermath of Superstorm Sandy. They’ve had a PR bonanza for this one since the story was even picked up by Gawker.

But the findings were disputed by some developers and architects, who said that glass buildings in recent years have made big advances in overall energy efficiency. That includes improved glass with special coatings to reflect heat and more insulated surfaces in building walls, to comply with increasingly rigorous city and state energy codes.

The idea of glass curtain walls became a bigger issue in the recent boom and the current boom than in years past: the technology has improved, and with shift in the mix towards luxury development, the need for expansive views and light to raise values made it more popular. The irony of this is, and this is certainly not a definitive statement, that glass curtain walls can be less expensive for luxury development than using more traditional mortar/window installs if it is not load bearing.

And Toronto seems to hate them (when not writing about Mayor Rob Ford) in this CBC piece: Throw-away buildings: The slow-motion failure of Toronto’s glass condos.

UPDATE

Ilya Marritz at WNYC just posted on this topic with the understated title: People Who Live in Glass Houses are Really Hot. Here’s the radio version:

Tags: , , , , , , , ,

Get Weekly Insights and Research

Housing Notes by Jonathan Miller

Receive Jonathan Miller's 'Housing Notes' and get regular market insights, the market report series for Douglas Elliman Real Estate as well as interviews, columns, blog posts and other content.

Follow Jonathan on Twitter

#Housing analyst, #realestate, #appraiser, podcaster/blogger, non-economist, Miller Samuel CEO, family man, maker of snow and lobster fisherman (order varies)
NYC CT Hamptons DC Miami LA Aspen
millersamuel.com/housing-notes
Joined October 2007