Matrix Blog

Wall Street Journal

The Low Appraisal “Hassle” is a Symptom of a Broken Mortgage Process

September 16, 2013 | 3:58 pm | |

Last week we saw a chorus of “appraisers are killing our deals” stories in some major publications:

  • When Appraisal Hassles Tank a Home Sale [WSJ]
  • When Appraisals Come in Low [NYT]
  • Appraisals Scuttle Home Sales Where Prices Rise Fast[IBD]

I’ve long been a critic of my own industry. Like any industry there are terrific appraisers, average appraisers and form-fillers. Post-Lehman there are a LOT more of the latter.

The scenario that prompted these articles and others like them occurs when a sale is properly vetted in the market place and an appraiser enters the transaction and subsequently appraises the property below the sales price. It supposedly is happening in greater frequency now, hence the rise in complaints.

My focus of criticism has largely been centered on appraisal management companies (AMC), who have tried to convert our industry to a commodity like a flood certification or title search rather than a professional service. AMCs serve as a middleman between the bank and an appraiser and they have thrived as a result of financial reform. Most only require an appraiser to be licensed, agree to work for 50 cents on the dollar and turn work around in one fifth the time required for reasonable due diligence. Appraisal quality of bank appraisals has plummeted in this credit crunch era and as a result has prompted growing outrage from all parties in a transaction.

Of course, the market value of the property may not be worth it. But the real estate industry doesn’t trust the appraiser anymore so we point them finger at them automatically.

Yes, it’s a hassle. So let’s decide what the problem really is and fix it.

A long time appraisal colleague and friend of mine once told me before the housing bubble burst:

“Jonathan, you as the appraiser are the last one to walk into the sales transaction. Everyone involved in the sale is smarter than you. The selling agent (paid a commission), the buyers agent (paid a commission), the buyer (emotionally bias), the seller (emotionally bias), the selling attorney (paid a transaction fee), the buyer’s attorney (paid a transaction fee) and the loan officer or mortgage broker (paid a transaction fee) all know more than you do.”

The appraiser in this post-financial reform world doesn’t have a vested interest in the transaction like they did during the housing boom – some could argue they are too detached. The vested interest I speak of occurred during the bubble when mortgage brokers and most banks generally used appraisers who always “made the number.” Incidentally, many of those types of appraisal firms are out of business now.

Let’s clear something up. The interaction an appraiser has with a lender when appraising below the purchase price now is not that much different than during the boom. When an appraiser kills a sale, the appraiser is generally hit with a laundry list of data to review and comments to respond to questions from the AMC, bank or mortgage broker who use the “guilty until proven innocent” approach even though the bank likely won’t rescind the appraisal. The additional time spent by the appraiser is a significant motivator to push the value higher to avoid the hassle if the appraiser happens to be “morally flexible.”

And by the way, sales price does not equal market value.

The sources for most of these low appraisal stories I began this post with come from biased parties so it makes it clear that low appraisals are the problem. In reality, the low appraisal issue is merely the symptom of a broken mortgage lending process. The problem is real and becomes more apparent when a market changes rapidly as it is now. Decimate the quality of valuation experts and you generate results that are less consistent with actual market conditions and therefore more sales are killed than usual. Amazingly the US mortgage lending infrastructure today does not emphasize “local market knowledge” in the appraisers they hire no matter what corporate line you are being fed. This is even more amazing when you consider that most national lenders have only a handful of appraisal staff and tens of thousands of appraisals ordered ever month.

The cynical side of me thinks that rise in low value complaints reflects an over-heated housing market – that the parties are getting swept up in the froth and the neutral appraiser is the voice of reason. The experienced me realizes that financial reform has brought new appraisers into the profession that have no business being here (and pushed many of the good ones out) and that the rise in the frequency of low appraisals has only seen the light of day because housing markets are currently changing rapidly.

Here’s my problem with the mortgage lending industry today as it relates to appraisers:
• Most of the people running bank mortgage functions are the same as during the bubble, only see appraisal as a cost, not as eyes and ears.
• Banks love the current state of appraisals because the values are biased low (banks are risk averse) and they fully control the appraiser.
• Appraisal Management Companies themselves have no real oversight (some are very good, most are terrible).
• Banks no longer emphasize local market knowledge in their appraisers or they pay lip service to it.
• Short term cost savings trumps emphasis on quality and reliability.

Every now and then (like now) everyone seems surprised and feels hassled when appraisal values don’t match market conditions. However the bank appraisal process has largely morphed into an army of robots on an assembly line – either because we are unaware of the problem until it affects us directly or we just want it that way.

Let’s focus on fixing the mortgage lending process or stop complaining about your appraisal.

Tags: , , , ,


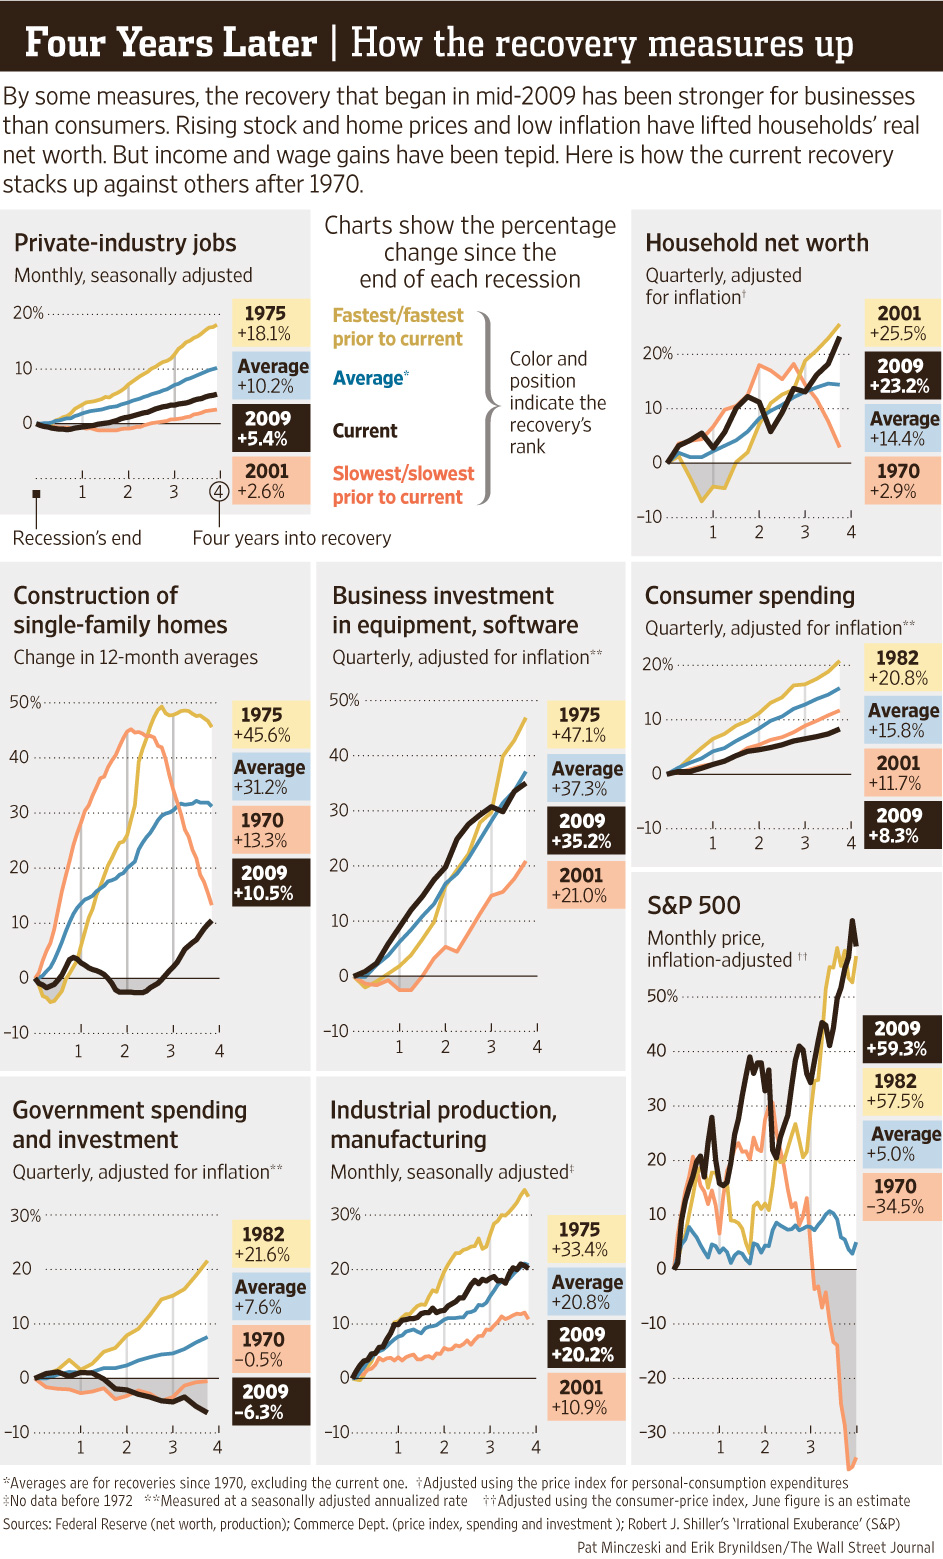
Cool WSJ Infographic on Economic Recovery Since End of Recession

July 1, 2013 | 9:28 am | |


[Source WSJ: click to expand]

Check out this excellent interactive graphics post at the WSJ on the economy since the recession. My fave is above but there are others worth mentioning. Things are slowly improving but note that in the “consumer” section of the interactive (not above), real wages are unchanged since 2009 (housing prices up 12.1% in past year alone).

Tags:


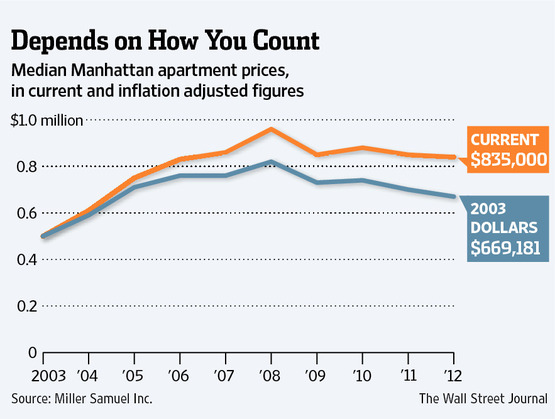
Should We Adjust Housing For Inflation?

February 4, 2013 | 1:27 pm | | Charts |


[click to expand]

I’ve inflation-adjusted housing in some of my charts over the years but it always felt like a double dip since housing is a huge component (42%) of the measurement of inflation.

The issue came up again with last week’s excellent WSJ article on our Manhattan housing figures – adjusted for inflation, housing prices were equivalent to 2004 levels and not adjusting for inflation brought prices to 2006-2007 levels. So I reached out to my friend Jed Kolko, the Chief Economist and Head of Analytics at Trulia who had some thoughts about the issue.

[Jonathan] Is it appropriate to inflation adjust housing prices? I don’t see this done all that often and always wondered if it was appropriate since housing prices (i.e. rental equivalent) are a huge part of the inflation calc?

[Jed] You’re right, that housing prices are an important part of inflation, so it’s a little odd to deflate housing prices by a measure that includes housing prices.

[Jonathan] So when would it be appropriate?

[Jed] The context when it does make sense to inflation-adjust housing prices is when looking over a very long time horizon – like decades – when dollars clearly meant something different than today. In particular, analyses of home prices versus price changes of other assets (like equities) are often (and should be) inflation adjusted in order to show the real return on investment.

[Jonathan] So when would it not be appropriate?

[Jed] The context when it’s definitely not appropriate is when comparing home prices across different cities/metros/regions. Measures of local inflation are hugely driven by home prices, and even local differences in the prices of other things, like restaurant meals or haircuts, are driven largely by local differences in real estate costs. Inflation-adjusting when comparing local home prices is a case of dividing something by itself. The better way to compare housing prices across metros relative to spending power is to divide home prices by income or wages. I did exactly that in this post, as a measure of affordability.

Tags:


[WSJ Live] InflationWatch: Why Manhattan is a “Bargain”

February 1, 2013 | 11:34 am | | TV, Videos |


Josh Barbanel at the Wall Street Journal took the results of our just released Elliman Report: The Manhattan Decade 2003-2012 and adjusted them for inflation – showing that housing prices are as affordable as they were in 2004.

Here’s his original story in WSJ “Easing Apartment Pain” [subscription] that goes with the chart.

Tags: , ,


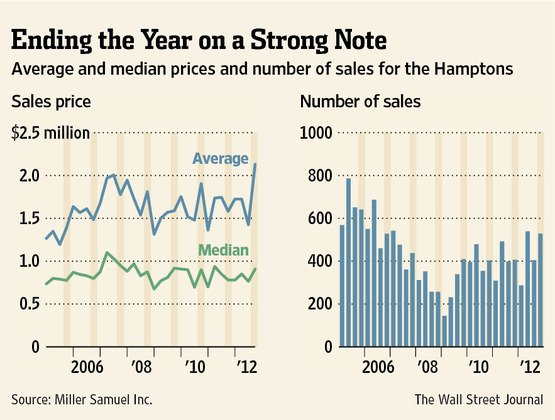
Hampton Year End Sales And Price Spike, Fiscal Cliff Style

January 29, 2013 | 1:03 pm | | Charts |


[click to read article (subscr)]

I thought the chart created by the WSJ using our data nicely illustrated the end of year spike in sales and prices at the end of the 2012, influenced by the notion that taxes, whatever form they take, will be higher in the future. I think this surge in activity will take some of the edge off the market in 2013.

Tags: ,


Looking For That Ray – Knight Frank’s Sunshine Index

December 7, 2012 | 7:00 am | | Reports |


[click to open WSJ article]

As a followup to my analysis of light on property values, I came across this fun way to look at the market.

…real-estate consulting firm Knight Frank looked at 14 warm-weather vacation spots around the world. Using the average hours of sunlight per day and the average house price for a four-bedroom property in a prime real-estate location, Knight Frank arrived at the price for an hour of sunshine, averaged over a year…

Of course this is merely another way to slice and dice the high end housing market – just like the stock market – not scientific or useful but still fascinating – Florida looks like a pretty good deal.


Knight Frank Sunshine Index [WSJ]


Housing Bubble – Canada Is Following US Lead

December 5, 2012 | 7:00 am | | TV, Videos |

A friend of mine shared this video with me, a speech by Pierre Poilievre, MP for Nepean-Carleton, on April 4, 2012, spoke on behalf of the Government on Budget 2012. He is incredibly eloquent, insisting that Canada is not going down the path that the US took. Yet here’s a sobering headline.

Of course, he’s wrong. Even back well before April of this year you could see the froth in cities like Toronto. In Vancouver, sales have now fallen sharply.

Earlier this year I was quoted in the Toronto Star as some sort of bubble veteran that broached the subject of a bubble and I was not surprised to hear the same rationale we heard in the US. Toronto new development was focused on small units to be purchased by investors to rent or flip although defenders rationalized that was how workers would move to the city to expand the economy. Deja vu.

Many believe that Canada is different because prices will only fall for the next few years unlike the US where it was a 6 year fall (2006-2012).

Well, that is still a correction or bubble for nearly the same reasons as the US: government policy, speculation and cheap credit.

My eureka moment

I have long thought that all the housing shows on HGTV ie “Property Brothers”, “Holmes on Homes” etc. were filmed in Canada instead of the US because production costs were cheaper – no! My theory: After the US market tanked in 2006, production was much easier in a housing market where prices were rising, marketing times were fast and credit was readily available. That’s why these shows have continued where “flip this house” in California left off….for now.

Tags: ,


Divorce Valuations: Appraiserville Meets Splitsville

December 1, 2012 | 7:00 am | | Public |

In this week’s WSJ Mansion section there was a nice write up by Alyssa Abkowitz about the appraisal process during a divorce: Appraisers in Splitsville. Our firm does a lot of this type of consulting and we find working with attorneys much easier than dealing with retail banks.

I also find that it’s a small world – I know nearly all the appraisers in my market personally (only a handful are active in this segment). Most are professional and knowledgable but like any profession, there are a few hacks.

The challenge in the divorce appraisal business is the challenge of proper communication between the parties – the slightest miscue can snowball into a huge complicated mess billable by the hour. The key to valuation in this process is to filter out the personal element of it and just do the appraisal. When working for one party, the appraiser never gets the whole story and magically “you’re not always on the ‘right’ side so don’t concern yourself with the details beyond the valuation.” Professionals are the ones that do their job devoid of personal bias.

Tags: ,


Get Down With It: Falling Mortgage Rates Are Not Creating Housing Sales

November 27, 2012 | 11:16 am | | Charts |

Inspired by my analysis of yesterday’s WSJ article, I thought I’d explore the effectiveness of low mortgage rates in getting the housing market going. I matched year-to-date sales volume where a mortgage was used and mortgage rates broken out by conforming and jumbo mortgage volume.

Mortgage volume has been falling (off an artificial high I might add) since 2005, while rates have continued to fall to new record lows, yet transaction volume has not recovered. I contend that low rates can now do no more to help housing than they already have.

Even the NAR has run out of reasons and is now focusing on bad appraisals as holding the market back (I agree appraisal quality post Dodd-Frank is terrible and is impacting the market to a limited extent – and I secretly wish appraiser held that much sway over the market).

I’m no bear, but the uptick Case Shiller’s report today (remembering that Case Shiller reflects the housing market 5-7 months ago) still shows slowing momentum and all 2012 year-over-year comparisons in the various national reports are skewed higher from an anemic 2011.

Five years of falling mortgage rates have only served to provide stability in volume. The monetary and fiscal conversation ought to be on ways to incentivize banks to ease credit – falling rates only makes them more risk averse.

Of course a significant drop in unemployment would likely solve the tight credit problem fairly quickly.

Tags: , , , , , ,


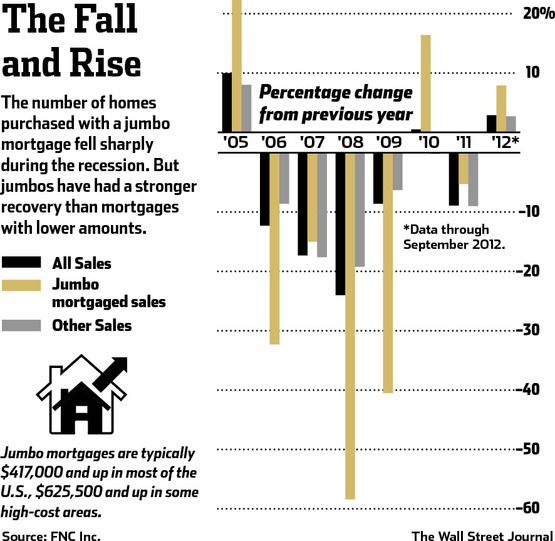
Jumbos Fell Harder, Now Rising Faster, But Off Low Base

November 26, 2012 | 8:30 am | |

In the WSJ, FNC reported that jumbo mortgages saw a larger year-over-year gain than conforming:

Home sales using a jumbo mortgage had year-over-year growth of 7.9% through September, compared with 2.7% for nonjumbo sales, according to an analysis for The Wall Street Journal by mortgage-technology company FNC.

Could this be a sign that credit is thawing a bit more quickly at upper end of the market?

Capital Economics Ltd., in a recent research note, found that jumbo loans are going to borrowers with credit scores as low as 700, compared with 720 or higher previously, and that financing has generally reached $2 million from a previous upper limit of $1.5 million.

Anecdotal sure, but when looking at the actual jumbo mortgage data, it appears that from 2005 to 2012, mortgage volume for jumbo fell 83.1% and non jumbo fell 46.9%. In other words, jumbo mortgage volume fell 2x further than non jumbo from peak. Also, a number of the high cost markets had their base level lowered expanded what is now considered a “jumbo loan”:

Also, the floor for a jumbo loan fell in some high-cost areas last fall. In Los Angeles and New York, for example, the definition of a jumbo dropped to $625,500 and up from $729,750 and up. With the lower floor, a loan of $700,000 would now be a jumbo loan.

So the fact that jumbo volume is up 7.9% versus 2.7% reflects it being calculated from a much lower base number, and with lower jumbo thresholds, more loans are being classified as jumbo. This likely resulted in a somewhat larger jumbo market share, reaching 5.5% of total mortgages in 2012 compared to 5.2% in 2011.

My takeaway here is that jumbos are not growing at 3x the rate of conforming as FNC seems to be suggesting, but jumbos (5.5% of the first mortgage market) are more likely consistent with the balance of the mortgage market.

Since jumbos have no real secondary market to allow mortgage lenders to free up their capital to lend more, jumbos are actually performing amazingly well however you slice it, just not better than conforming mortgages.

Tags: , ,


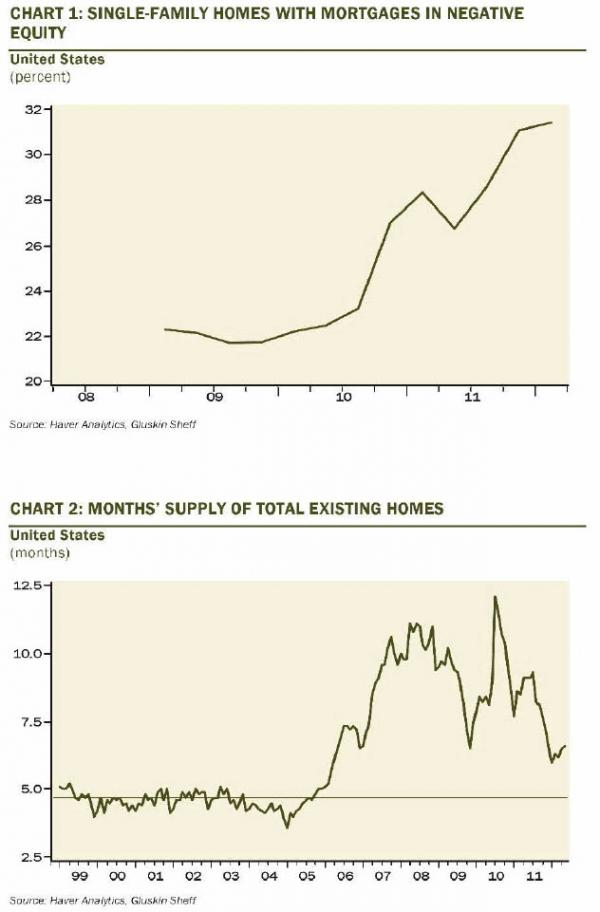
Low Housing Inventory Is NOT A Sign of Housing Recovery

July 9, 2012 | 10:49 am | |

I wrote “The Decline In Inventory Right Now is NOT a Good Sign” back in February, but there has been a more refined discussion about low inventory recently. Back then my orientation was more about the “robo-signing” scandal causing a drop in distressed listings as servicers held back supply – as well as the lack of confidence by sellers over whether they can achieve their price.

Stan Humphries, chief economist of Zillow has been a guest on my podcast and penned a great piece about it a few weeks ago called “The Connection Between Negative Equity, Inventory Shortage and Increasing Home Values: Why the Bottom Won’t Be as Boring as We Expected” tackling the impact of negative equity on inventory.

CoreLogic reported (via Nick Timiraos/WSJ) that the supply of homes for sale declines as negative equity increases.

David Rosenberg, chief economist as Gluskin-Sheff, and whom I had the pleasure of meeting with for dinner a few months ago, presented a great series of charts in his newsletter (via ZeroHedge).

It basically presents the idea that “upside-downers” ie those with negative equity, can’t list their homes for sale because they don’t have equity (or enough equity) for the next one.

Here’s the most compelling excerpt:

According to data cited by the USA Today, the supply backlog where over half of homeowners are “upside down” on their mortgage is at 4.7 months’; in areas where “upside down” borrowers make up less than 10% of the market, the listed inventory is closer to 8.3 months’ supply.

In other words, in markets with unusually tight inventory, prices are being “goosed” higher, not because the housing market is improving, but because there are fewer houses in the game. Low mortgage rates are artificially creating excess demand, with those buyers fighting over the slim pickings of sellers who can actually sell.

That, my friends, is NOT a housing recovery.

More visuals:


The Decline In Inventory Right Now is NOT a Good Sign [Matrix]
David Rosenberg Explains The Housing “Recovery” [Zero Hedge]
The Connection Between Negative Equity, Inventory Shortage and Increasing Home Values: Why the Bottom Won’t Be as Boring as We Expected [Zillow Real Estate Research]
Why Aren’t There More Homes for Sale? [WSJ Developments Blog/Nick Timiraos]

Tags: , ,


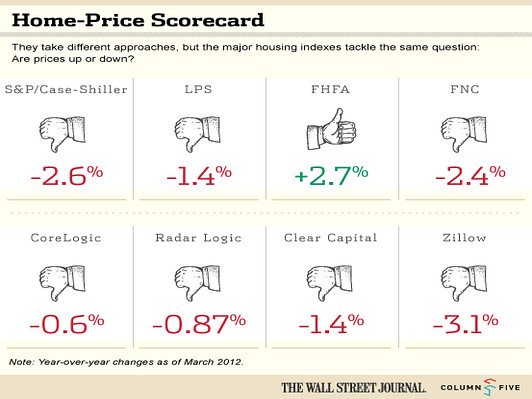
[WSJ] The Crazy 8: Comparing Results of National Home Price Indices

June 9, 2012 | 1:18 pm | |

Matthew Strozier over at WSJ with Column Five (a large producer of infographics) presented an interesting side by side of 8 national housing indices.

All but one index shows a year over year decline in housing. Trulia’s new Price Monitor by Jed Kolko would be a great addition once the year-over-year history is established. It was also interesting that NAR’s Existing Home Sales was omitted (I’m not advocating).

Beyond the obvious price decline, my takeaways were:

  1. US indices are general in sync on the year-over-year. Our confusion in the monthly barrage of housing metric releases is that most push the month-over month.
  2. With the proliferation of these indices, data subscriptions must be getting cheaper. There are a few more out there as well.
  3. Of the indices presented, their data collection and methodologies vary significantly (where disclosed) yet their results were consistent perhaps suggesting the 7 for 8 result is coincidence as opposed to an aggregated trend.
  4. Sales prices are not something we should be obsessed with as an indicator of market health (think Las Vegas, mid decade). I’d much prefer seeing more attention paid to sales trends since they are a pre-cursor to price trends if you are trying to reasonably answer the question: Has the US housing market hit bottom?

It is interesting and my rough understanding that most of these indices were created and run by economists, scientists or data wonks, many for Wall Street purposes with virtually no real estate types. That’s obviously fine until you consider what is said in barrage of monthly press releases for some, citing things that are not empirically measured in their respective reports, i.e. weather, inventory, etc. that create further confusion.

I’d love to see a side by side comparison of the lag time from the point of “meeting of the minds” between buyer and seller for each index. The significant lag time reflected in this index genre is a practical one due to the massive scale of information, but I think it would give consumers (who were generally not the intended users of any of these indices at the time they were created) a better sense of reliability for each.

National housing indices provide useful tools for setting government economic policy but the consumer’s obsession with the idea of a national housing market and it’s relevance to their local markets is, well, crazy.

Tags: , ,

Get Weekly Insights and Research

Housing Notes by Jonathan Miller

Receive Jonathan Miller's 'Housing Notes' and get regular market insights, the market report series for Douglas Elliman Real Estate as well as interviews, columns, blog posts and other content.

Follow Jonathan on Twitter

#Housing analyst, #realestate, #appraiser, podcaster/blogger, non-economist, Miller Samuel CEO, family man, maker of snow and lobster fisherman (order varies)
NYC CT Hamptons DC Miami LA Aspen
millersamuel.com/housing-notes
Joined October 2007