Matrix Blog

Trulia

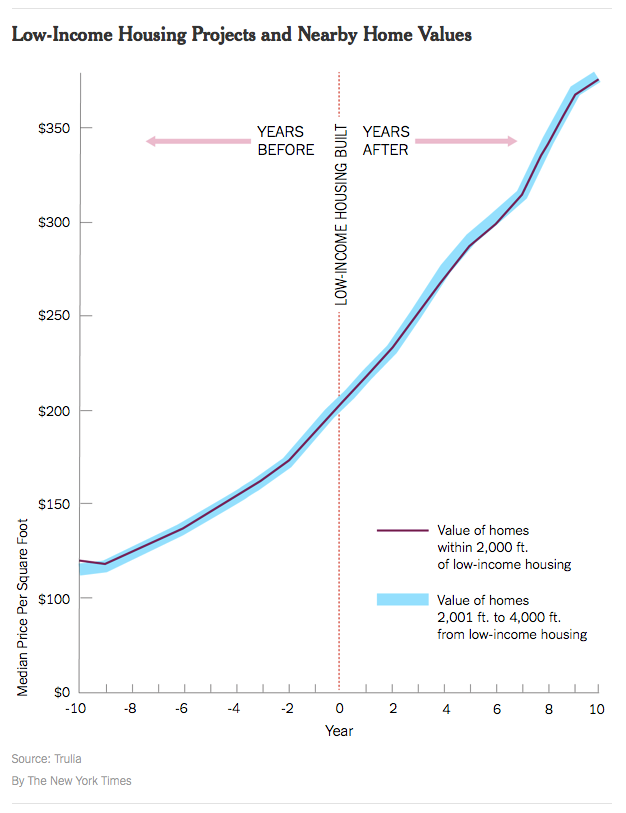
YIMBY: Low-Income Housing

November 25, 2016 | 2:02 pm | | Infographics |

lowincomevvaluetrulianyt

The YIMBY (Yes-In-My-Backyard) movement is fairly new.

In the United States, early leaders of the YIMBY movement include Sonja Trauss in San Francisco and Nikolai Fedak in New York. The first ever Yes In My Backyard conference was held in Boulder, Colorado, in June 2016.

Nikolai has done an amazing job at chronicling the explosion of new development in NYC over the past several years with his must read web site New York YIMBY.

One of the misconceptions with the NIMBY movement which is largely the opposite of YIMBY is the idea/rule of thumb that low-income housing always drags down property values of nearby properties. In an era challenged by the lack of any type of affordable housing, this makes a bad situation worse.

According to this recent research by Trulia (FYI – I was part of their industry advisory board from 2006-2014), and notably in aggregate form, the impact seems to be non-existent in the majority of the markets covered. One can’t conclude there is no impact as a general rule but it does show that should not be the default assumption.

The above infographic is from this Weekend’s New York Times’ real estate section column called ‘Calculator’ – Low-Income Housing: Why Not in My Neighborhood?. The methodology used in the Trulia research was the following:

To measure this, Trulia compared the median price per square foot of nearby homes (within 2,000 feet of low-income housing) with that of homes farther away (2,001 to 4,000 feet) over 20 years, starting 10 years before the low-income housing was built and ending 10 years after.

Tags: , , , ,


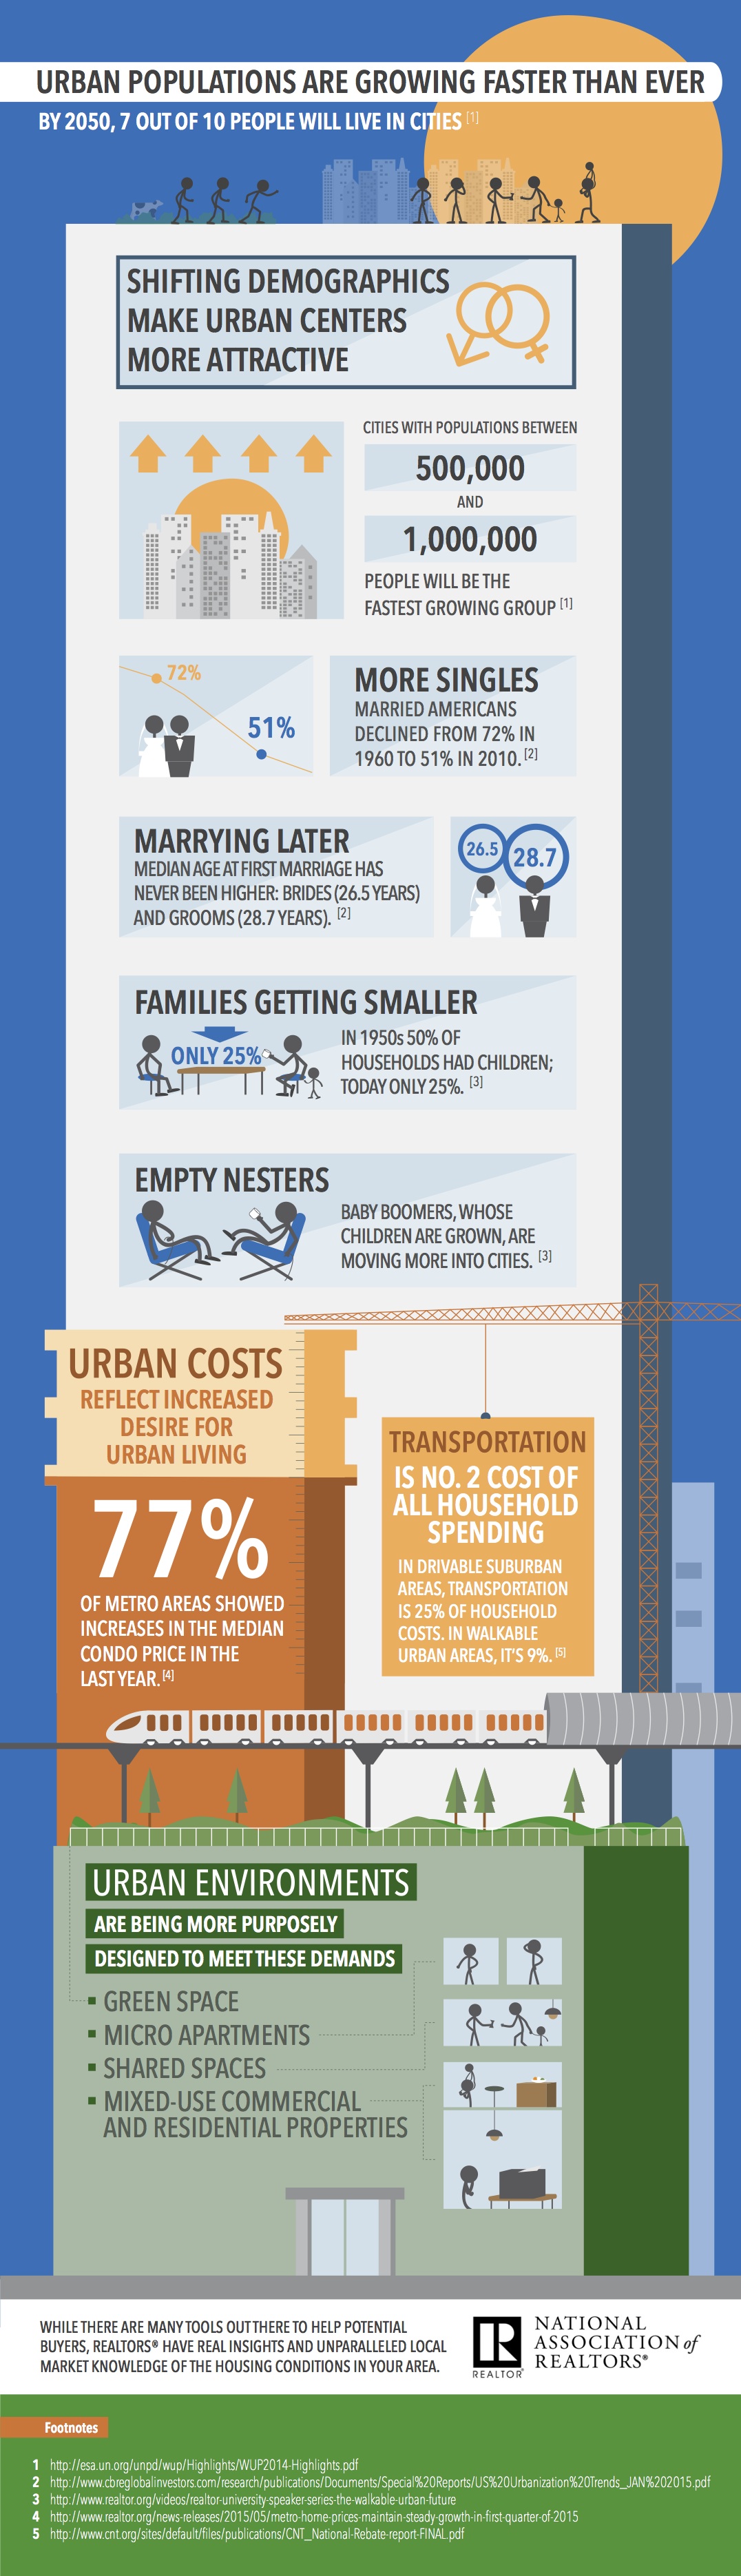
[Infographic] NAR gets into the Urbanization Conversation

September 1, 2015 | 10:12 am | | Infographics |

The National Association of Realtors, who is generally viewed as emphasizing suburban single family housing markets, may be plotting a new course. NAR will be sharing more releases on the topic of urbanization in the coming months. They look to be taking the same path as Realtor.com, the online entity who licenses their name from the NAR mothership. Realtor.com has cleaned up their act and has been much more focused on city life after their recent purchase by News Corp (through Realtor.com’s parent company Move), trying to become relevant again by emulating Zillow and Trulia. And of course, the consumer wins.

It’s a good thing too since urbanization is one of the most important housing trends (affordability aside) facing the housing market going forward.

Here’s an interesting infographic released by NAR today:

NARurbanismInfographic

Tags: , , , , , ,


My First Post on Bloomberg View: Homebuying Gets a Housecleaning

July 28, 2014 | 9:28 pm | | Charts |

BVlogo

I was recently approached by Bloomberg View, the editorial arm of Bloomberg LP, to provide commentary on the housing market. I seem to be in good company.

Although their well oiled machine began to append my additional title “Bloomberg Contributor” earlier in the month when being sourced, it wasn’t an oversight on their part. I didn’t submit my first post until last week. It took me a few weeks to get my groove on as I was in the midst of a 2Q14 market report release gauntlet.

Last Wednesday evening I wrote my first post about Lawrence Yun’s attendance at the Zillow Housing Forum and how NAR had become just one of the crowd, and the symbolism of it all. I got the idea when I was sent the Zillow e-vite to attend the conference and I noticed that Yun was to speak.

Excited, I submitted my first post on Thursday morning, unfortunately just before the Zillow-Trulia bombshell deal jumped into the headlines. So I needed to add this new twist – which thankfully made my original point even stronger. I re-wrote my first post and it was placed online last Friday.

Here is the first column of hopefully many to come: Homebuying Gets a Housecleaning


My Bloomberg View RSS feed.

Tags: , , ,


[WSJ] Good Overview on 2014 US Housing Expectations – Jed Kolko, Trulia

February 26, 2014 | 12:32 pm | |

Jed Kolko does a nice job summarizing what the general housing market may look like in 2014 after the new home sales report came out today.

My big takeaway was that any housing market improvement will be more affected by local job and income growth rather than the “rebound effect.” This phenomena occurred in markets that were hit hardest by the downturn, yet saw the largest price increases.

I’ve added “rebound effect” to my 2014 phrase list, right after “polar vortex.”

Tags: , , , , , , ,


Should We Adjust Housing For Inflation?

February 4, 2013 | 1:27 pm | | Charts |


[click to expand]

I’ve inflation-adjusted housing in some of my charts over the years but it always felt like a double dip since housing is a huge component (42%) of the measurement of inflation.

The issue came up again with last week’s excellent WSJ article on our Manhattan housing figures – adjusted for inflation, housing prices were equivalent to 2004 levels and not adjusting for inflation brought prices to 2006-2007 levels. So I reached out to my friend Jed Kolko, the Chief Economist and Head of Analytics at Trulia who had some thoughts about the issue.

[Jonathan] Is it appropriate to inflation adjust housing prices? I don’t see this done all that often and always wondered if it was appropriate since housing prices (i.e. rental equivalent) are a huge part of the inflation calc?

[Jed] You’re right, that housing prices are an important part of inflation, so it’s a little odd to deflate housing prices by a measure that includes housing prices.

[Jonathan] So when would it be appropriate?

[Jed] The context when it does make sense to inflation-adjust housing prices is when looking over a very long time horizon – like decades – when dollars clearly meant something different than today. In particular, analyses of home prices versus price changes of other assets (like equities) are often (and should be) inflation adjusted in order to show the real return on investment.

[Jonathan] So when would it not be appropriate?

[Jed] The context when it’s definitely not appropriate is when comparing home prices across different cities/metros/regions. Measures of local inflation are hugely driven by home prices, and even local differences in the prices of other things, like restaurant meals or haircuts, are driven largely by local differences in real estate costs. Inflation-adjusting when comparing local home prices is a case of dividing something by itself. The better way to compare housing prices across metros relative to spending power is to divide home prices by income or wages. I did exactly that in this post, as a measure of affordability.

Tags:


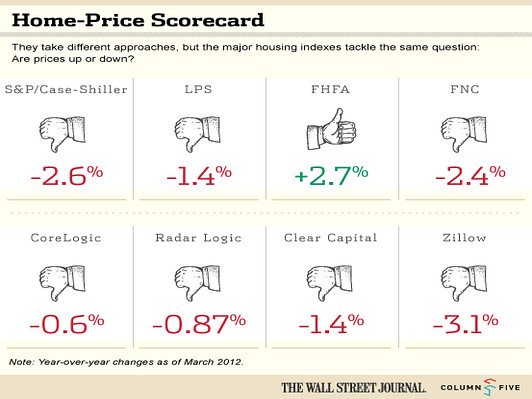
[WSJ] The Crazy 8: Comparing Results of National Home Price Indices

June 9, 2012 | 1:18 pm | |

Matthew Strozier over at WSJ with Column Five (a large producer of infographics) presented an interesting side by side of 8 national housing indices.

All but one index shows a year over year decline in housing. Trulia’s new Price Monitor by Jed Kolko would be a great addition once the year-over-year history is established. It was also interesting that NAR’s Existing Home Sales was omitted (I’m not advocating).

Beyond the obvious price decline, my takeaways were:

  1. US indices are general in sync on the year-over-year. Our confusion in the monthly barrage of housing metric releases is that most push the month-over month.
  2. With the proliferation of these indices, data subscriptions must be getting cheaper. There are a few more out there as well.
  3. Of the indices presented, their data collection and methodologies vary significantly (where disclosed) yet their results were consistent perhaps suggesting the 7 for 8 result is coincidence as opposed to an aggregated trend.
  4. Sales prices are not something we should be obsessed with as an indicator of market health (think Las Vegas, mid decade). I’d much prefer seeing more attention paid to sales trends since they are a pre-cursor to price trends if you are trying to reasonably answer the question: Has the US housing market hit bottom?

It is interesting and my rough understanding that most of these indices were created and run by economists, scientists or data wonks, many for Wall Street purposes with virtually no real estate types. That’s obviously fine until you consider what is said in barrage of monthly press releases for some, citing things that are not empirically measured in their respective reports, i.e. weather, inventory, etc. that create further confusion.

I’d love to see a side by side comparison of the lag time from the point of “meeting of the minds” between buyer and seller for each index. The significant lag time reflected in this index genre is a practical one due to the massive scale of information, but I think it would give consumers (who were generally not the intended users of any of these indices at the time they were created) a better sense of reliability for each.

National housing indices provide useful tools for setting government economic policy but the consumer’s obsession with the idea of a national housing market and it’s relevance to their local markets is, well, crazy.

Tags: , ,


[Trulia] Price Reduction Report – June 2010

June 16, 2010 | 6:01 am | |


[click to open report]

Trulia released its Price Reduction Report for June 2010.

22 percent of listings currently on the market in the United States as of June 1, 2010 experienced at least one price reduction, which is a slight decrease from 23.6 percent in June 2009. The total dollar amount slashed from home prices was $26.7 billion and the average discount for price-reduced homes continued to hold at 10 percent off of the original listing price.

Last month (May) I speculated that the number of listings with price reductions will rise sharply after the tax credit expiration flows through the numbers. Pete suggests the same thing in this release.

“Sellers are optimistic heading into the summer season because of the strong sales figures from the spring. The spring sales were fueled by the expiration of the tax credit and my concern is that this heavy activity is providing sellers with a false state of optimism,” said Pete Flint, co-founder and CEO of Trulia. “We are already starting to see rising inventory levels and I believe this will be the story of the summer. For the unforeseen future, buyers will continue to have the negotiating power and I expect we will see sellers get aggressive via price cuts throughout the summer.”

Is something happening in Minneapolis? For the second month in a row, Minneapolis, MN saw 40 percent of its listings reduced in price.

At 21%, the luxury market (>$2M) is consistent 22% for the overall market. * Price reduction levels for luxury homes (those listed at $2 million and above) continue to hold steady with 21 percent of homes seeing a price reduction, averaging 14%. Luxury homes account for 2% of the inventory and 25% of total dollar volume cuts. It consistent with the overall weakness at the high end of the US housing market brought about largely from the higher underwriting requirements for jumbo financing and the disappearance of the secondary jumbo mortgage market which had largely been run through the capital markets.

I was somewhat surprised to see Phoenix in the top five since price reductions had been so severe over the past 4 years.

Top 5 cities with highest number of price reductions

[click to open full list]

Top 5 cities with lowest number of price reductions

[click to open full list]

Trulia Home Price Reduction Report [Trulia.com]


Trulia.com Leverages Rental Data With Rent vs. Buy Index

June 3, 2010 | 8:00 am | |

Ever since I introduced my Manhattan Rental Market Overview last year, I’ve been playing around with price/rent multipliers and concluded that something has to change. Either prices need to fall or rents need to rise in order to get out from under the credit fueled ownership premium buyers were paying during the boom. I used median sales price versus median rent (annualized).

Trulia created the Trulia.com Rent v. Buy Index that is based on the 50 largest US cities by population and divides the average listing sales price by the average listing rental price using 2-bedroom apartments, condos and townhomes.

Top 10 Cities Cheaper To Own Than Rent
[click to open full index]

At the peak of the real estate bubble, cities like Miami, Phoenix and Las Vegas were not affordable for many. Now the opposite is true,” said Pete Flint, co-founder and CEO of Trulia. “Home sellers in these hard hit areas are forced to lower their prices to compete with all the foreclosures on the market. As a result , these unattainable markets are so affordable it makes better financial sense to buy than rent.

Top 10 Cities Cheaper To Rent Than Own
[click to open full index]

That’s the theory since affordability is now so favorable to purchasers – however the problem with some of the former speculative markets which are now very affordable to buyers, is the fact that financing isn’t readily available because of shadow inventory and significant oversupply. There was so much overbuilding back in the day that there aren’t enough buyers now and the mortgage lending net is not cast nearly as wide.

If the Price-to-Rent Ratio is:

  • 1-15: cheaper to own than to rent
  • 16-20: neutral
  • 21+: cheaper to rent than own

Trulia.com Rent vs. Buy Index [Trulia]


[Eye on Real Estate] WOR NewsTalk Radio 710 May 22, 2010

May 24, 2010 | 10:03 pm | | Public |

For each week’s Eye on Real Estate Show on WOR NewsTalk Radio 710, we include a segment called “Jonathan Miller’s BlogCast” where I discuss several housing related posts from some of my favorite blogs. They cover topics that are current, funny or simply a “must read”.

Last Saturday’s BlogCast covered the following blog posts:

[The Curious Capitalist] The hidden changes in financial reform The Senate passed its financial reform bill. Huzzah! What did the Senate wind up with after three weeks of such intense lobbying and debate?…

[Trulia Blog] Trulia RealtyTrac Survey: American Attitudes Towards Foreclosure Today, Trulia.com and RealtyTrac released the latest results of an ongoing survey tracking home buyers’ attitudes towards foreclosures. The new online survey conducted on their behalf from May 10-12, 2010 by Harris Interactive® showed a notable decrease in consumers’ willingness to buy foreclosed properties compared to one year ago…

[WSJ/Developments Blog] U.S. Mortgage Delinquencies Appear to Level Off The number of American households behind on mortgage payments appears to be leveling off at a high level, a survey showed Wednesday… I also discussed the MBA confusion over the results in a great New York Times article.


If you missed this past Saturday’s show or any prior show, you can listen to the podcast at any time or subscribe to it for free via iTunes to always get the latest show delivered automatically to your computer or handheld device. My Blogcast is usually in the first hour of the show.

Listen to the most recent Eye on Real Estate podcast.

Subscribe to the free weekly Eye on Real Estate podcast.

Become a fan on Facebook.

Or visit the Eye on Real Estate Website.


Tags: , ,


[Trulia/RealtyTrac Survey] Attitudes Get Hammered

May 20, 2010 | 11:02 pm | |

Today I Iistened in to an informative conference call hosted by Trulia’s co-founder and CEO Pete Flint and RealtyTrac‘s Rick Sharga. As always great stuff, and I got to act like a reporter and ask a question – lots of reporters were on the line. More on my question in a later post.

Pete commented that as we go into a housing market of declining government support, foreclosures will continue to become an integral part of the housing market – loan mod programs were not making an impact on foreclosure volume. Rick suggested the “short sale” phenomenon was over hyped because it will not solve the significant foreclosure problem. Foreclosures will peak in 2011 and then return to normal levels by 2013. 5.5M properties in serious delinquncy, 100k new foreclosures per month with a 55 month supply.

Interesting survey results (press release or on Trulia Blog)

  • 59 Percent of homewoners with a mortgage would not consider walking away from their home no matter how much their home is “underwater”.
  • 1 Percent of Homeowners With A Mortgage Say Walking Away Is Their First Choice If Unable To Pay; 69 Percent Say Modifying Their Loan is Their First Choice
  • While the stigma around owning a foreclosure has subsided, interest in purchasing a foreclosure is significantly down year-over-year
  • For every borrower who avoided foreclosure through HAMP last year, another 10 families lost their homes. It now seems clear that government programs will not reach the overwhelming majority of homeowners in trouble
  • 18 percent of U.S. adults expect bank-owned homes to offer a realistic price discount of less than 25 percent off the value of a similar home that was not in foreclosure
  • 36 percent saying that they expect to receive a discount of 50 percent or more when purchasing a bank-owned property
  • 78 percent of U.S. adults believing there are downsides to buying foreclosed properties compared to 85 percent in May 2009
  • The majority of U.S. adults (92 percent) said they would be willing to invest in improvements such as renovations and remodeling if they purchased a foreclosed home
  • Renters are showing strong interest in buying foreclosed properties, with 57 percent at least somewhat likely to purchase a foreclosed home in the future


[Trulia] Price Reduction Report – May 2010

May 16, 2010 | 10:07 pm | |


[click to open report]

Trulia released its Price Reduction Report for May 2010.

The May report showed that the percentage of listings with at least 1 price reductions is rising – now for two consecutive months. I suspect that once confident sellers are softening to meet buyers who are holding to their number. I would think that for us to see the number of discounts rise during the most active time of the year, the market is cooling. We would expect the number of discounts to fall during this period. It will be interesting to follow this metric once Trulia is able to compare year over year this summer.

I think that this metric will rise sharply in a few months after the tax credit expiration flows through the numbers. Pete suggests that we may be in for some turmoil ahead.

“With more than a year of the federal government’s involvement, we are now re-entering the free market system. As we readjust to the free market, we expect to hit turbulence in some markets,” says Pete Flint, Trulia co-founder and CEO. “We won’t know the true severity of the tax credit expiration until the conclusion of the peak home buying season in the summer months. Only then will we have a better sense if the U.S. housing market can stand on its own two feet.”

This is an interesting market quirk:

Luxury Market Unfazed by Tax Credit Incentive Price reduction levels for luxury homes (those listed at $2 million and above) continues to hold steady from last month with an average discount of 14% in price reductions. The average discount for homes priced less than $2 million remains at 9 percent.

Top 5 cities with highest number of price reductions

Top 5 cities with lowest number of price reductions

Trulia Home Price Reduction Report [Trulia.com]


[Trulia] Price Reduction Report – April 2010

April 23, 2010 | 11:17 pm | |


[click to open report]

Note: I don’t have the May 2009 number, hence the dotted line (can anyone at Trulia share it with me?)

Trulia released its Price Reduction Report for April 2010 and press release.

The report indicated that the number of price reductions and the size of reductions are beginning to abate. CEO Pete Flint, nails my sentiment on this “good news” with pin point accuracy (ie lots of headwinds over the next year so lets not over-hype the good news).

“With such a dramatic drop in home price reductions over the past year, we’re beginning to see early signs of stabilization in the housing market on a national level, as well as locally in certain markets,” said Pete Flint, Trulia co-founder and CEO. “As the federal stimulus comes to an end this month, coupled with expected increases in interest rates and foreclosures, the next few months will be very telling for whether the U.S. housing market can be self-sustaining over the longer-term. Trulia will continue to track price reductions going forward as an indicator of health in real estate market.”

The table seems to show that markets that saw large price declines early on have less price reduction activity now suggesting that, at least for now, their markets don’t have large swaths of listing price declines ahead of them as properties approach market value.

I do believe that the likelihood of additional declines in the US housing market in the latter half of 2010 are very possible give the factors that Pete cited in his quote above.

Still, its better news than we’ve grown accustomed to and we’ll take it for now.

Trulia Home Price Reduction Report [Trulia.com]


Get Weekly Insights and Research

Housing Notes by Jonathan Miller

Receive Jonathan Miller's 'Housing Notes' and get regular market insights, the market report series for Douglas Elliman Real Estate as well as interviews, columns, blog posts and other content.

Follow Jonathan on Twitter

#Housing analyst, #realestate, #appraiser, podcaster/blogger, non-economist, Miller Samuel CEO, family man, maker of snow and lobster fisherman (order varies)
NYC CT Hamptons DC Miami LA Aspen
millersamuel.com/housing-notes
Joined October 2007