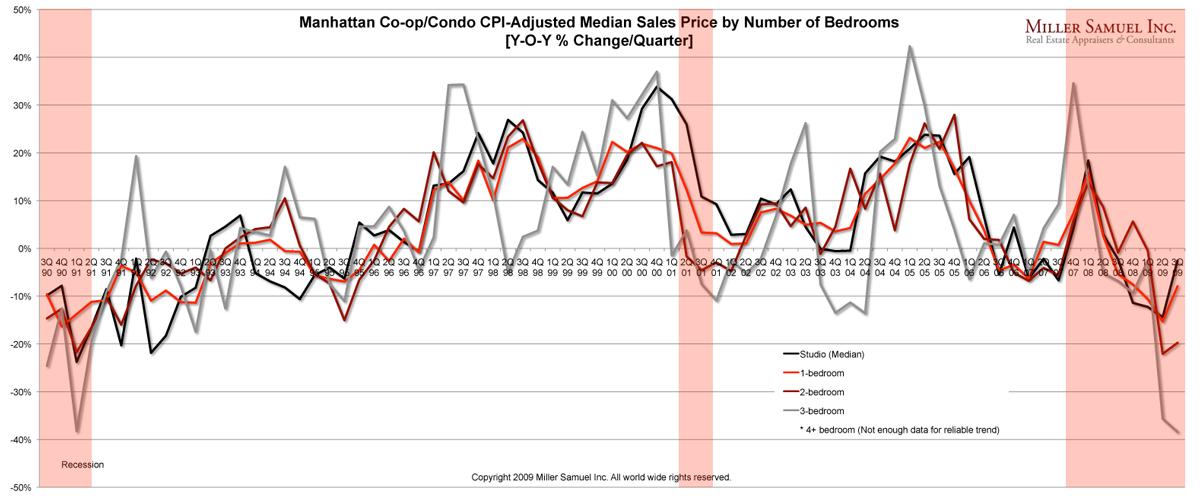
I’ve inflation-adjusted housing in some of my charts over the years but it always felt like a double dip since housing is a huge component (42%) of the measurement of inflation.
The issue came up again with last week’s excellent WSJ article on our Manhattan housing figures – adjusted for inflation, housing prices were equivalent to 2004 levels and not adjusting for inflation brought prices to 2006-2007 levels. So I reached out to my friend Jed Kolko, the Chief Economist and Head of Analytics at Trulia who had some thoughts about the issue.
[Jonathan] Is it appropriate to inflation adjust housing prices? I don’t see this done all that often and always wondered if it was appropriate since housing prices (i.e. rental equivalent) are a huge part of the inflation calc? [Jed] You’re right, that housing prices are an important part of inflation, so it’s a little odd to deflate housing prices by a measure that includes housing prices. [Jonathan] So when would it be appropriate? [Jed] The context when it does make sense to inflation-adjust housing prices is when looking over a very long time horizon – like decades – when dollars clearly meant something different than today. In particular, analyses of home prices versus price changes of other assets (like equities) are often (and should be) inflation adjusted in order to show the real return on investment. [Jonathan] So when would it not be appropriate? [Jed] The context when it’s definitely not appropriate is when comparing home prices across different cities/metros/regions. Measures of local inflation are hugely driven by home prices, and even local differences in the prices of other things, like restaurant meals or haircuts, are driven largely by local differences in real estate costs. Inflation-adjusting when comparing local home prices is a case of dividing something by itself. The better way to compare housing prices across metros relative to spending power is to divide home prices by income or wages. I did exactly that in this post, as a measure of affordability.

