Matrix Blog

Amenities, Adjustments & Value Logic

Establishing the COVID-19 Demarcation Line: From ‘Hanks To Banks’

April 28, 2020 | 5:26 pm | Milestones |

This topic was explored in last Friday’s Housing Notes.

In order to understand what is happening now, we need to ween ourselves off of what happened before this crisis and focus on finding data exclusive to the post-COVID-19 era. In Manhattan, that data set is not yet apparent because we are in nearly a total market shut down but it is evident elsewhere to a limited degree. From my perspective, the demarcation line for the onset of the crisis is where market participants would have to be living in a cave on a desert island to be unaware of the sharp pivot in market sentiment.

March 15, 2020

I believe that date is March 15th which is the date of the Federal Reserve federal funds rate cut to zero and was their second cut in less than two weeks.

March 11, 2020

My friend and California appraiser Ryan Lundquist proclaimed March 11th which was the date Tom Hanks announced he and his wife had contracted COVID-19. Phil Crawford of Voice of Appraisal said the demarcation line was March 5, 2020 dubbing it “data point zero” and I had originally said the demarcation line was March 3, 2020, on the day of the 0.5% rate cut in March.

I was talking about this difference in these dates with a friend, Chicagoan, and RAC appraiser Michael Hobbs who brilliantly dubbed this four-day window from March 11 to March 15 as: “From Hanks To Banks.”

And if you do the math, the median and average date of March 11 and March 15 is literally Friday the 13th so what more confirmation of a demarcation line do you need?

Whatever your specific local demarcation line is, use it to keep the data for these two market periods separate.

Tags: , , ,


Talking Manhattan Podcast: The Market’s Underlying Issues, and How to Value Outdoor space

September 26, 2019 | 4:12 pm | Podcasts |

I was just interviewed by Noah Rosenblatt and John Walkup of Urban Digs for their “Talking Manhattan” Podcast. I’ve known Noah for well over a decade and always enjoy geeking out on the market with him. He’s a data nerd with a real estate agent and day trader background. I’m proclaiming that John Walkup has the best real estate-related last name in the business and is clearly able to “elevate” any real estate conversation.

They weren’t kidding yesterday when they said they were going to get this podcast out right away, placing the interview online this morning. I was speaking to a group of real estate agents on the roof deck of a new building this morning, and four of them told me they had already listened to the podcast and one confirmed that he heard it in the shower and noted that was high praise. Love it.

One of the topics we focused on covered the adjustment for outdoor space in valuation. Throughout my career – when I get a lot of similar inquiries on a particular valuation topic, I turn it into a blog post – here is a collection of value-related posts in one place. One of the most read “value” resources in the collection covers outdoor space in a blog post I wrote in 2010. Admittedly I’m a bit relieved my written methodology still holds up nine years later!

Their interview of me is below. I hope you enjoy it and subscribe to their podcast as I do.


Tags: , , ,


The Full Nelson: Tax Reform Impact on Residential and Commercial Real Estate

January 28, 2018 | 9:03 pm | TV, Videos |

James Nelson, a commercial broker powerhouse who just moved from Cushman & Wakefield to Avison Young, came to my office and interviewed me on the new federal tax law and related subjects for his Globe Street blog column called “The Full Nelson“.


[click on image to watch interview]

He provided NYC sales volume data for all NYC boroughs but Staten Island – and I combined it with the residential data we collect to see how the real estate types compare side-by-side.


[click to expand]

Tags: , , , ,


Explainer: Overall Median Sales Price Submarket Changes May Not Fall In Range

October 29, 2017 | 8:39 pm | Infographics |

This title is way too wonky but I found it hard to pare down. It’s easier to explain visually.

When I complete my research for Douglas Elliman in a particular housing market and the percent change in the overall median sales price doesn’t fall within the individual submarkets like averages do, I periodically receive inquiries from media outlets or real estate professionals to clarify. Many people see median sales price much like they see average sales price: proportional.

In this case, the median sales price change for resale to new development ranged from -23% to +1.9% yet the overall median increased 9.3…clearly outside of the range both submarkets established.


So I whipped up the following infographic with sample sales transactions and applied median and average sales price to illustrate how median sales price percent change for the overall market might not always fall within the individual submarket percent price changes. However, in an “average” analysis, the overall result will always fall within the range of the submarkets.

I hope the following color-coded breakdown below helps illustrate this clearly – be sure to click on the image once to expand or a second time for the extra large version.


[click to expand]

Tags: ,


How Not to Value A Co-op Apartment: Price per Share

May 12, 2016 | 11:59 am | Favorites |

Dakota_1890_wiki
Source: Wikipedia.

Co-op Boards Cannot Prevent Sales They Think Are Low Without Damaging Shareholder Values

I have spoken with buyers, sellers or real estate agents that were told by co-op board members their sale may not be approved by the board because the resulting “price per share” of the sale (purchase price/apartment shares) is less than a prior similar sale in the building. Here are some thoughts about co-op boards who try to “protect” shareholder values by preventing transactions.

  1. Co-op boards wield a lot of power over a sale within their building. In a research study I coauthored that was published by NYU Furman Center for Real Estate and Urban Policy with Michael H. Schill and Ioan Voicu called The Condominium v. Cooperative Puzzle: An Empirical Analysis of Housing in New York City found that there was an inherent cost of a co-op board’s power over their shareholders, unlike the relationship between a condo association and their respective unit owners. It is important to note that market forces are far more powerful than a co-op boards intention to “protect” the market within their building. Much of this gateway mentality stems from the legacy of no public record for co-op sales prior to 2003 (made public record in 2006, but retroactive to 2003). When a co-op overextends it reach and stops a sale because the price is considered too low – often because it falls short of a recent similar apartment’s sales price – the co-op board is doing a disservice to their shareholders, despite best intentions. Why? The decline of a transaction where the listing was properly exposed to the market creates a public perception that the board is disconnected from the market. Brokers are less likely to bring buyers to listings within such a building in the future. Less market exposure for listings in the building means fewer potential buyers and ultimately a lower achievable sales price.

  2. Housing markets do not always rise. This was made clear during the housing bubble and bust cycle a decade ago. The mindset of requiring a current sale to be higher than the last highest similar sale would prevent any sale from occurring when a market is flat or falling. This taints the building in the market and would make values fall much harder in a down cycle once the board capitulated. This would serve as a significant miscarriage of board power during such a cycle. I saw a lot of this circa 2009 after Lehman collapsed. A board would consistently nullify deals on a specific listing that was properly exposed to the market. By the time the third market vetted contract was signed at about the same price, the seller would give up and be possibly exposed to significant financial hardship. And since many co-ops are restrictive about a temporary rental scenario, the seller would be unable to rent the apartment after they moved out.

  3. One of a few valuation remnants of the past includes a co-op board valuing a current contract sale on a price per share basis. This is a “shotgun” approach to determining a reasonable market value and is at best case, a broad brushstroke approach that is not suitable for an individual apartment valuation. Valuing by share allocation does not reflect the fair market value. When the sales price per share is consistent with a building average or trend, it is simply coincidence within a wide bandwidth of price probabilities. Such a price per share valuation philosophy would appear to violate the board’s fiduciary responsibility to protect its shareholders by penalizing them for a share allocation perhaps done decades or even a century ago. There is no science to the original allocation of co-op shares and the patterns are often fraught with inconsistencies. For example, the perception of value for a certain exposure in the building may be different today than it was in 1927. A buyer doesn’t look at a per share valuation in a building as market value for guidance – they never have. They look at competing properties in the market surrounding the property. Incidentally all of those co-ops with competing listings likely had different rationale for their respective allocations when they were built or converted.

  4. Investor value can be mistaken for market value. In the case of the co-op board judging an adequate sales price based on the price per share within the building is known as investor value. It is the value to them, not the value to the market. This is why sellers can be so disconnected from the market when setting their asking price. A seller might think that a purple formica entertainment center in the living is worth another $50 thousand to a buyer when the buyer is thinking it is worth minus $2 thousand for the cost to remove it. Co-op boards are responsible to protect the interests of their shareholders but they can confuse that with market value.

A few definitions of Fair Market Value

IRS: “The fair market value is the price at which the property would change hands between a willing buyer and a willing seller, neither being under any compulsion to buy or to sell and both having reasonable knowledge of relevant facts.”

Investopedia: “Fair market value is the price that a given property or asset would fetch in the marketplace, subject to the following conditions:
1. Prospective buyers and sellers are reasonably knowledgeable about the asset; they are behaving in their own best interests and are free of undue pressure to trade.
2. A reasonable time period is given for the transaction to be completed.
Given these conditions, an asset’s fair market value should represent an accurate valuation or assessment of its worth.”

Merriam-Webster: “a price at which buyers and sellers with a reasonable knowledge of pertinent facts and not acting under any compulsion are willing to do business”

Tags: , , ,


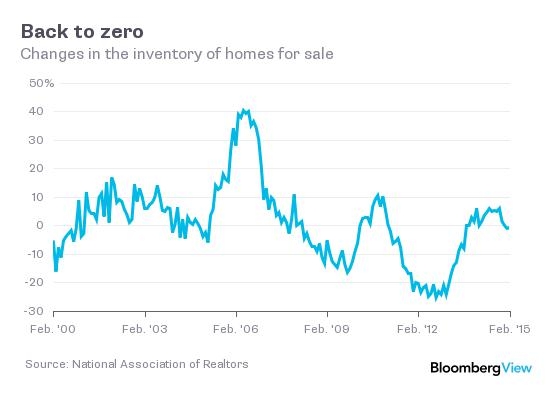
Bloomberg View Column: Want a New House? Good Luck

April 26, 2015 | 12:04 pm | | Charts |

BVlogo

Read my latest Bloomberg View column Want a New House? Good Luck.

inventory chart

Here’s an excerpt…

Much of the analysis of the housing market focuses on sales volume and price trends. These are important metrics, of course, but they really don’t tell you much about market fundamentals because they are, to a great extent, derivative…

[read more]


My Bloomberg View Column Directory

My Bloomberg View RSS feed.

Tags: , , ,


Bloomberg View Column: House Rich, Land Poor

April 26, 2015 | 11:41 am | | Charts |

BVlogo

Read my latest Bloomberg View column House Rich, Land Poor.

walkingclosets

landisyourland

Here’s an excerpt…

The living space in newly built U.S. homes is on a tear: Since 1982, the size of a new single-family house has increased by almost 1,000 square feet — which was the size of the average U.S. house in 1950…

[read more]

The trend continued after a brief interruption during the early days of the financial crisis…


My Bloomberg View Column Directory

My Bloomberg View RSS feed.

Tags: , , , , ,


[Three Cents Worth #272 NY] The Cost Of Your Doorman Keeps Rising

November 29, 2014 | 8:30 pm | | Columns |

It’s time to share my Three Cents Worth (3CW) on Curbed NY, at the intersection of neighborhood and real estate in the capital of the world…and I’m here to take measurements.

Check out my 3CW column on @CurbedNY:

Having that doorman just got more expensive. The difference between the average rental of a building with and without a doorman was at its widest point since we began to track this metric in 2007. The average rental price in a doorman building was $4,915, up 17.8 percent over the past 7 years and the highest recorded over this period. The average rental price in a non-doorman building was $3,461, up a more modest 5.8 percent over the same period. The difference between the two rental types resulted in an eight-year high of $1,645 per month…

3cw11-18-14
[click to expand chart]


My latest Three Cents Worth column on Curbed: The Cost Of Your Doorman Keeps Rising [Curbed]

Three Cents Worth Archive Curbed NY
Three Cents Worth Archive Curbed DC
Three Cents Worth Archive Curbed Miami
Three Cents Worth Archive Curbed Hamptons

Tags: , , ,


[Three Cents Worth #270 NY] What Is the Value of a Central Park View?

October 30, 2014 | 8:50 pm | | Columns |

It’s time to share my Three Cents Worth (3CW) on Curbed NY, at the intersection of neighborhood and real estate in the capital of the world…and I’m here to take measurements.

Check out my 3CW column on @CurbedNY:

While there is an obsession with views in the Manhattan market and it is one of the drivers of the tall tower phenomenon, there are a bunch of moving parts associated with it. We looked at the last two years of closed sales (to get enough data) on the four borders of Central Park, comparing the average price per square foot of co-op and condo apartments with direct views of the park—including both those above and below the treeline—and those with city views.

These results, shown in the infographic below, reflect the difference between the view types —but it does not mean that a park view on Fifth Avenue is worth 75.6 percent more than a city view on Fifth Avenue… just because of the view. A key difference between the view types is that the apartments with park views tend to be larger. The average size of a Fifth Avenue sale with a direct park view was 83.2 percent bigger than an apartment without a park view. Manhattan Co-op/Condo Values With and Without Park Views So Manhattan apartment prices on a per square foot basis reflect a significant premium per square foot for larger continuous space. Back to my Fifth Avenue example, the 75.6 percent difference reflects a “double-dip”—park views are more expensive and sell for more per square footage, but they also tend to be larger and therefore sell for more per square foot. Still, it’s a lot more expensive to have a park view than not have a park view.

cpwviews


My latest Three Cents Worth column on Curbed: What Is the Value of a Central Park View? [Curbed]

Three Cents Worth Archive Curbed NY
Three Cents Worth Archive Curbed DC
Three Cents Worth Archive Curbed Miami
Three Cents Worth Archive Curbed Hamptons

Tags: , , , ,


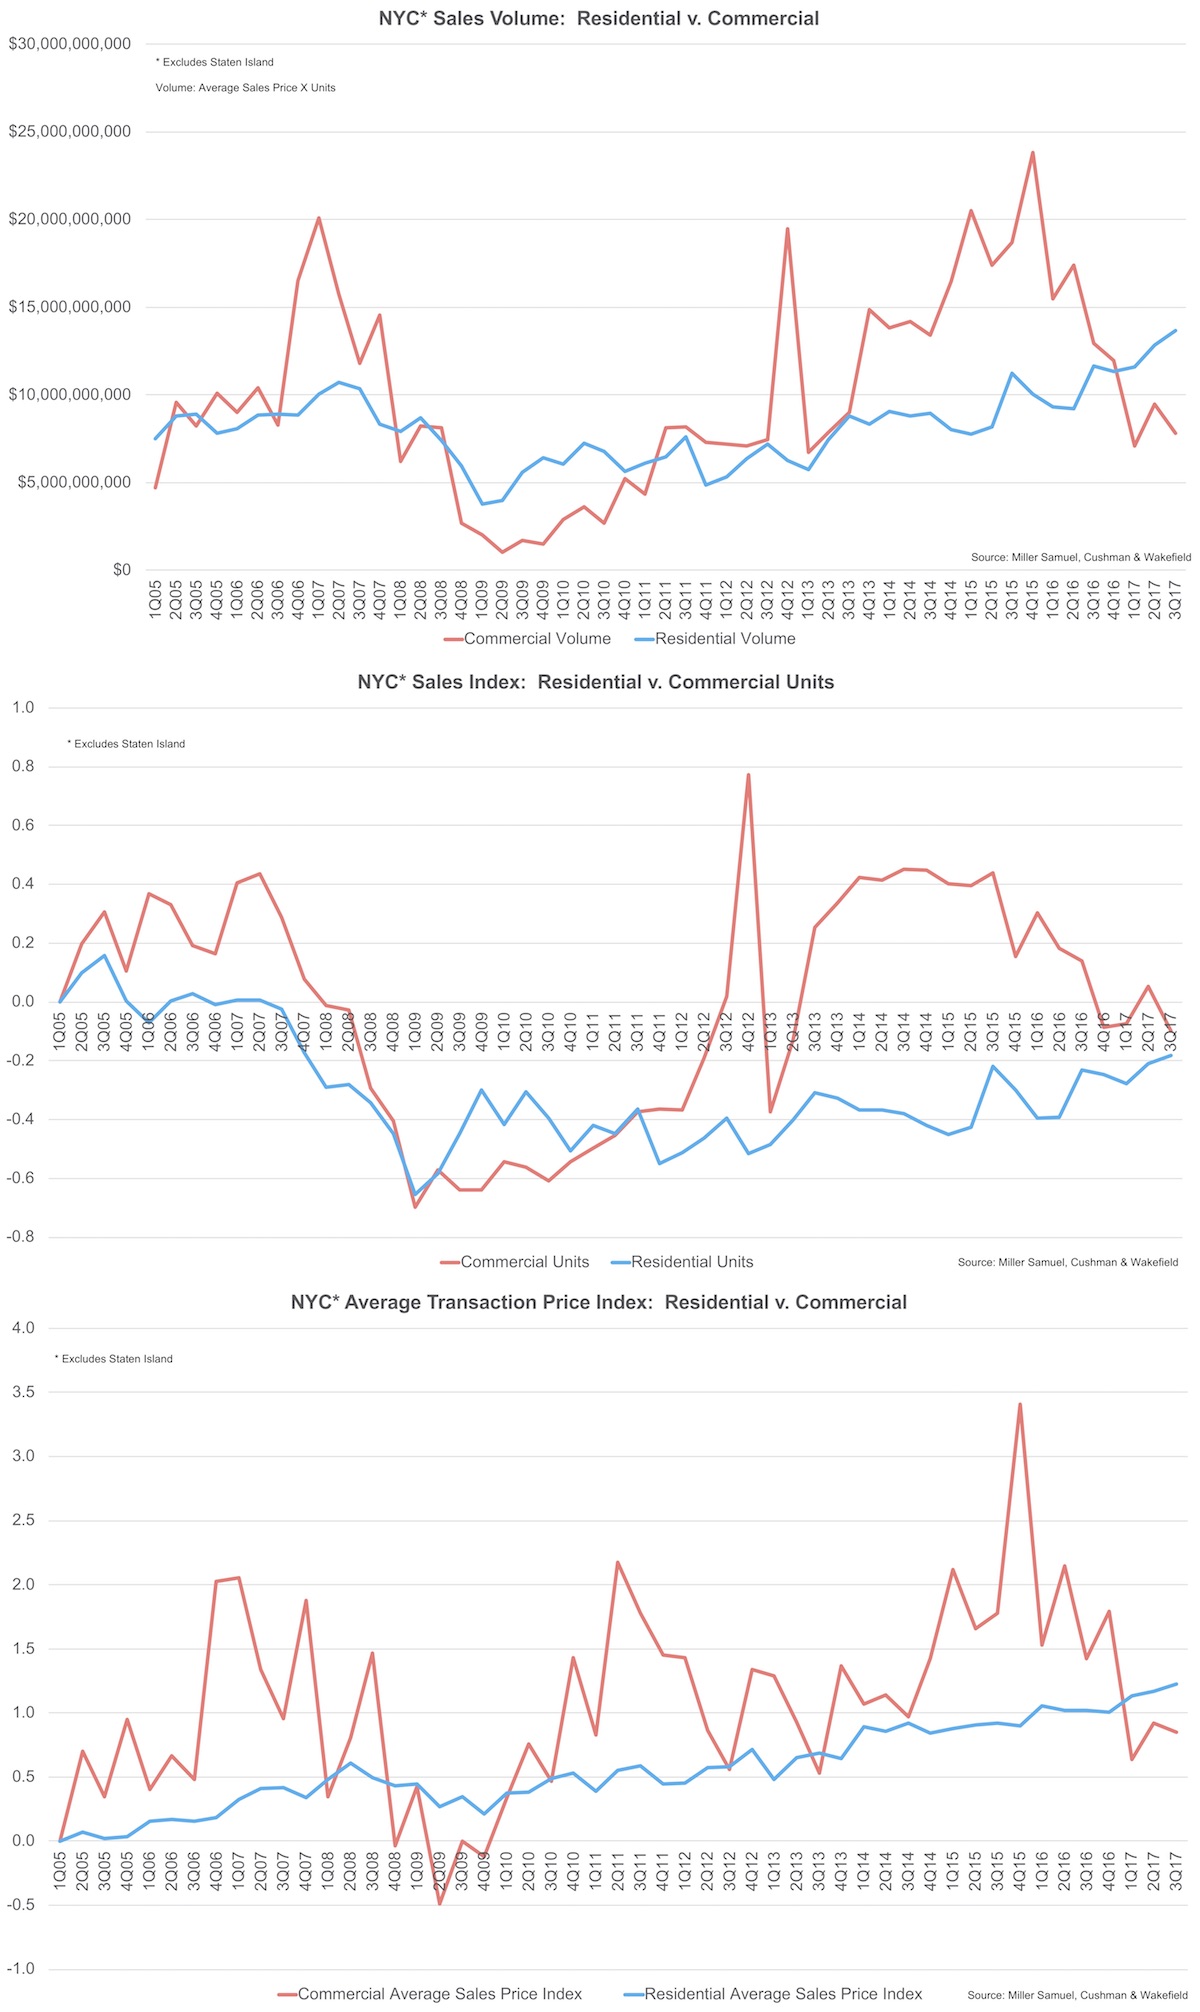
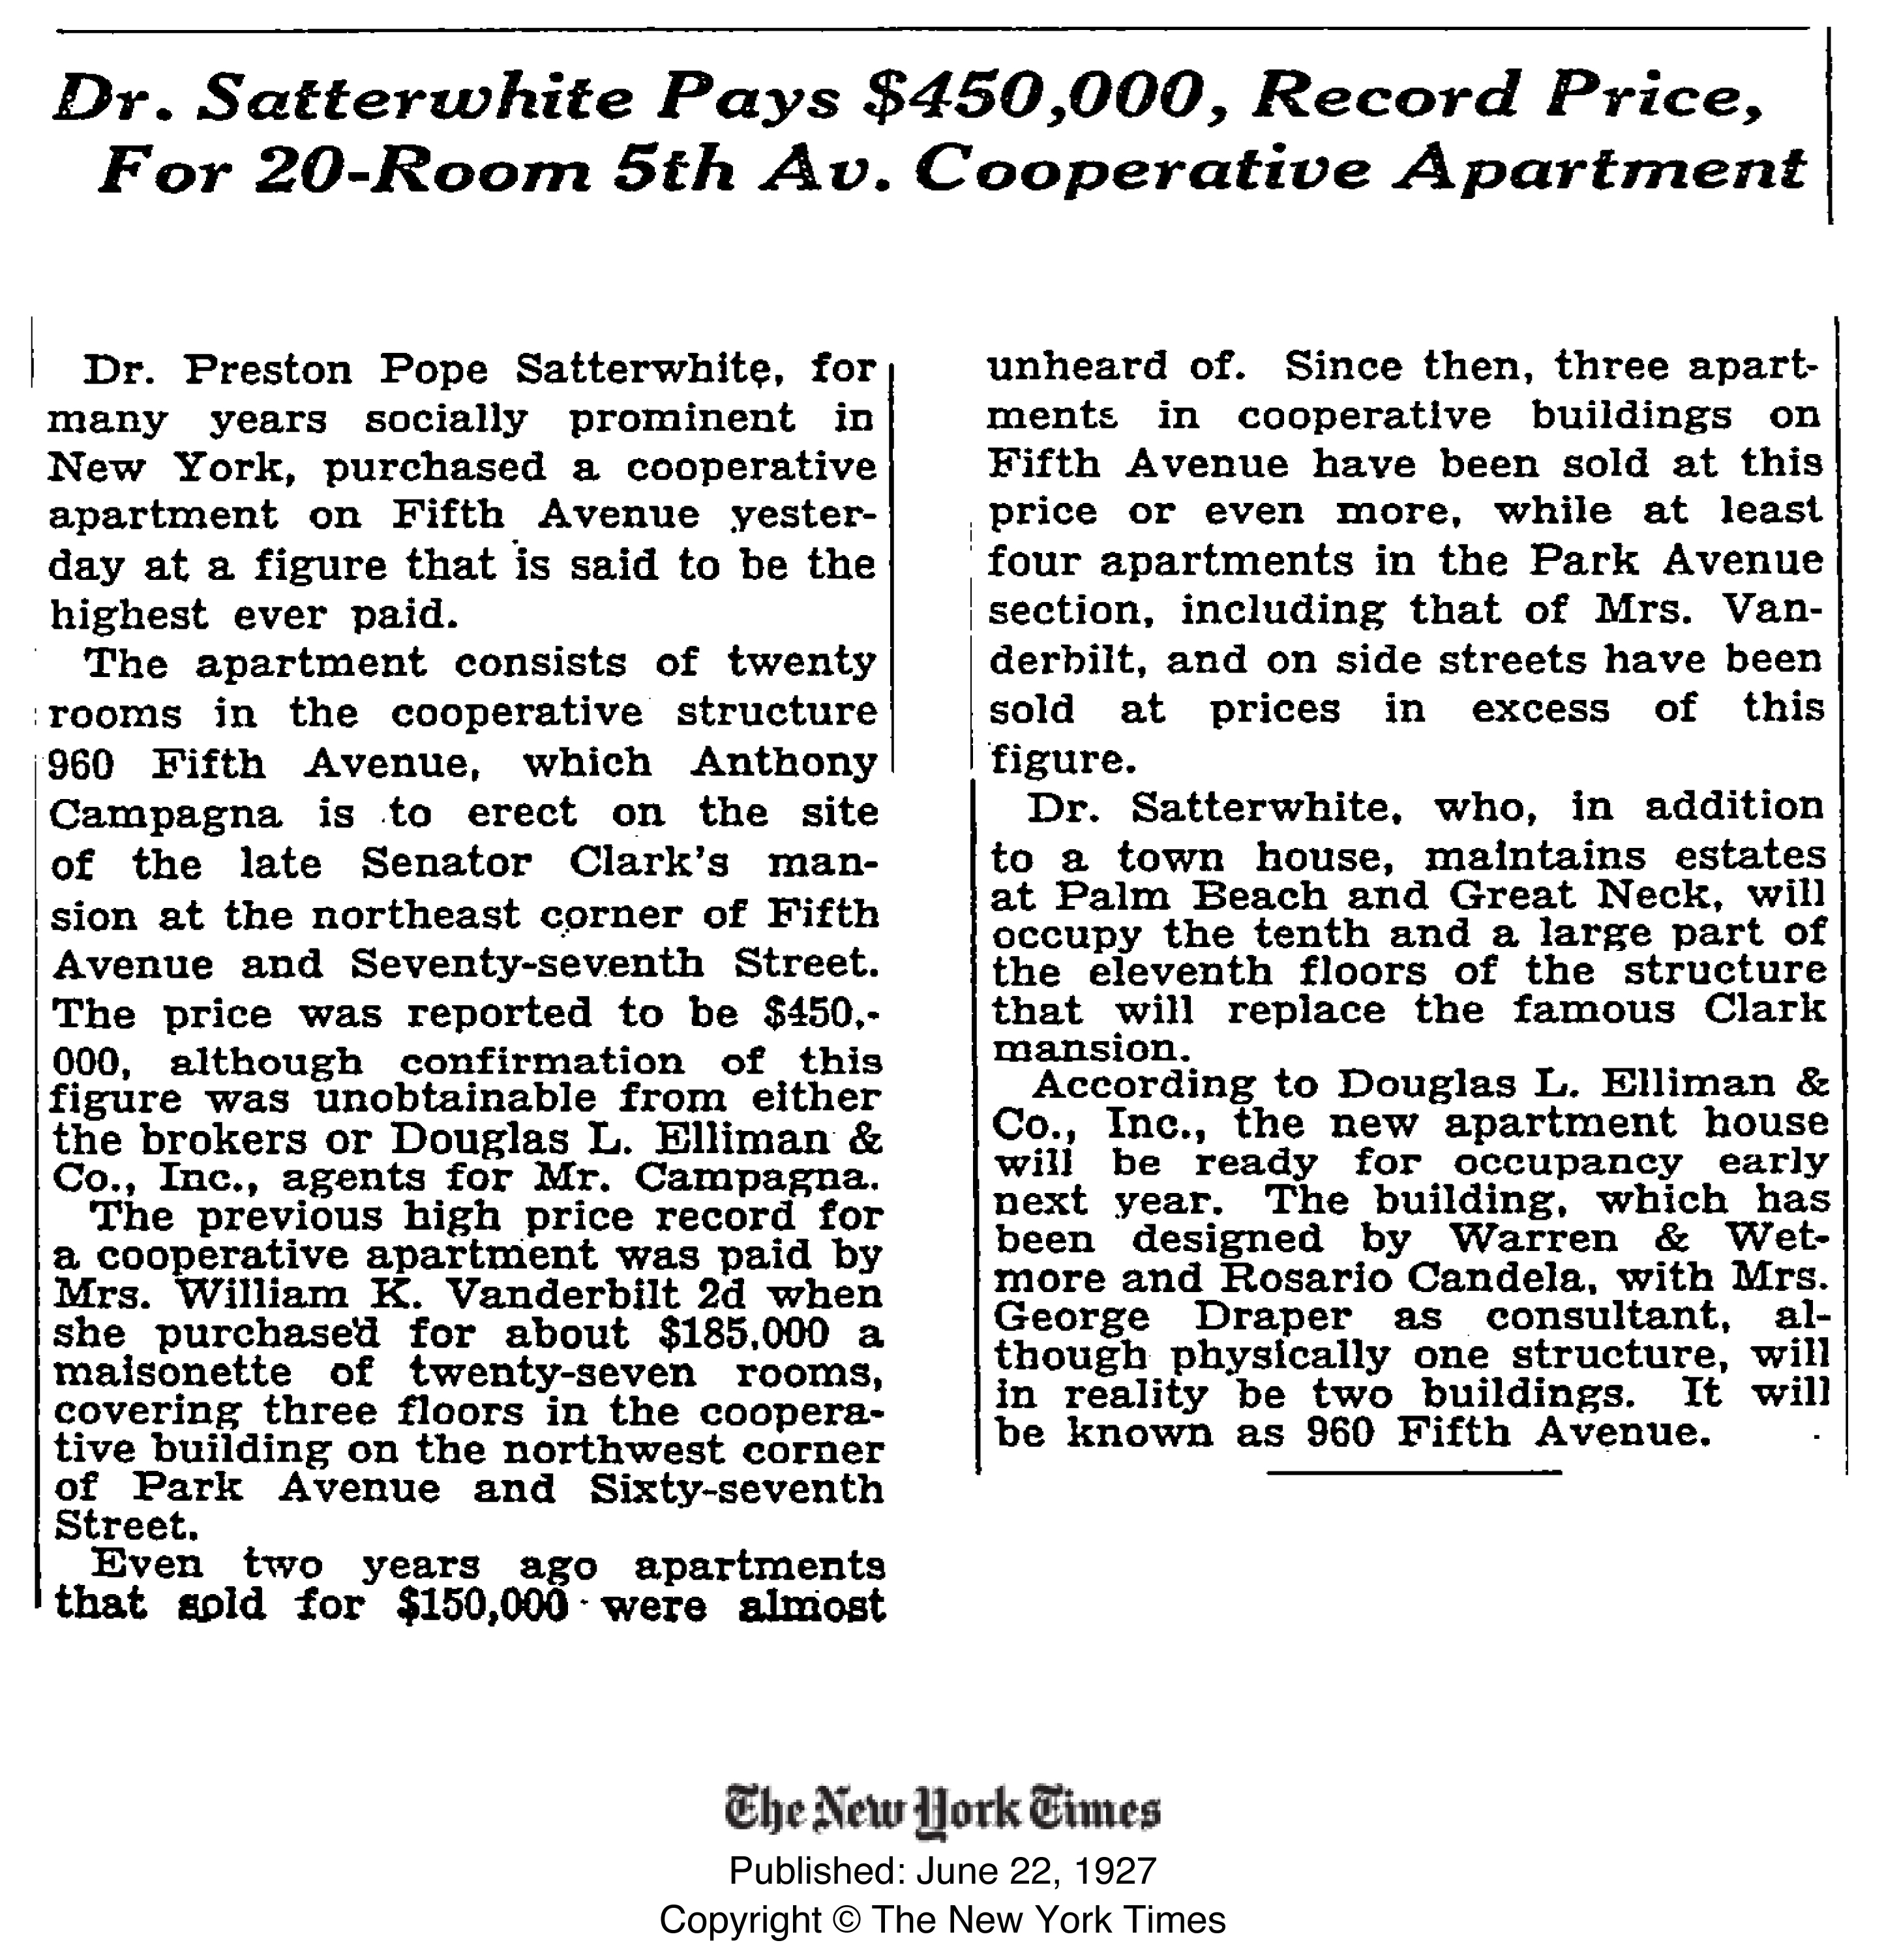
A Fifth Avenue Co-op’s 87-Year Price Increase was 3.6X Rate of Inflation

August 1, 2014 | 6:30 am | |

960fifth$450krecord-1927

[click to expand]

A few months ago there was a record $70M sale of a penthouse co-op sale at 960 Fifth Avenue.  The purchaser paid $5M over list price.

While doing some research I ran across an article in the New York Times archive that described a record Manhattan sale of $450,000 in the same building in 1927.  The apartment was located on the 10th and most of the 11th floor in the same building (aka 3 East 77th Street).

Based on the unit description, I believe this to be Apartment 10/11B which last sold for $21,000,000 on July 24, 2013.   Using the BLS calculator for CPI, a $450,000 sales price in 1927 adjusted for inflation to 2014 dollars would be $6,164,043 or an increase of 1,270%.

However the apartment sold for $21,000,000. an increase of 4,567% or 3.6 times the rate of inflation.

Tags: , , , , , , ,


…and the Home Seller will give you a Free Tesla!

July 12, 2014 | 7:26 pm | |

SodFarmtractor

Back when I was in college, a good friend of mine owned a large Michigan sod farm with his father – acres and acres of putting green quality sod. They wanted to upgrade their big tractor so I joined him on his visit to the local tractor dealership – International Harvester (my parents tell me I am a distant – really distant – relative of John Deere).

1979IHscout

[Source: Hemmings]

The tractor they were looking at included air conditioning and a surround sound stereo system. It was impressive. The salesman said that if they bought the tractor that month the dealership would throw in an International Harvester truck.

My friend’s comment to me under his breath was something along the lines of “looks like we are actually buying the truck too.”

Jhoanna Robeledo’s New York Magazine piece on the guy who throws in a Tesla if you buy his condo talks about this marketing technique.  Using a Tesla is buzz worthy as a well thought of brand – after all marketing is about getting eyeballs on the listing – but is it effective?  Does this technique actual sell properties?

In my view throwing in such a large concession is a red flag signifying the property is over priced enough to cover the seller’s cost of the “gift.”

Econ 101:  There is no such thing as a free lunch.

We’ve seen this marketing gimmick attempted with other cars such as a Prius, a Porsche, a Cadillac and Ferrari.

The funny thing is, you never read a follow-up article that shows how this marketing technique/gimmick was successful.

JohnDeereLM

A buyer for the condo in Jhoanna’s article would have the financial wherewithal to buy their own Tesla and likely isn’t thinking about buying a car during their visit to the property.

We don’t see these extreme marketing gimmicks tried with low margin properties. “If I buy this $75,000 condo I get a free Tesla!” Of course not – the condo seller in this “Tesla” story is telegraphing to a potential buyer the listing is over priced.

Yes, in a typical suburban transaction, a seller may throw in a used lawnmower to close the sale, but this is not something that is usually promoted during the actual marketing of the property.

NEWSFLASH Buyers are a lot smarter than this Tesla-giving away seller is giving them given credit for.

Tags: , , , , , , , ,


Cluttering Luxury Housing Markets with Listings Made for TV – Manhattan Edition

June 28, 2014 | 4:55 pm | |

wsjbpcphlistingterrace
[Source: WSJ]

A little over a week ago the WSJ’s Candace Taylor broke the story about 3 contiguous listings to be marketed together at the top of a 15-year old ground lease condo in Battery Park City for $118,500,000.  At 15,434 square feet, that works out to $7,678 per square foot.  CNBC’s Robert Frank provides more details in a video tour that was broadcast shortly after the story broke.

Normally I don’t bother to do the math on this sort of thing but after the Cityspire listing a while back, I thought I’d tweak my thinking a bit as the luxury market gets more than its fair share of confusing “milestones.”

Doing the Math
Here’s my listing price logic using content in the near viral news coverage of the record Battery Park City listing – I break down the 3 units:

$56,500,000 ($7,406/sqft) listing – 7,628 sqft 5-bed listed last year for 5 days and removed.

$11,700,000 ($3,330/sqft) purchase – 3,513 3-bed in April 2014.

$19,000,000 ($4,425/sqft) listing – 4,293 sqft 4-bed $23M January listing dropped to $19M, then removed.

$87,200,000 is the aggregate total for the 3 units that total 15,434 square feet ($5,640/sqft). The current list price of $118,500,000 represents a $31,300,000 premium for the combination of all 3 units before we might assume the millions in renovations to combine if you believe that the $87,200,000 total is what aggregate of the individual properties are worth.

Given the $3,330 ppsf recent sales price of the 3-bed and the unable to be sold for $4,293 ppsf after 6 months on market 4-bed and the not-market tested 5 day listing period 5-bed at $7,406, I can’t figure out how the listing agent gets to $7,678 ppsf as an asking price for all 3 together before the cost of renovation to combine? Perhaps the seller set the price.

The listing broker tells us that the pricing “is justified by the square footage“, as well as the views and building’s amenities.”

Got it.

Tags: , , , , , ,

Get Weekly Insights and Research

Housing Notes by Jonathan Miller

Receive Jonathan Miller's 'Housing Notes' and get regular market insights, the market report series for Douglas Elliman Real Estate as well as interviews, columns, blog posts and other content.

Follow Jonathan on Twitter

#Housing analyst, #realestate, #appraiser, podcaster/blogger, non-economist, Miller Samuel CEO, family man, maker of snow and lobster fisherman (order varies)
NYC CT Hamptons DC Miami LA Aspen
millersamuel.com/housing-notes
Joined October 2007