This title is way too wonky but I found it hard to pare down. It’s easier to explain visually.

When I complete my research for Douglas Elliman in a particular housing market and the percent change in the overall median sales price doesn’t fall within the individual submarkets like averages do, I periodically receive inquiries from media outlets or real estate professionals to clarify. Many people see median sales price much like they see average sales price: proportional.

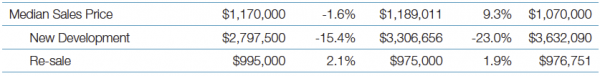
In this case, the median sales price change for resale to new development ranged from -23% to +1.9% yet the overall median increased 9.3…clearly outside of the range both submarkets established.


So I whipped up the following infographic with sample sales transactions and applied median and average sales price to illustrate how median sales price percent change for the overall market might not always fall within the individual submarket percent price changes. However, in an “average” analysis, the overall result will always fall within the range of the submarkets.

I hope the following color-coded breakdown below helps illustrate this clearly – be sure to click on the image once to expand or a second time for the extra large version.


[click to expand]

Tags: ,


2 Responses to “Explainer: Overall Median Sales Price Submarket Changes May Not Fall In Range”

  1. Bob says:

    You did a great job of illustrating how analysis of central tendency using median and average can be used to skew perception, depending on which gets reported. However, more granular analysis of say price per square feet may reveal entirely different perception. Your example assumes that each submarket represents the same size, which may or may not be the case. It could be a flat market if each submarket sale represented the same $/SF. Or even another type of market trend if size did or did not correlate with price. Thanks for taking time to draw light on the complexities of determining market trajectory. Keeping it Simple may yield Stupid results, too.

    • Jonathan Miller says:

      Thanks, Bob. Appreciate you taking the time to respond. Here are a couple of points you missed in your suggestions: Average price per square foot will show the exact same issue as “average sales price” because it is also “average” (the two markets will bracket the overall market). And in my example, the two submarket sizes were definitely different. Resales were 63% of total sales (5 of 8) and new developments were 47% of total sales (3 of 8). I presented two different sizes intentionally to provide my point.