Matrix Blog

Historical, Landmark, Milestone

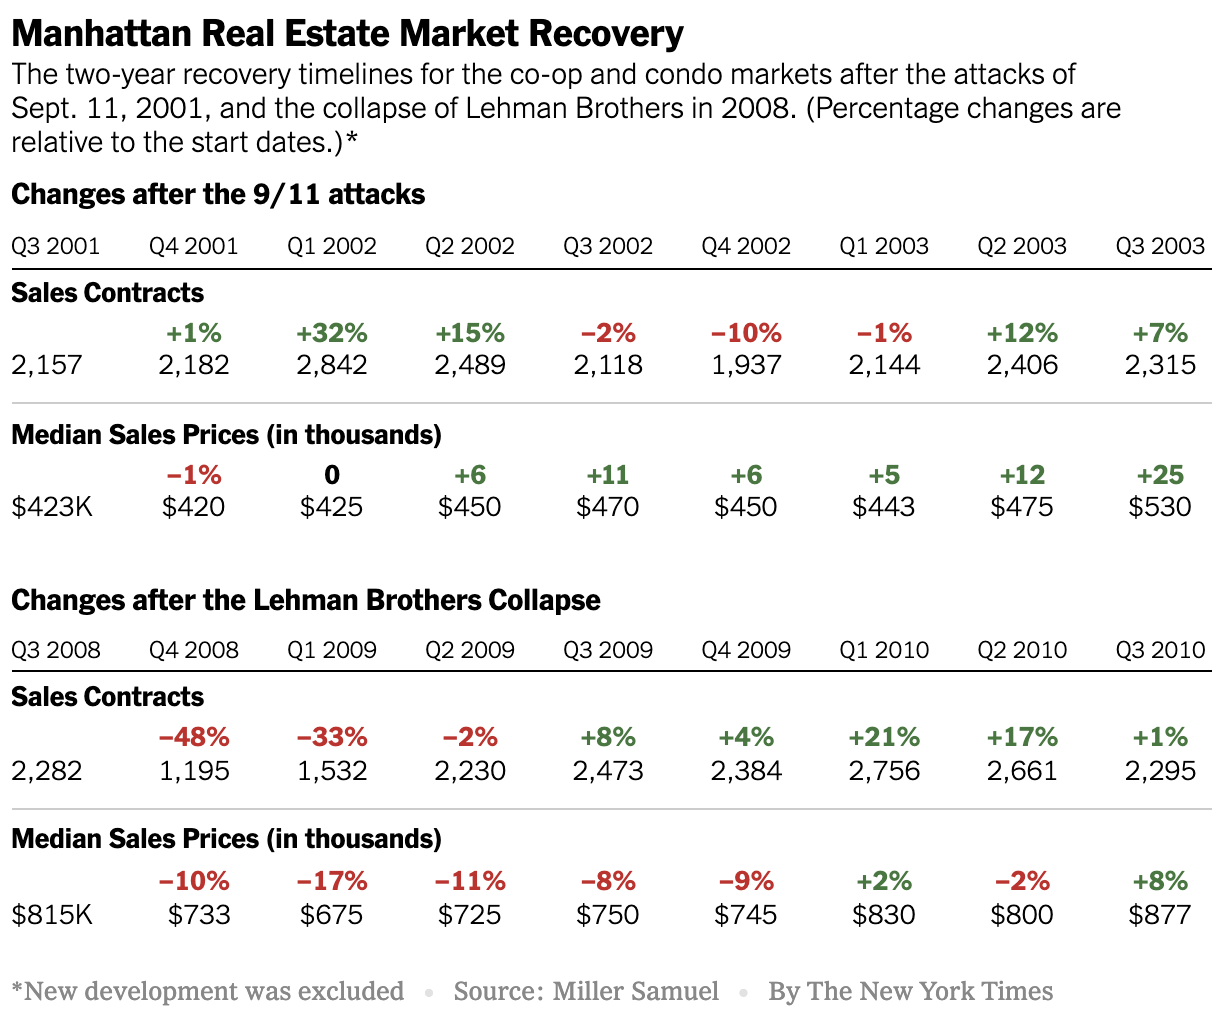
Manhattan Crisis: What Does Our Housing Past Tell Us About Our Housing Future?

May 7, 2020 | 1:02 pm | |

In this Sunday’s New York Times Real Estate Section (online now), the Calculator column featured some data trends I’ve gathered during two significant prior housing market events: What Can 9/11 and the Great Recession Tell Us About Coronavirus Recovery?

Tags: , , , , , , ,


Establishing the COVID-19 Demarcation Line: From ‘Hanks To Banks’

April 28, 2020 | 5:26 pm | Milestones |

This topic was explored in last Friday’s Housing Notes.

In order to understand what is happening now, we need to ween ourselves off of what happened before this crisis and focus on finding data exclusive to the post-COVID-19 era. In Manhattan, that data set is not yet apparent because we are in nearly a total market shut down but it is evident elsewhere to a limited degree. From my perspective, the demarcation line for the onset of the crisis is where market participants would have to be living in a cave on a desert island to be unaware of the sharp pivot in market sentiment.

March 15, 2020

I believe that date is March 15th which is the date of the Federal Reserve federal funds rate cut to zero and was their second cut in less than two weeks.

March 11, 2020

My friend and California appraiser Ryan Lundquist proclaimed March 11th which was the date Tom Hanks announced he and his wife had contracted COVID-19. Phil Crawford of Voice of Appraisal said the demarcation line was March 5, 2020 dubbing it “data point zero” and I had originally said the demarcation line was March 3, 2020, on the day of the 0.5% rate cut in March.

I was talking about this difference in these dates with a friend, Chicagoan, and RAC appraiser Michael Hobbs who brilliantly dubbed this four-day window from March 11 to March 15 as: “From Hanks To Banks.”

And if you do the math, the median and average date of March 11 and March 15 is literally Friday the 13th so what more confirmation of a demarcation line do you need?

Whatever your specific local demarcation line is, use it to keep the data for these two market periods separate.

Tags: , , ,


On Bloomberg TV: What’d You Miss? 10-5-2017

October 5, 2017 | 8:25 pm | | TV, Videos |

I had a fun conversation on Bloomberg Television with Scarlet Fu, Joe Weisenthal and Julia Chatterley. We were discussing the results of our research behind the Elliman Report: Manhattan Sales 3Q17 that was just released. Here is the Bloomberg story on the report results.

Here’s a portion of the interview.

If you’d like to see the whole segment, my interview starts at the 48:40 mark although I really like the format and the hosts so you might want to watch the whole show.

Tags: , ,


The NYC Downtown Resurgence After 9/11

September 11, 2017 | 9:40 am | | Milestones |

It’s hard to believe that it’s been 16 years already since 9/11. The name of the attack is now referenced as a noun and every year I think about the events of that day – getting emails from out of state friends and colleagues asking if I was ok, with one asking if I was still alive; Watching the second tower fall; walking to Fifth Avenue and then to Sixth Avenue to see the towers in flames; No cell service; losing all access to public transportation; literally walking northward out of Midtown with throngs of others; getting a lift from my friend’s mom to Westchester county, then borrowing the car to get home to my family in CT; Debriefing with my neighbors who were standing outside like everyone else trying to learn what happened; learning that a parent of my of my son’s classmates was in the tower; hearing stories from neighbors who were talking to someone on the phone in the towers when a plane hit and the line went dead.

It seemed that everything I knew was going away and never coming back. Yet NYC showed me it never quits and I’m proud to be part of it.

Here is my interview with Tom Keene on Bloomberg TV this morning on the resurgence of downtown over the past 16 years.


UPDATE Immediately following the television spot, I walked over to their radio studios and spoke with Tom again as well as David Gura. My interview with Tom Keene and David Gura on Bloomberg Surveillance Radio so click on the graphic below and go to the 10-minute spot:


Tags: , , , , , ,


Declaring A Housing Recovery Using A Threshold Based on Fraud

November 30, 2016 | 3:16 pm | Charts |

S&P CoreLogic used it’s National Non-Seasonally Adjusted Housing Price Index to declare that the housing market has recovered. Even the ironies of this public relations effort have ironies. I’ll explain.

First, look at this classic Case-Shiller chart. Notice how the arrows don’t connect to the lines they are associated? I’m being petty but it looks like the chart was updated and rushed out the door.

csiclassicchart11-2016

Incidentally, who controls the Case-Shiller Indices brand these days? It used to be “S&P/Case-Shiller Indices.” Here are a couple of variations found in the first paragraph of the press release:

  • S&P Dow Jones Indices
  • S&P CoreLogic Case-Shiller Indices

but I digress

Since the financial crisis, I have spent a good deal of time explaining away the reliability of the Case Shiller Index.

To be clear, I greatly admire Robert Shiller, the Nobel Laureate and his pioneering work in economics. I’ve had the pleasure of speaking with him on a number of occasions both publicly and privately. He and I were on stage together at Lincoln Center back during the housing bubble for a Real Deal event.

During the bubble I was the public face of a short lived Wall Street start-up that collapsed when the bubble burst. Like Case-Shiller it was built to enable the hedging of the housing market to mitigate risk using a different methodology, avoiding the repeat-sales method used in CS. The firm had annoyed Shiller by constantly citing the issues with the CS index and we got far more traction from Wall Street with our index that was (literally) built by rocket scientists. It got to the point where he mentioned me and the startup by name at a conference in frustration.

thhpodcastlogo

After I disconnected with the startup before it imploded, I reached out and we made up. In fact he did my Housing Helix podcast (link broken but hope to bring it back online soon for historical reference) at my office back when I was doing a podcast series of interviews with key people in housing). Also we’ve run into each other on the street in Manhattan a number of times. In fact when he learned of my love of sea kayaking he gave me the latitude and longitude coordinates of his island vacation home in case I was nearby. You can see that I feel a little guilty criticizing the use of the index since he is one of the nicest and smartest people I’ve ever had the honor to meet.

But I don’t like the way S&P, Dow Jones and/or CoreLogic have positioned Case-Shiller as a consumer benchmark. And especially yesterday’s announcement as a marker for the recovery of the U.S. housing market. I feel this is a low brow attempt by these institutions to leverage publicity without much thought applied to what is actually being said. Here are some thoughts on why it is inappropriate to use this moment as a marker for the housing recovery.

“The new peak set by the S&P Case-Shiller CoreLogic National Index will be seen as marking a shift from the housing recovery to the hoped-for start of a new advance” says David M. Blitzer, Managing Director and Chairman of the Index Committee at S&P Dow Jones Indices.

Blitzer remains in the very awkward position of explain away the gap between the market 6 months ago and current condition as if there is no difference. He does this by using anecdotal commentary about metrics like supply that has nothing to do with the price index as well as making pithy remarks.

  • The Case-Shiller National Index is being touted for reaching the record set in the housing bubble a decade ago despite the record being set back then by artificial aka systemic mortgage fraud. However their 20 city index has been pushed as the key housing benchmark for more than a decade, not the national index. And they are using the non-seasonally adjusted national index to proclaim the record beaten despite their long time preference of presenting seasonally adjusted indices (the seasonally adjusted national index has not broken the housing bubble record yet).

  • The credit bubble got us to the 2006 peak, not anything fundamental.

cshpitablefrompeak11-2016

  • In my thirty years of valuation experience, I have learned that sales transactions, not prices, should be the benchmark for a housing market’s health.

  • The 0% markets that reached the 2006 peak are super frothy – created by rapidly expanding economies and an inelastic housing supply. Income growth doesn’t always justify their price growth. Click on table below for the markets shaded in turquoise.

csnsazero

Some important background points on the Case Shiller Home Price Index (CS) – that most of its users are unaware of:

  • CS was never intended for consumer use! It was built for Wall Street to trade derivatives to hedge housing market risk much like hedging risk for weather, insurance, non-fat dry milk and cheddar cheese.

  • CS never caught on because housing is a slow and lumbering asset class, unlike a stock which has much more liquidity. The flaw during this bubble period was the way Wall Street and most real estate market participants considered housing as liquid as a stock and how financial engineering had enabled that liquidity.

  • As access to public housing data has become more ubiquitous, the index has been more easily gamed by companies like Zillow, who have been able to accurately predict the index results much sooner rendering the index as useless for hedging.

  • CS lags the actual “meeting of the minds” between by buyers and sellers – when they agree on the price and general terms – by 5-7 months. The November report just released was based on the 3 month moving average of closed sales from July, August and September. If we say that contract to close period is an average of 60 days, then the contracts signed in this batch of data represent May, June and July. And the time between the “meeting of the minds” and the signed contracts can be a couple of weeks, so the results in yesterday’s lease of the Case-Shiller index represents the period around Memorial Day weekend as summer was getting started.

  • CS only represents single family homes (although they have an index for condos).

  • CS excludes new development.

  • There is little if any seasonality in the CS methodology (even though there is a seasonally adjusted version).

  • Geographic areas in the 10 and 20 city CS indices are incredibly broad. For example, the “New York” index includes New York City, Long Island, Hamptons, Fairfield County, Westchester County, a bunch of counties in northern NJ and a county in Pennsylvania. Yet this index is often represented as a proxy for the Manhattan housing market by national news outlets. Manhattan residential sales have about a 1% market share of single family homes.

In other words, the CS index is a great academic tool to trend single family home prices at a 30,000 foot view for research but not to measure the current state of your local market.

Tags: , , , , ,


Housing and the Election Aftermath

November 9, 2016 | 9:56 pm | Milestones |

With any significant unexpected and historic event, the initial impact to housing can be seen in the form of a “pause” until buyers have enough time to process it. I first wrote about my “milestone” theory more than a decade ago. There was a New York Times cover story a month after Lehman collapsed in 2008 that used our data to mark such a milestone. A “pause” can be measured in days or months and market reaction can ultimately go against conventional wisdom.

Back in August of 2011, after S&P downgraded U.S. debt ratings, it was thought to be catastrophic to the U.S. economy yet the world’s investors flooded into U.S. treasuries for safety, pushing interest rates to the floor, ultimately giving a boost to housing.

I may not know much, but I do believe this: potential changes in government social policies should be kept separate from potential changes in economic policies, otherwise it is impossible to take action on anything in your life. This probably includes making decisions about whether to buy or sell a home. This U.S. election campaign has been brutal and at this point we don’t know how much of what was said about social policy will be enacted. This uncertainty may keep some buyers on the sidelines longer than others, but otherwise I’m not sure any of that matters to the housing market. On the margin, I am hearing that a few buyers have placed their purchases on hold. This is a normal reaction after a significant historic event but eventually many of those participants wade back into the pool when they are more comfortable.

Stock futures were down significantly overnight but the financial markets moved higher after initially falling. With a quickly rebounding stock market, I’m don’t think home buyers will take very long to decide whether to rejoin the housing market.

2016electiondjiachart

In addition, the odds of a December interest rate increase by the Federal Reserve dropped sharply despite yesterday’s view of a rate hike as nearly a sure thing. The president elect’s economic platform, which was not widely discussed during the campaign, proposes a large tax cut and investment in infrastructure which are either favorable or neutral to the housing market.

bbcmefutureselectionday

Before the election, the housing market was generally softest at the top over the 18 U.S. markets we cover. I believe inventory will continue to be more readily available at the higher end than for other segments. In New York, the slow down in sales was assumed to caused by the pull back of foreign buyers. However this decline was equally matched by domestic buyers over the same period, so the foreign buyer decline has been a false narrative. The sales share of international buyers has remained stable for for nearly 3 years. I am speaking at the The Real Deal conference in Shanghai next week and will look to understand sentiment towards further U.S. real estate investment.

3q16internationalshare

Rather than the international buyer narrative, I attribute the New York sales slow down to the visceral view of new residential towers rising from empty lots. Construction lending nearly dried up at the beginning of the year so the pipeline will slow quite a bit over the next two years.

With world economies generally falling or remaining weaker than the U.S. economy and the continuation of near record low interest rates, I don’t see much impact from the U.S. election results after the short term jitters pass.

Of course, I was wrong about the election.

Tags:


Miller Samuel turned 29 today

October 1, 2015 | 2:43 pm | Milestones |

MSIlogo

Hard to believe we’ve been around so long.

I personally feel about 29 years old (maturity of a 19 year old, obviously) yet after we published our Manhattan report today that cited 26 year record highs, the math places me a bit older than 29. My birthday was yesterday (I’m still milking that day for all I can) and our company’s birthday is today. We launched in 1986, working in our apartments and communicating via fax machines, buying Macintosh Plus computers, creating our own appraisal software, using bar code scanners, Scantron readers, tape measures, measuring wheels, sonic measuring devices, laser measuring devices and beepers. It’s been a surprisingly fun but difficult journey.


[Three Cents Worth #287 NY] Tracking New York Rents and Asking Prices Over a Century

June 3, 2015 | 6:04 pm | | Charts |

It’s time to share my Three Cents Worth (3CW) on Curbed NY, at the intersection of neighborhood and real estate in the capital of the world…and I’m here to take measurements.

Check out my 3CW column on @CurbedNY:

Back in 2011, I embarked on a fun research project for Douglas Elliman’s 100th anniversary, in which I traced how sales prices and rents changed since the 1910s. I explain in detail how I did the research here, but I ended up with a very loose proxy to represent price per square foot for sales and average monthly rents during each decade…

2015-6-1curbed

Here are some other ways to view the 100 year trend based on feedback from readers.

2015-6-1curbedDoD

2015-6-1curbedCPIDoD

2015-6-1curbedCPI

[click to expand charts]


My latest Three Cents Worth column: Three Cents Worth: Tracking New York Rents and Asking Prices Over a Century [Curbed]

Three Cents Worth Archive Curbed NY

Three Cents Worth Archive Curbed DC

Three Cents Worth Archive Curbed Miami

Three Cents Worth Archive Curbed Hamptons

Three Cents Worth Archive Curbed LA

Three Cents Worth Archive Curbed Ski

Tags: , , , , , ,


[Three Cents Worth #276 NY] Proving New York’s Blockbuster $100M Sale Is An Outlier

January 22, 2015 | 1:08 pm | | Charts |

It’s time to share my Three Cents Worth (3CW) on Curbed NY, at the intersection of neighborhood and real estate in the capital of the world…and I’m here to take measurements.

Check out my 3CW column on @CurbedNY:

Finally, after nearly two years of referring to the $88 million sale at 15 Central Park West as the “highest Manhattan residential sale on record,” we get a change of scenery. A new record was set with the $100.47 million sale of the penthouse at One57 recorded late last week. Timing is everything, although, in this case timing really wasn’t. I believe this sale went to contract in 2012, which would be shortly after the $88 million sale went to contract in December 2011 and closed in early 2012. While these super luxury sales are more of a circus sideshow and have little, if anything, to do with the vast majority of the Manhattan housing market, I find them surreal to consider…


3cw1-21-15-short
[click to expand chart]


My latest Three Cents Worth column on Curbed: Three Cents Worth: Proving New York’s Blockbuster $100M Sale Is An Outlier [Curbed]

Three Cents Worth Archive Curbed NY
Three Cents Worth Archive Curbed DC
Three Cents Worth Archive Curbed Miami
Three Cents Worth Archive Curbed Hamptons

Tags: , ,


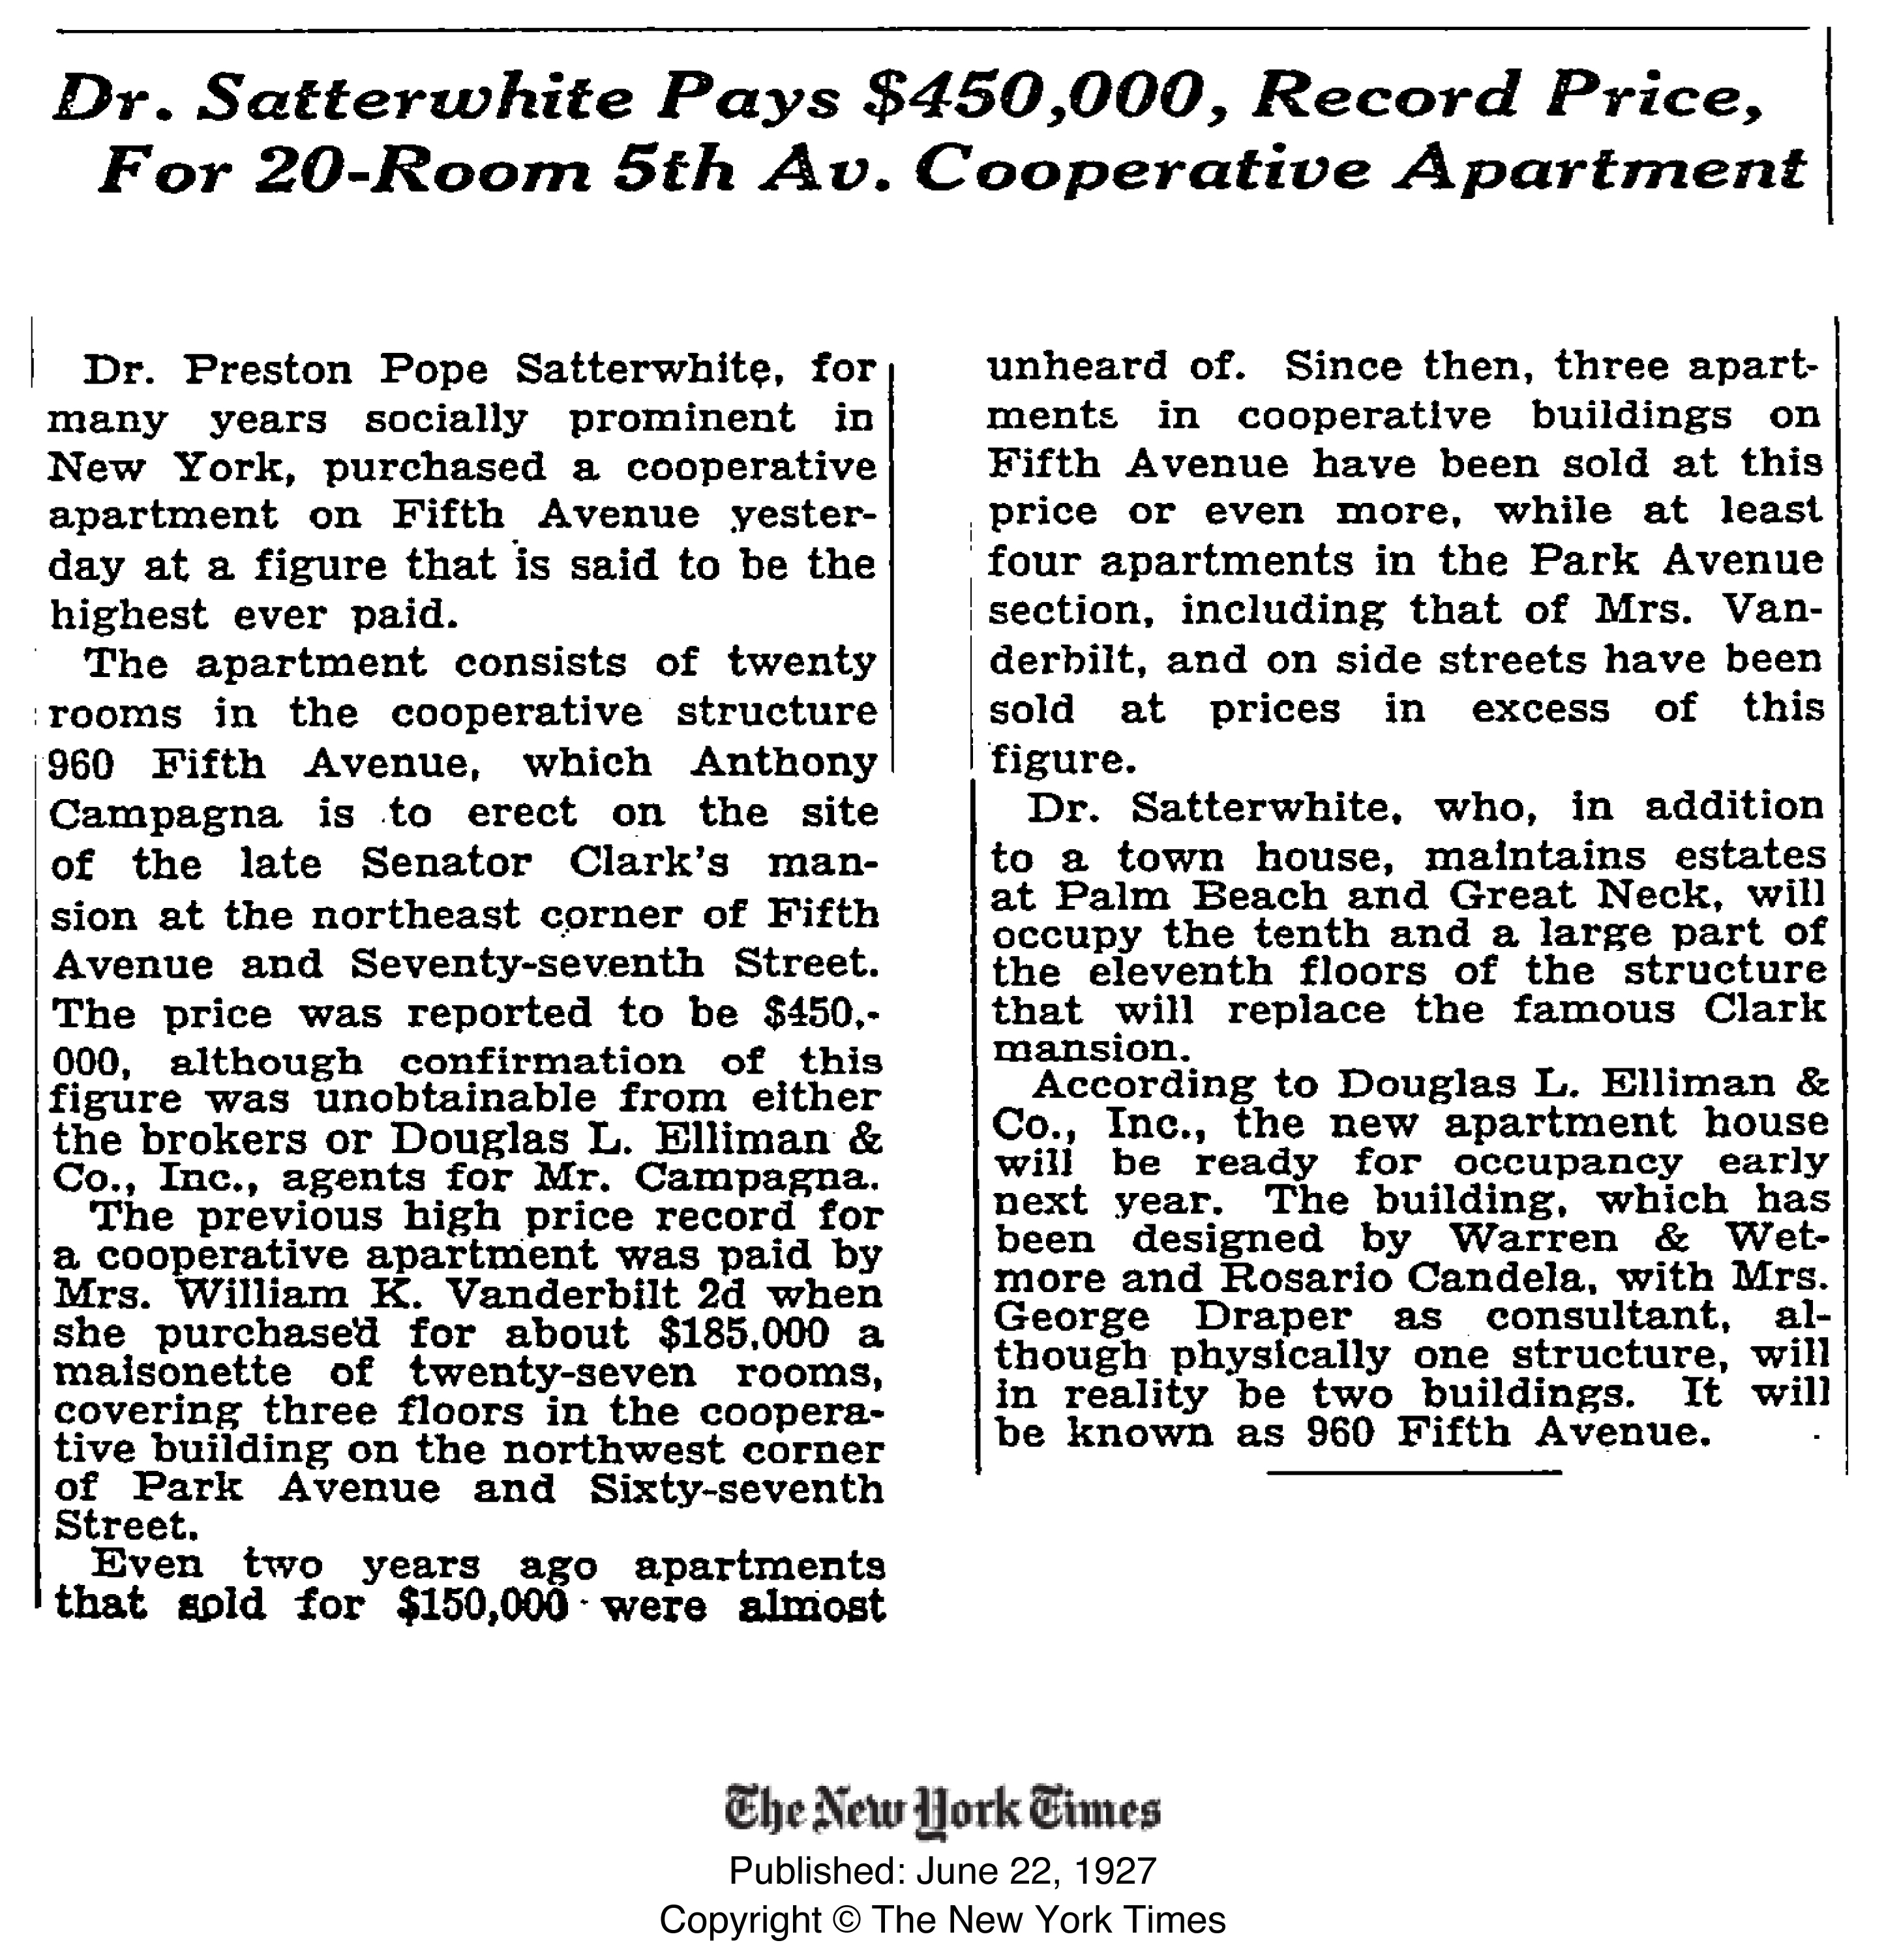
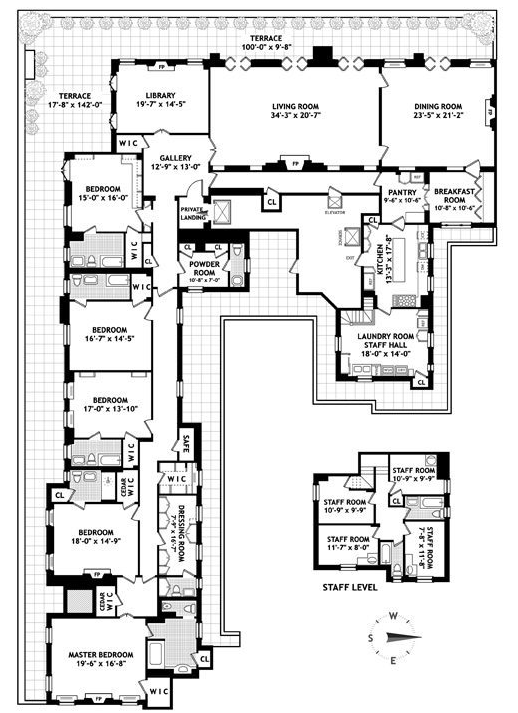
A Fifth Avenue Co-op’s 87-Year Price Increase was 3.6X Rate of Inflation

August 1, 2014 | 6:30 am | |

960fifth$450krecord-1927

[click to expand]

A few months ago there was a record $70M sale of a penthouse co-op sale at 960 Fifth Avenue.  The purchaser paid $5M over list price.

While doing some research I ran across an article in the New York Times archive that described a record Manhattan sale of $450,000 in the same building in 1927.  The apartment was located on the 10th and most of the 11th floor in the same building (aka 3 East 77th Street).

Based on the unit description, I believe this to be Apartment 10/11B which last sold for $21,000,000 on July 24, 2013.   Using the BLS calculator for CPI, a $450,000 sales price in 1927 adjusted for inflation to 2014 dollars would be $6,164,043 or an increase of 1,270%.

However the apartment sold for $21,000,000. an increase of 4,567% or 3.6 times the rate of inflation.

Tags: , , , , , , ,


Manhattan Penthouse Co-op Sold For 2nd Highest PPSF in History

June 9, 2014 | 2:57 pm | Milestones |

960fifthFP

Real estate reporter Katherine Clark at the New York Daily News got the scoop on the $70,000,000 penthouse sale at 960 Fifth Avenue, the highest price ever paid for a Manhattan co-op apartment. Curbed New York lays out all the (pretty?) pictures.

The previous record was held by David Geffen, who paid $54,000,000 in 2012 for the Penthouse at 785 Fifth Avenue. Although the Geffen penthouse was renovated, it was 12,000 square feet, more than twice as large as the 5,500 square feet within the penthouse at 960 Fifth Avenue – that just sold for a record price of $70M.

To further illustrate how much more expensive this new record price actually is, take a look at the two highest Manhattan co-op sales prices achieved, but on a price per square foot basis:

David Geffen paid $4,500 psf for the penthouse at 785 Fifth Avenue for the then record price of $54,000,000.

Nassef Sawiris paid $12,727 psf for the penthouse at 960 Fifth Avenue for the new record price of $70,000,000. On a sales price basis, the new record is 29.6% higher than the old record of 2 years ago.

On a price per square foot basis, the record sale was 182.8% above the previous record sale price set two years ago.

With all the attention focused on the newish or new development residential condo market, the all-time price per square foot apartment record was set 2 years ago, around the time of the Geffen purchase.  A Russian oligarch paid $88,000,000 for Sandy Weill’s penthouse condo that works out to $13,049 per square foot. That record breaking sale was largely viewed as a market outlier, that the buyer overpaid as part of a larger divorce strategy – since it was 31% higher than the previous record in the year prior within the same building.

Some other oddities about this new record co-op sale at 960 Fifth Avenue:

  • The 960 Fifth Avenue co-op board is old world and I’ve heard it is fairly tough. As a general statement, it is not that common to see a foreign buyer at the high end of the market approved by a co-op board.
  • The news coverage suggested the buyer was slow to pay his taxes and negotiated a reduced amount with the government. This would be a concern for most co-op boards in terms of collecting maintenance charges in arrears from a foreign national if they stopped paying.

Since these conditions would probably make any high end co-op board nervous, perhaps this is a sign that shareholders (board members are also shareholders) are concerned about damaging potential property values by limiting the universe of people that would be able to afford these types of prices in this new market condition.

Tags: , , , , , , ,


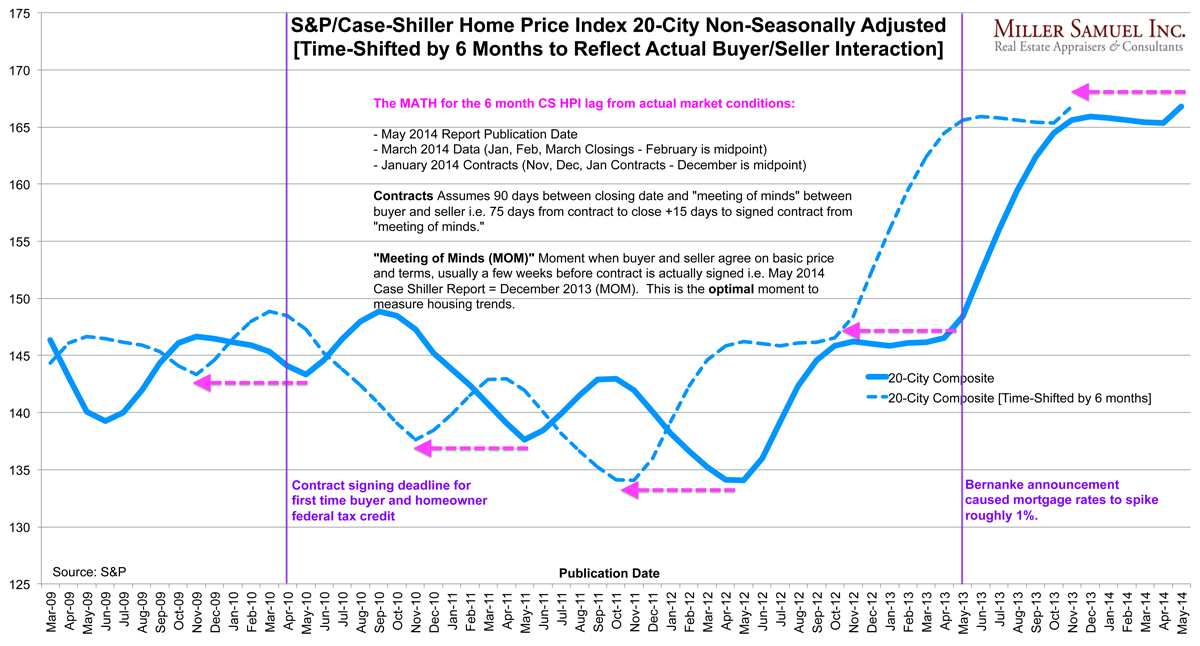
Pulling the Case-Shiller Index Back by 6 Months to Reflect Actual Buyer/Seller Behavior

May 27, 2014 | 10:45 pm | Charts |

matrixCSIshift-5-27-14
[click to expand]

The Case Shiller Index was released today and it continued to confuse consumers, pundits, economists etc…and for good reason. It’s 6 months late.

I wondered what would happen if their index result was pulled back by 6 months to see how it lined up with a couple of significant housing milestones (purple vertical lines). The most recent housing milestone was last year’s Bernanke speech that resulted in the spike in mortgage rates in May-June of 2013.

In the modified trend line (dotted blue) housing prices surge up until mortgage rates spike. This is clearly more logical than the actual index showing housing prices surging for six months after the mortgage rate spike.

In the earlier milestone in April 2010, the adjusted index (dotted blue line) immediately begins to slide after the April 2010 signed contract deadline passed to qualify for the federal homeowner tax credit as part of the stimulus plan. Yes, that’s exactly what happened on the front lines.

I’m going to call this new methodology “time-shifting a housing index.” From an historical perspective, this is a much more useful and reliable trend line. For the near term, it places the CS HP 6 months behind the market without any relevance to current conditions. Then again, the S&P/Case Shiller Home Price Index was never meant to be a monthly housing indicator for consumers as it is currently used by the media. It was originally created to enable Wall Street to hedge housing but never caught on because of the long time lag and therefore the eventual ability of investors to accurately predict the results.


The top chart is fairly self-explanatory but here’s the math again:

  • May 2014 Report Publication Date
  • March 2014 Data (Jan, Feb, March Closings – February is midpoint)
  • January 2014 Contracts (Nov, Dec, Jan Contracts – December is midpoint)

Contracts Assumes 90 days between closing date and “meeting of minds” between buyer and seller i.e. 75 days from contract to close +15 days to signed contract from “meeting of minds.”

“Meeting of Minds” Moment when buyer and seller agree on basic price and terms, usually a few weeks before contract is actually signed i.e. May 2014 Case Shiller Report = December 2013. The optimal moment to measure housing.

Here’s a regular chart that has a longer timeline, with and without seasonal adjustments (you can see that seasonal adjustments are essentially meaningless.)

matrixCSI-5-27-14

Tags: , , ,

Get Weekly Insights and Research

Housing Notes by Jonathan Miller

Receive Jonathan Miller's 'Housing Notes' and get regular market insights, the market report series for Douglas Elliman Real Estate as well as interviews, columns, blog posts and other content.

Follow Jonathan on Twitter

#Housing analyst, #realestate, #appraiser, podcaster/blogger, non-economist, Miller Samuel CEO, family man, maker of snow and lobster fisherman (order varies)
NYC CT Hamptons DC Miami LA Aspen
millersamuel.com/housing-notes
Joined October 2007