Matrix Blog

Historical, Landmark, Milestone

Documentary: The Coney Island Zipper, A Land Use Battle

May 25, 2014 | 9:12 pm |

coneyislandzipper
[click to view film on PBS until 4/1/17]

I saw the documentary: ZIPPER: CONEY ISLAND’S LAST WILD RIDE (here’s the trailer) over the weekend on the land use battle in Coney Island. I like the filmmakers’ focus on the guys that ran the “Zipper” (the ride is guaranteed to make me throw up) to humanize the development battle between NYC, Coney Island residents and the developer. Plus you can’t go wrong with a good Blue Oyster Cult song in the opening.

After watching the documentary (you can purchase or rent it here), you can’t help but see how difficult it is to develop property in NYC striking a balance between community needs with economic feasibility as well as navigate political power and government.

This difficulty is a key reason why residential housing costs are so high in most urban markets.

Still, a new ride in Coney Island was just opened – The Thunderbolt Roller Coaster.

Tags: , , ,


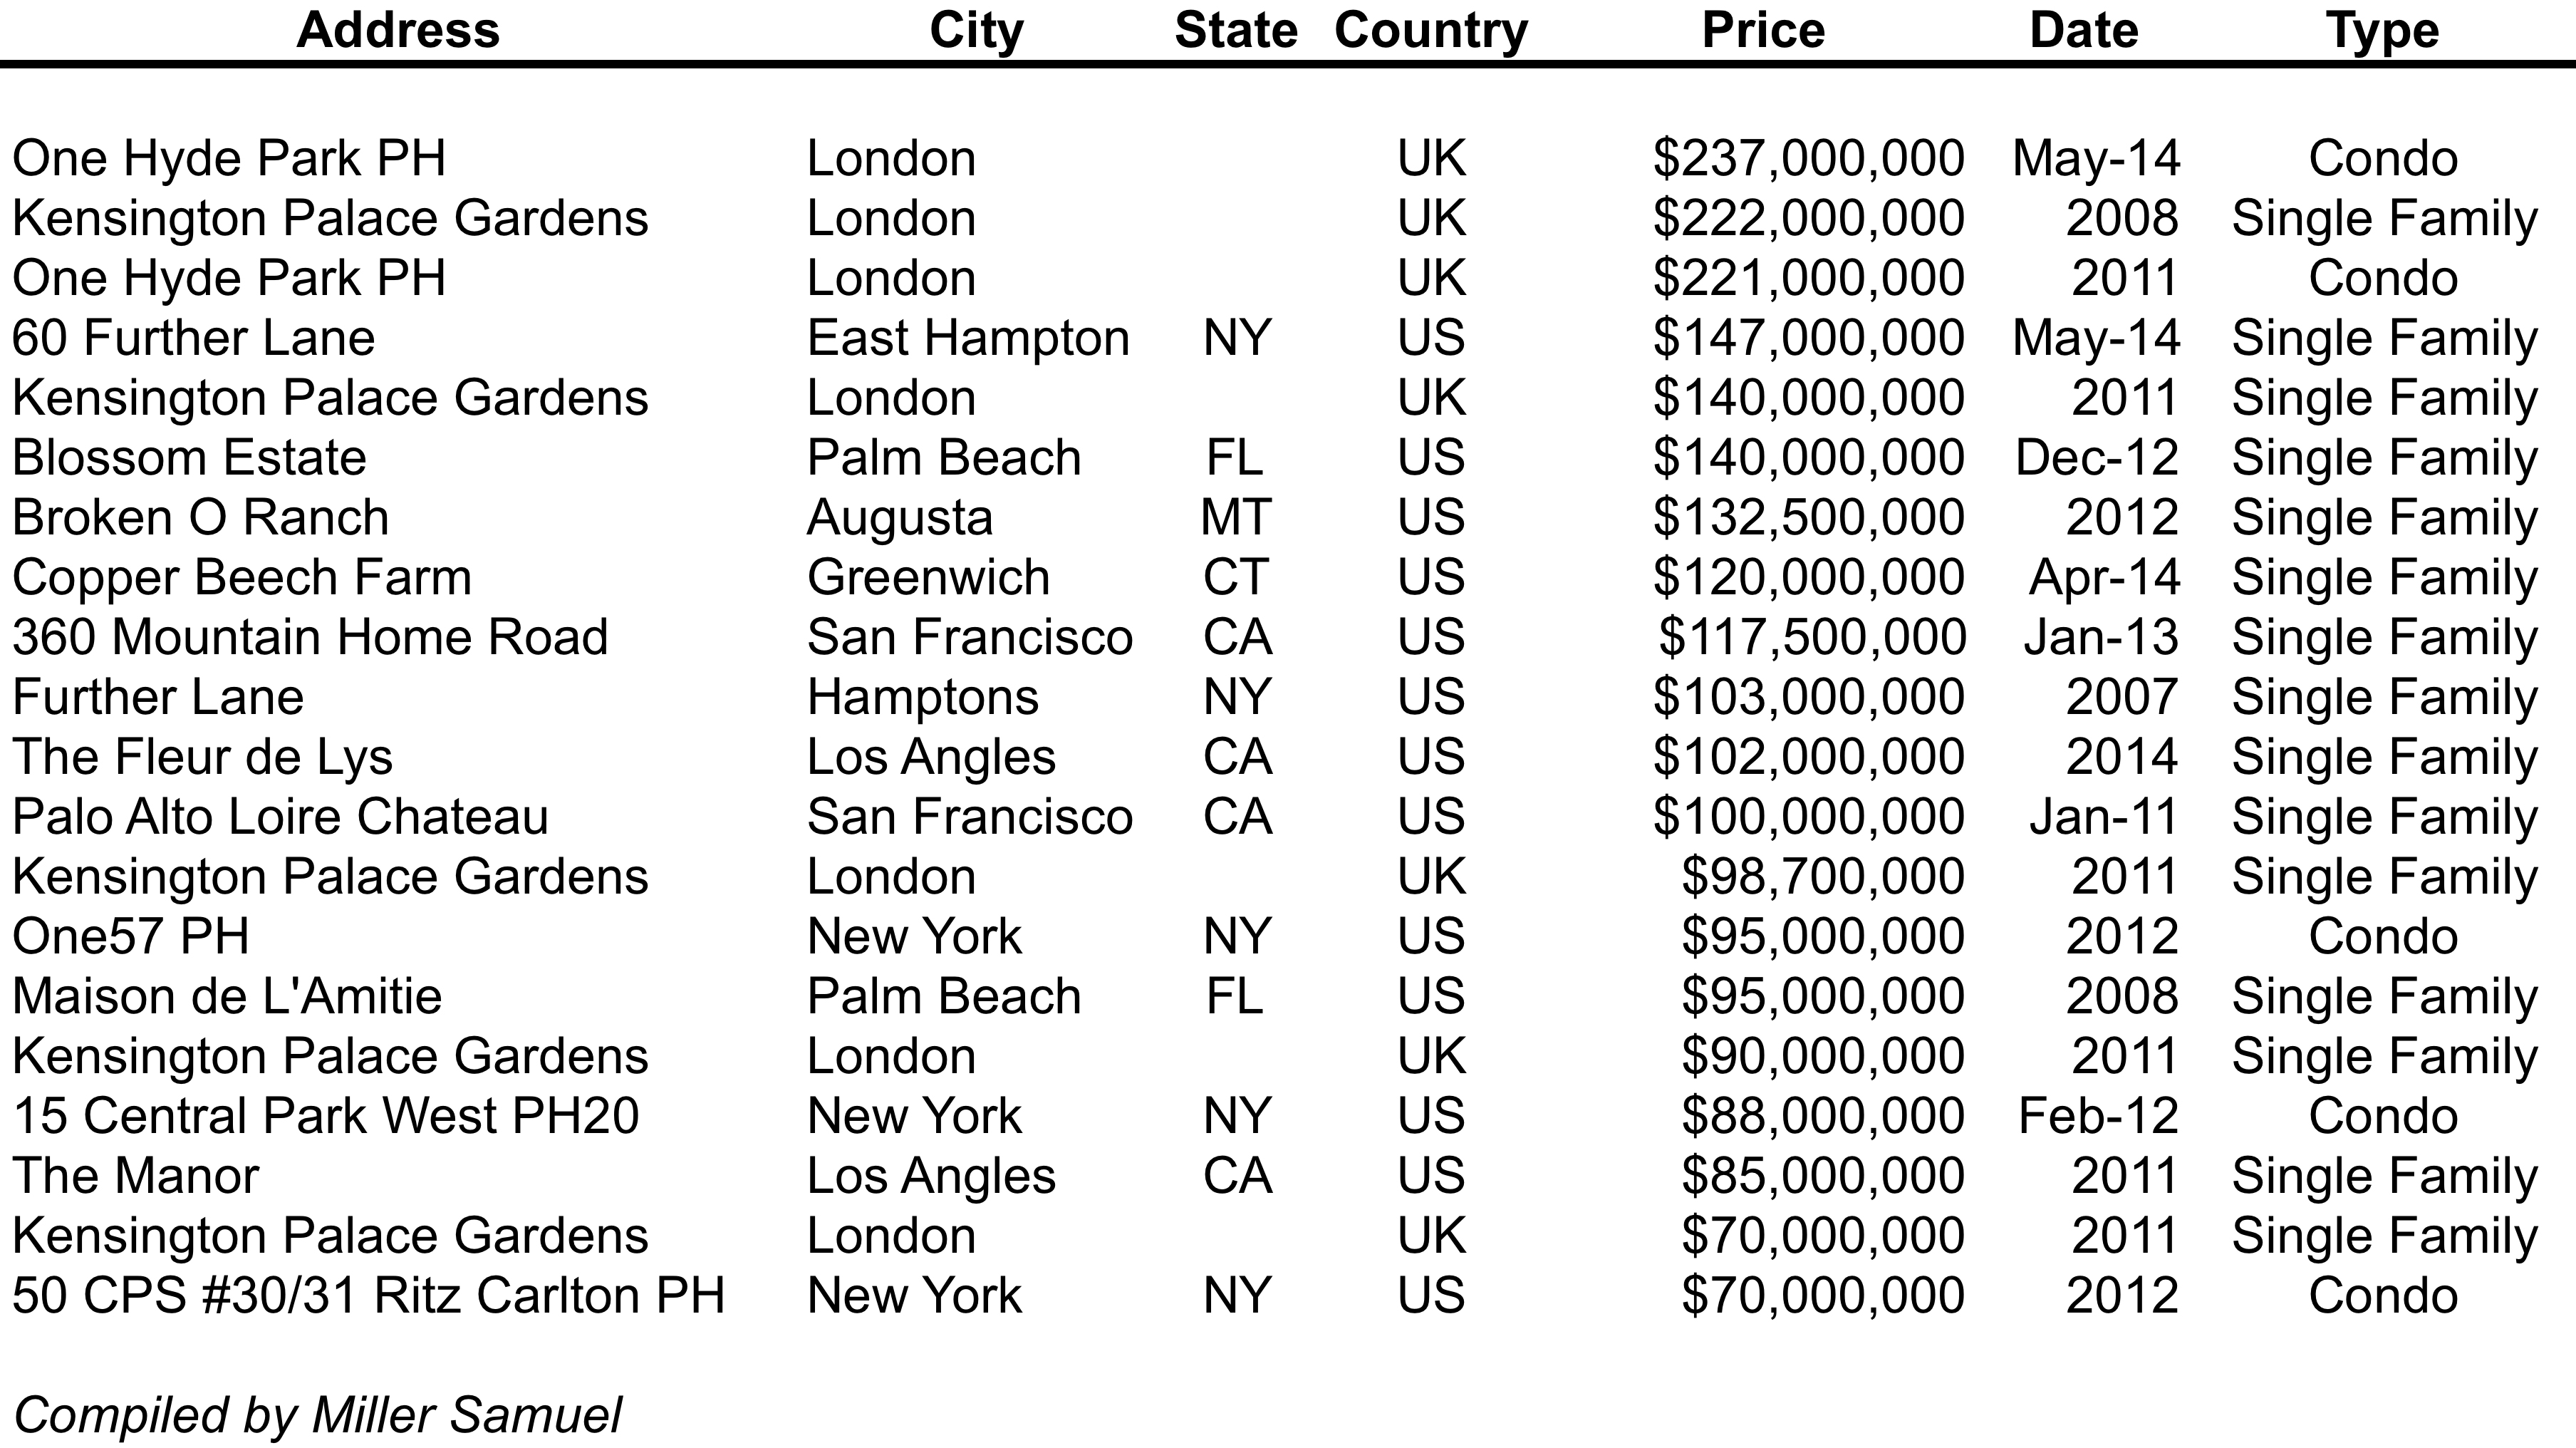
[Global Top 20] Highest Priced Closed Residential Sales List

May 14, 2014 | 11:15 am | | Radio |

5-14-14globallist
[click to expand]

After all the hoopla over the recent $147M sale in The Hamptons, I compiled a list of the highest priced sales around the world I could think of. It’s not comprehensive since all the sales are in the US or UK, and there are a few out there that haven’t closed yet.

Here’s a very brief Marketplace Radio piece on this phenomenon.

Please share if you know of others!

A few takeaways:

  • The media coverage to actual sales ratio is staggering.
  • There can’t be more than a few dozen, a few hundred or perhaps a few thousand that would be considered buyers in this space at any one time.
  • These sales are a pop culture-like distraction from the growing issue of access to affordable housing in the US.

Tags: , , , ,


[Three Cents Worth NY #234] Manhattan’s Stormy Listing Trend

June 12, 2013 | 3:50 pm | | Charts |

It’s time to share my Three Cents Worth (3CW) on Curbed NY, at the intersection of neighborhood and real estate in the capital of the world…and I’m here to take measurements.

Check out this week’s 3CW column on @CurbedNY:

This week I took a look at Manhattan’s year-over-year listing trends by the number of bedrooms on a weekly basis. I threw in a few milestones using ridiculous artwork (hey, this is Curbed!) to help provide some context. To state the obvious, listing inventory is very volatile and there are periods of time where certain segments stray from the pack. It’s clear that the top end of the market (four bedrooms, pink line) strayed the most over the past few years as many owners tried to piggyback onto a handful of trophy sales…


[click to expand chart]


My latest Three Cents Worth column on Curbed: Manhattan’s Stormy Listing Trend [Curbed]
Three Cents Worth Archive Curbed NY
Three Cents Worth Archive Curbed DC
Three Cents Worth Archive Curbed Miami

Tags: , ,


[Three Cents Worth NY #231] Manhattan Sales, Rentals Not Opposites

May 15, 2013 | 1:13 pm | | Charts |

It’s time to share my Three Cents Worth (3CW) on Curbed NY, at the intersection of neighborhood and real estate in the capital of the world…and I’m here to take measurements.

Check out today’s 3CW column on @CurbedNY:

I thought I’d take a look at price growth between the Manhattan rental market and sales market over the past decade. I am struck by how many of us have the default view that these two markets always move in opposite directions, myself included. In other words, if rental prices are rising, sales prices must be falling and vice versa. I trended the year-over-year change in median rental price and median sales price over the decade. I also inserted significant US housing milestones along the way but left out the ’13 launch of Iron Man 3…


[click to expand chart]


Today’s Post: Three Cents Worth: Manhattan Sales, Rentals Not Opposites [Curbed]
Three Cents Worth Archive Curbed NY
Three Cents Worth Archive Curbed DC
Three Cents Worth Archive Curbed Miami

Tags: , ,


[Three Cents Worth DC #208] Keep Your Eye On The Numbers (For The Past Decade)

September 13, 2012 | 12:24 pm | | Articles |

It’s time to share my Three Cents Worth (3CW) on Curbed DC, at the intersection of neighborhood and real estate in the nation’s capitol. And I’m simply here to take measurements.

Read this week’s 3CW column on @CurbedDC:

…I thought it would be visually helpful to show the ebb of and flow of the DC Metro area’s housing market. And since I just learned how to rotate a GIF image, I’m making up for all the art classes I never took in high school (band). I trended a decade’s worth of the robust web data from the regional MLS (RBI, a division of MRIS)—monthly new pending home sales and median sales price in a two year moving window. I also inserted some commentary on the milestones during the decade (i.e. highest points for price and sales, lowest points for price and sales, Lehman/credit crunch, tax credit, etc). Hopefully it’s not too distracting…


[click to read column]


Curbed NY : Three Cents Worth Archive
Curbed DC : Three Cents Worth Archive
Curbed Miami : Three Cents Worth Archive

Tags: , , , , ,


Tallest Chart in History of Manhattan Real Estate (Number of Sales by Price, 1/03 to 1/12)

March 1, 2012 | 3:57 pm | Charts |

Tags: ,


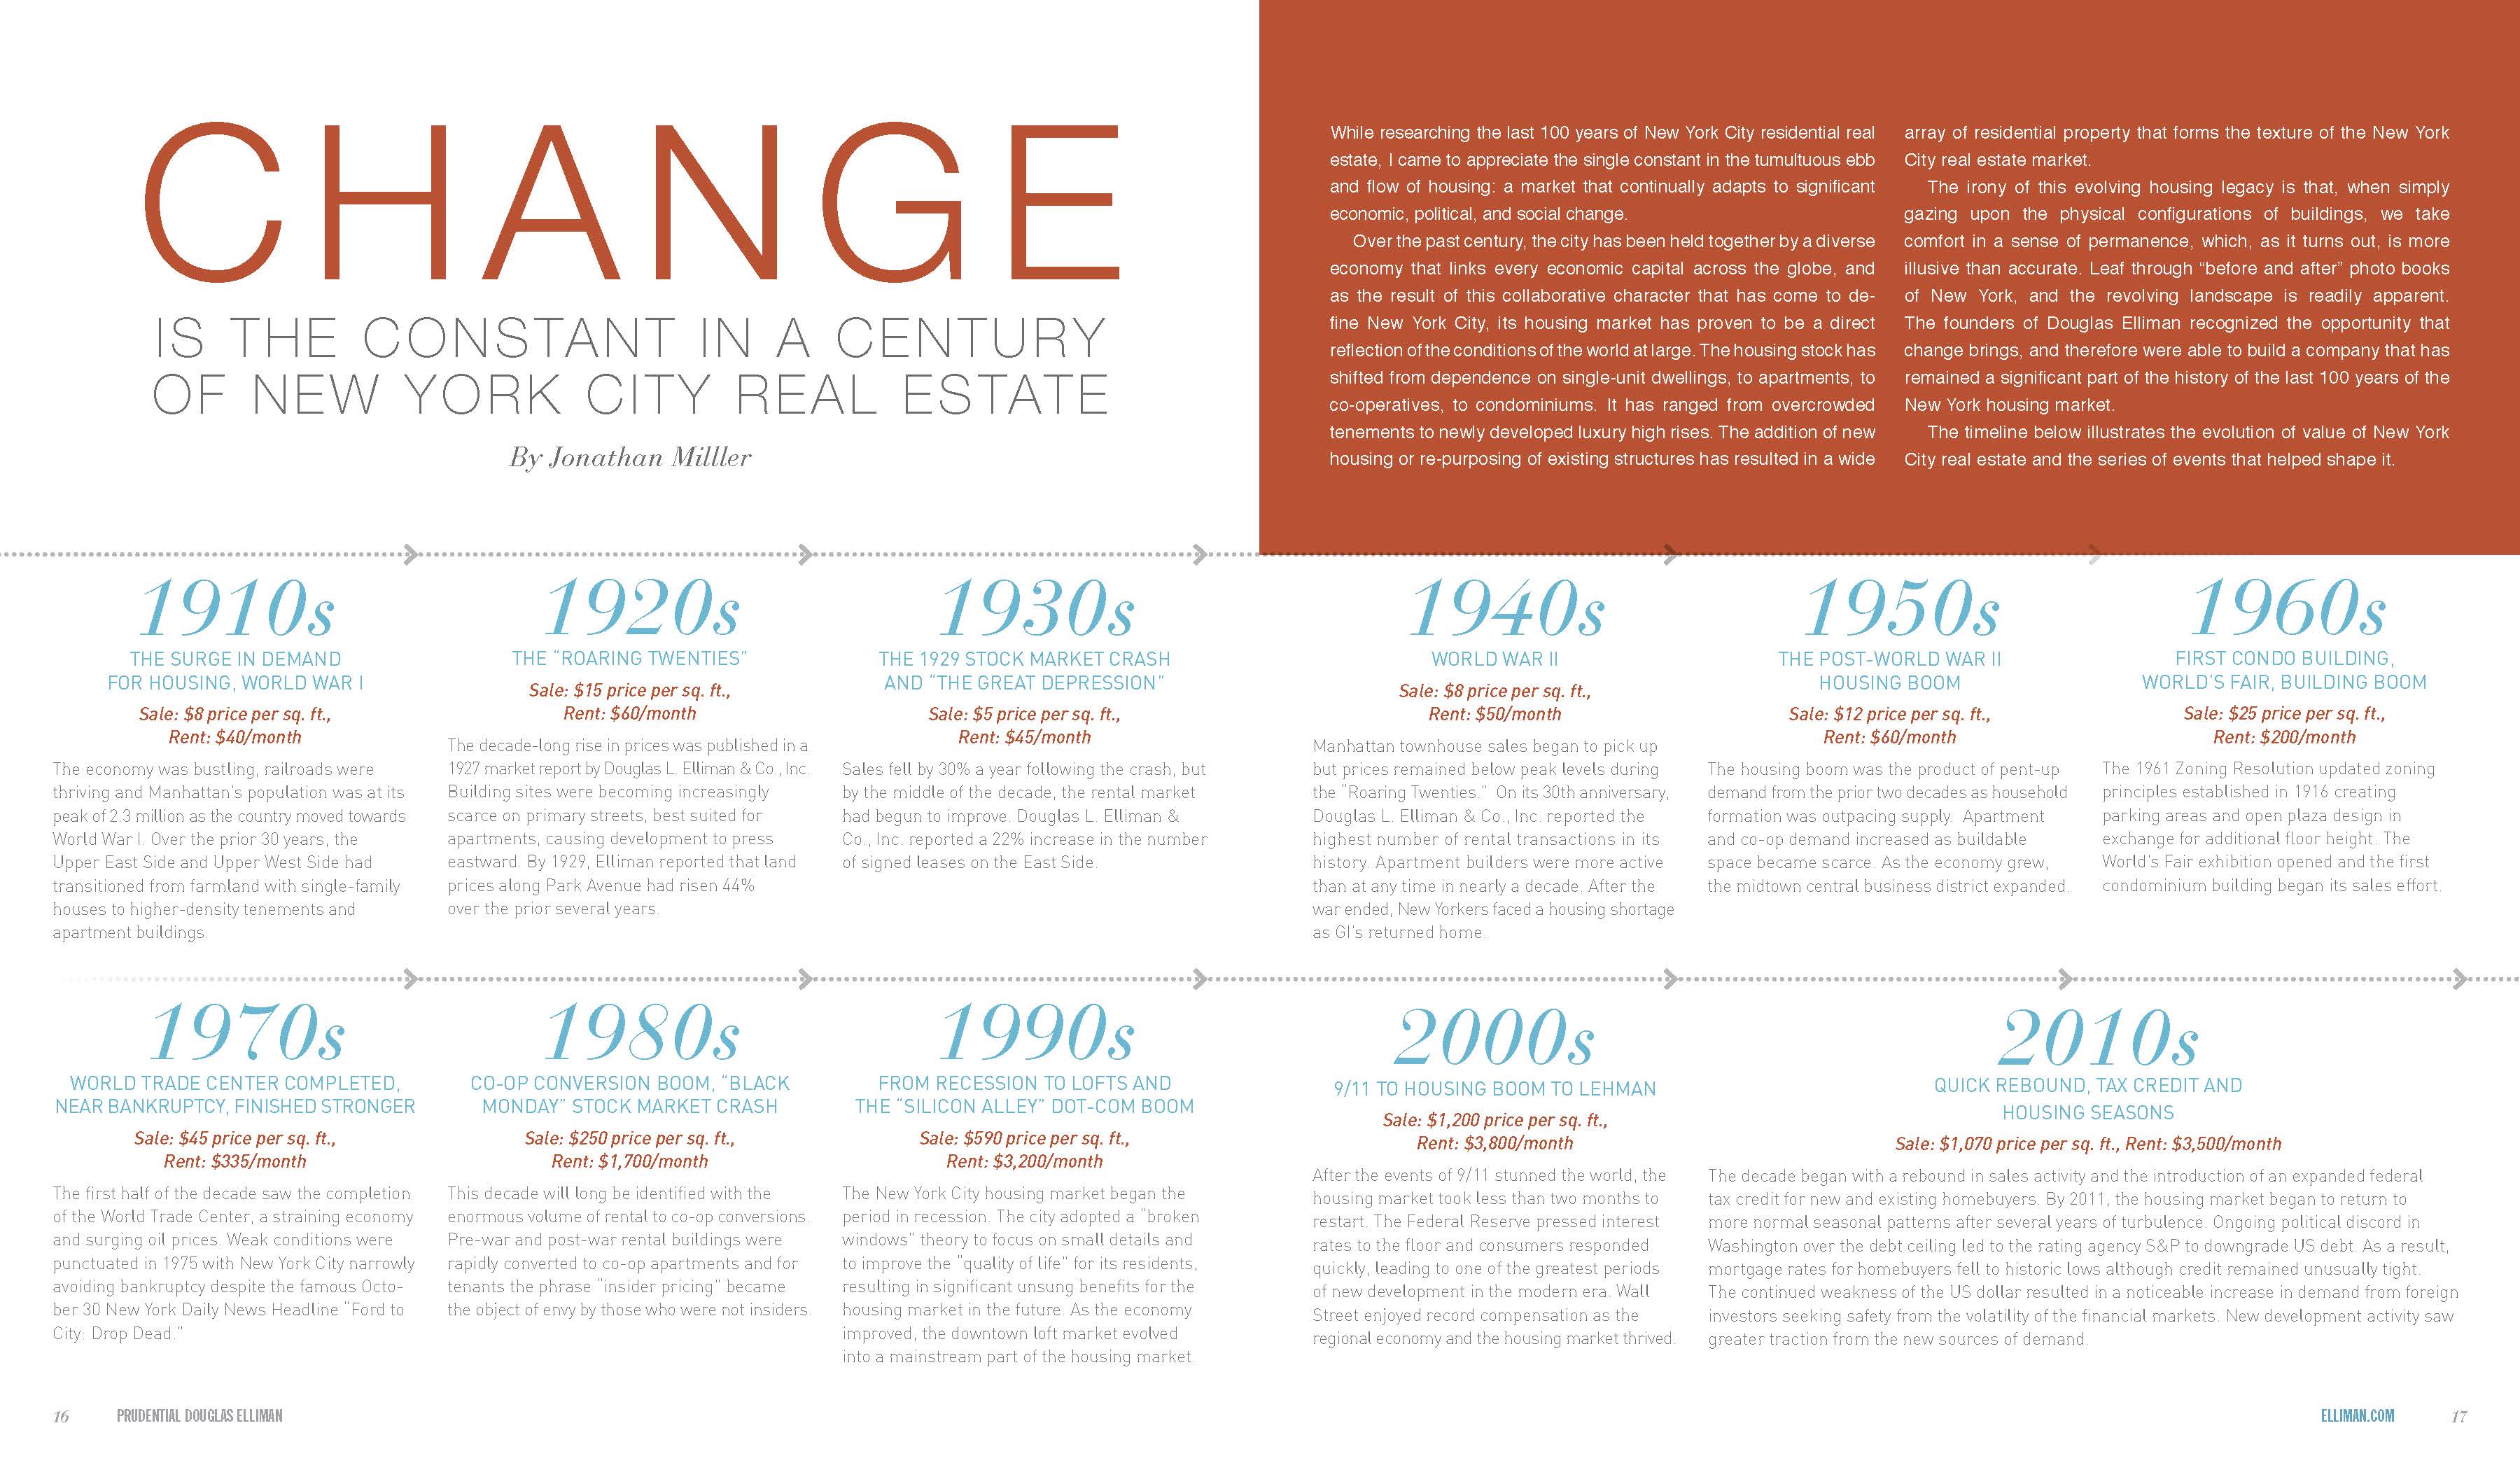
Change is Constant: 100 Years of New York Real Estate

February 7, 2012 | 11:28 am | | Articles |


[click to expand]

Last fall Prudential Douglas Elliman turned 100 years old and they asked me to write an article for their Elliman magazine. If you’ve been living in a cave, I’ve been writing their housing market report series since 1994.

What started as a simple project morphed into a fun, albeit gigantic, research project. I learned a lot about the evolution of the Manhattan housing market, largely through the amazing incredible New York Times archives. This was right about the time of my website revision and semi-necessary hiatus so I am cleaning out my desk of posts I have been itching to write so please indulge me.

The article I wrote for Douglas Elliman was beautifully presented by their marketing department and prominently inserted in their Elliman magazine (and iPad app!).

Diane Cardwell of the New York Times in her “The Appraisal” (an incredible column name BTW) penned a great piece: In an Earlier Time of Boom and Bust, Rentals Also Gained Favor that originated from my article and zeroed in on the 1920s and 1930s to draw a comparison to the current market.

I have the feeling my project is going to morph into something bigger – it’s just too interesting (to me). A few things I learned about the Manhattan market over this period:

  • Douglas Elliman published the first market study in 1927 [heh, heh] not counting other marketing materials written before WWI)
  • Real estate media coverage in the first half of the century was social scene fodder (same as today) but with extensive and excessive personal details presented on tenants, buyers and sellers yet housing prices and rents were rarely presented in public.
  • Manhattan made a rapid transition from single-family to luxury apartment rentals and eventually co-ops.
  • Housing prices and rents by mid-century weren’t that much different than at the beginning of the century.
  • Manhattan’s population peaked at 2.3M around WWI.
  • Wall Street in the 1920s was seen as the driver of the real estate market.
  • Federal and state credit fixes in the late 1930’s help bail out the housing market.


• Change Is The Constant In A Century of New York City Real Estate – pdf [Miller Samuel]
• My Theory of Negative Milestones [Matrix]

Read More

Tags: ,


[Sideways] 4Q 2009 Manhattan Market Overview Available For Download

January 5, 2010 | 11:51 am | | Reports |

The 4Q 2009 Manhattan Market Overview , part of a report series that we have authored for Prudential Douglas Elliman since 1994, was released today.

Other reports we prepare can be found here.

The 4Q 2009 data(coming later today) and a series of charts (available now).

Press coverage can be found here once we get around to uploading it. In the meantime….

An excerpt

……There were 2,473 sales in the current quarter, up 8.4% from the 2,282 sales in the prior year quarter and up 10.9% from the prior quarter. This level of activity was more than twice the 1,195 sales seen in the first quarter of 2009, which had been lowest level of sales in nearly 15 years. The return to more normal historical levels of sales activity was also reflected in the decline in inventory levels. There were 6,851 active listings at the end of the quarter, a 24.6% decline from 9,081 listings in the same period a year ago, but down 18.3% from 8,389 listings in the prior quarter….The second half of the 2009 Manhattan housing market reflected a new era, marked by the milestone Lehman Brothers Bankruptcy tipping point of September 15, 2008. Buyers, sellers and real estate professionals have slowly adopted to changes including stringent, if not irrational mortgage underwriting, elevated unemployment and layoffs, lower compensation, a sharp price correction, shadow inventory, first time home buyers tax credit, rising foreclosures, declining appraisal quality, expanding marketing times and a host of other challenges. While the increased level of sales in the second half of 2009 was encouraging, a true housing recovery will be marked by a meaningful decline in unemployment and greater consumer access to credit…….

Download 4Q 2009 Manhattan Market Overview

Tags:


TED’s Excellent Adventure

February 13, 2009 | 3:23 pm | |

Link to Bloomberg Chart

Ok, so this is my second Bill & Ted reference this week, but hey, Keanu Reeves starred, Matrix, etc.

I was having lunch with a good friend (other than the grief I regularly get about my bright shirt colors) the other day and he suggested I follow the TED spread more closely. While I have followed it, I’ve not been as fanatical about as many economists are. Perhaps I should be since, like the Fed’s Senior Loan Office survey, TED provides useful insight into the lending environment beyond mortgage rates.

I watched the CNBC special last night House of Cards, which was very good – not too much I hadn’t heard before but it did provide more clarity to the sequence of events and expanded my understanding of the roles Fannie/Freddie, Greenspan, CDOs and the rating agencies played in the risk/reward disconnect.

I also learned that the word Credit is derived from the Latin for Trust.

The TED spread (Treasury Eurodollar) for the uninitiated is the rate spread between treasury bills and and LIBOR.

Treasury bills are thought to represent risk free lending because there is the assumption that the US government will stand behind them. LIBOR represents the rate at which banks will lend to each other.

the difference in the two rates represents the “risk premium” of lending to a bank instead of to the U.S. government.

When the TED spread is low, banks are likely in good shape because banks feel nearly as confident lending to each other as if it were backed US government (The US has recently proved we’ll back pretty much back anything).

The spread is usually below 100 basis points (“1” on the chart). It reached a recent low of 20 basis points in early 2007, which in my view, shows a disconnect in the pricing risk since the subprime mortgage boom began to unravel in early 2006.

The spread spiked in in mid 2007 at the onset of the credit crunch (that was a summer to remember) and later spiked to 460 on October 10, 2008 as the wheels came off the financial system and became the new milestone or “tipping point” for the new housing market.

The spread has been contracting which is perhaps a sign that banks are starting to feel less panicked about each other. I think lending conditions will improve over the next few years, but there is a long way to go as measured by years rather than quarters.

Note: Another TED worth noting. A great resource for the intersection of Technology, Entertainment and Design.


Tags: , , ,


[In The Media] Theory Of Negative Milestones Means A New Beginning

November 9, 2008 | 8:30 pm | | Milestones |

I have long believed in what I call the “theory of negative milestones.” There are seminal events that mark new periods of real estate activity. (both map mashups courtesy of NYT)

This weekend’s New York Times real estate cover story was based on my firm’s ongoing research of the Manhattan housing market. The content in the article was thoroughly fleshed out by my friend Noah over at Urban Digs so I won’t elaborate.

In 2008, the influence of the credit crunch has been characterized by various levels of impact on segments and a lower level of activity. Everyone who lives in Manhattan can feel it, especially those in the real estate brokerage business. The events of the past two months have marked a new milestone with the bailout of Frannie, the $700B stimulus package, collapse of Lehman, the purchase of Merrill, the reclassification of Morgan and Goldman to commercial bank status, aggressive actions including cutting rates by the Fed, a culmination of 22 months of campaigning, a new party taking over the executive branch and gaining power in Congress. In other words, change.

The promise or anticipation of change makes people in real estate pause and reflect.

Still, there is real estate activity, albeit at a slower pace. Informed buyers are signing contracts. Many participants are optimistic about the new direction promised by the new administration, and in the short term, that may cause a slight bump up in activity. However, the credit crunch continues to overshadow housing markets in the US.

Stabilize credit, then and only then, can the housing improve.

Speaking of wolves at the door…


Tags: , ,


[Banking On Recovery] Did The Glass-Steagall Repeal Cause Our Insecuritization?

September 29, 2008 | 12:15 am | |

There has been a lot of debate on whether the repeal of Glass-Steagall on November 13, 1999 via the Gramm-Leach-Bliley Financial Services Modernization Act was the beginning of the end of the separation of financial church and state. The Glass-Steagall Act, also known as the Banking Act of 1933 was created to prevent commercial banks from entering the investment bank business.

If you’ve been abducted by aliens for the past three weeks, here’s a great way to catch up on the bailout.

And when you are caught up (assuming the alien thing was accurate), here’s a once in a while requirement from Matrix. A required reading assignment: What’s Free About Free Enterprise?

The first is the risk of moral hazard within the bailout itself. That is, if government is going to make good so many losses throughout the system, why would anyone set limits on future risk-taking? The situation could turn into a free-for-all that makes the recent disregard of risk look like child’s play.

The second problem is more philosophical, involving what the bailout plan reveals about the functioning of the free enterprise system. This raises disturbing questions. Although I agree with President Bush’s observation that “the risk of not acting would be far higher,” we should be aware of the secondary effects of what we are getting into.

Analysis of an IMF study on bank failures shows that the average recovery rate in a banking crisis averaged just 18 percent of the gross costs. Barrons seems to think the taxpayer will come out ahead.

Not everyone thinks the bailout is a great idea.

I should add, though, that I don’t think the people spearheading the bailout have a clear idea about what they’re doing either. They remind me of the old saying: “Something must be done. This is something. Therefore this must be done.” I’m a former student of Chairman Ben Bernanke and his behavior during this mess has been a big disappointment.

Robert Shiller writes an opinion piece in the Washington Post this weekend telling everyone to calm down – government intervention is not unusual and not a bad thing. Everybody Calm Down. A Government Hand In the Economy Is as Old as the Republic. He makes the argument that capitalism evolves and is not etched in stone. He makes a compelling argument.

Megan McArdle in The Atlantic says its not about the Glass-Steagall repeal at all because securitization has been around for a while and Gramm Leach didn’t impact lending standards at commercial banks, among other items.

But Dan Gross at Slate and Newsweek says that the repeal is the end of an era and perhaps infers, that it caused the situation we are in today.

The policy response was to erect a wall between investment banking and commercial banking. It outlasted the Berlin Wall by a few decades. In the 1990s, as another bull market took hold, momentum built to overturn Glass-Steagall. Commercial banks were eager to get into high-margin businesses like underwriting hot tech stocks. Brokerage firms saw commercial banks, with their massive customer bases, as great distribution channels for stocks, mutual funds, and other financial products that they created. Generally speaking, the investment banks were the aggressors.

While I don’t blame the credit carnage all on the repeal of Glass-Steagall, it sure is a compelling milestone and played a role. Banks and investment banks had blurred lines of distinction and regulators were no match for the investment banks. Of course, JPMorgan Chase, who seems to be coming up roses with recent mopup efforts, was the merger of an investment bank and a commercial bank.

The mindset was free markets need to be free because market forces were self-regulating. Of course, that purist view may very well have caused one of the most constraining regulatory environments in the modern era going forward.


Tags: , , ,


52-Card Pickup, Or How Steroids Impacted The Housing Market, Sort Of

July 10, 2007 | 11:59 pm |

Credit Suisse analysts have come up with a startling number:

52.

That’s 52 followed by 9 zeros and inserting 3 commas (I am fond of commas).

$52,000,000,000 in subprime CDO’s at risk.

The losses are projected to have a ratio of about 80%/20% hedge funds/banks. This is not bigger than the Savings & Loan FDIC bailout amount of $125 billion about 15 years ago whose costs were born by the taxpayers through the massive sell off of assets through the sub-agency Resolution Trust Corporation, lovingly known by appraisers as the RTC. It was nirvana for appraisers, because we got to estimate values for complex foreclosed assets of defunct S&L’s, including hair-brained development deals and oddball asset classes conjured up by people who had no business doing what they did.

Major League Baseball’s All-Star game is going on right now and the Tour de France bicycle race (my favorite, second only to March Madness) began last Saturday. Baseball and professional bicycling have been plagued by scandals including steroids, human growth hormones, blood doping and others. I am big fans of both sports, but they have been tainted for many years with this form of cheating, whether or not the drugs were legal at the time.

Did it make me write off these sports as a fan? No.

Does it taint the records and perceptions of the players and does it place the sports at risk in the long term? Yes, perhaps.

When things are going well, its often easier to look the other way.

These professional athletes may have achieved milestone records, won championships and received big contracts in exchange for perhaps, a shorter life expectancy. Perhaps they suffered from a limiting understanding or an obscured appreciation of their own health risk.

Institutional investors and investment bankers also suffered from a lack of understanding of the real risks and what these subprime mortgages really represented. Like professional sports, there is nothing inherently wrong with subprime lending as long as ethics are adhered to and guidelines or standards are followed. While subprime loan applicants typically have a much higher credit risk, it was the issuers of these loans that were the parties that should have scrutinized by investors. The subprime mortgage market may not have melted down if basic lending standards were applied in the subprime lending process.

Don’t mean to pontificate, but its that lack of an appreciation of risk, and the disconnect with asset values that is something I deal with every day as an appraiser. Plus, its an easy way to speak about what’s on my mind in one post: MLB, The Maillot Jaune and a changing real estate market.


Tags: ,

Get Weekly Insights and Research

Housing Notes by Jonathan Miller

Receive Jonathan Miller's 'Housing Notes' and get regular market insights, the market report series for Douglas Elliman Real Estate as well as interviews, columns, blog posts and other content.

Follow Jonathan on Twitter

#Housing analyst, #realestate, #appraiser, podcaster/blogger, non-economist, Miller Samuel CEO, family man, maker of snow and lobster fisherman (order varies)
NYC CT Hamptons DC Miami LA Aspen
millersamuel.com/housing-notes
Joined October 2007