Skip to content
Services
Appraisals
Consulting
Resources
Market Reports
Charts
Matrix Blog
Articles & Research
Press
About
get in touch
Charts
› IRS
October 4, 2015
Appraising
,
Brokers, Agents, MLS, NAR
,
IRS
,
Junk Statistical Analysis, Luck, Superstition and Coincidence
,
Law, Ethics & Fraud
Multi-millionaire Motivational Speaker Dean Graziosi Shares His Appraisal Wisdom
read more
April 28, 2014
Brokers, Agents, MLS, NAR
,
Charts, Maps, Images, Infographics, Video
,
Housing Indices & Portals
,
Housing Trends & Cycles
,
IRS
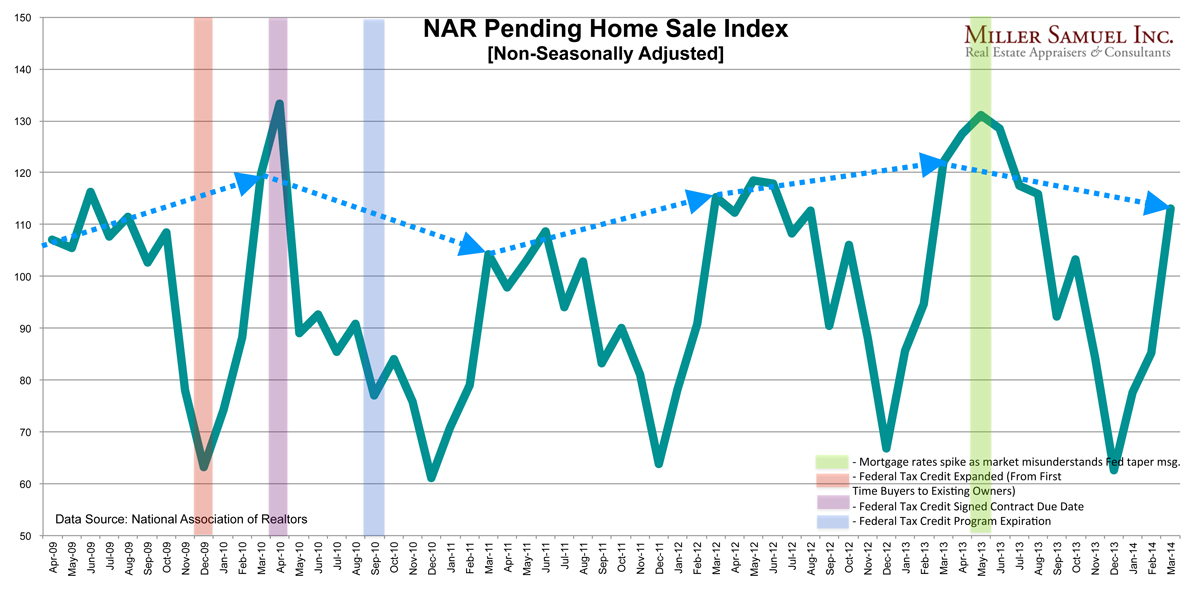
NAR Pending Home Sales Had Biggest “February to March” Jump in 4 Years
read more
March 5, 2014
Government, Politics, Regulations & Policy
,
Housing Trends & Cycles
,
IRS
,
Language, Jargon & Quotes
,
Manhattan
,
New York Times
,
Philadelphia
,
Suburban, Urban, Commuting
Is Gentrification a Four Letter Word?
read more
February 25, 2014
Credit, Finance, Mortgage, Rates
,
Curbed
,
IRS
,
Manhattan
,
Rentals, Investing
,
Sales
[Three Cents Worth #260 NY] Looking At Manhattan’s Mortgage History
read more
May 13, 2013
Douglas Elliman
,
Elliman Reports
,
Hamptons/North Fork
,
IRS
,
Taxes, Insurance, Fees
[No Fiscal Cliff Hangover] 1Q 2013 Hamptons & North Fork Reports
read more
May 13, 2013
Douglas Elliman
,
Elliman Reports
,
IRS
,
Long Island
[Defined by Low Supply] 1Q 2013 Long Island Sales Report
read more
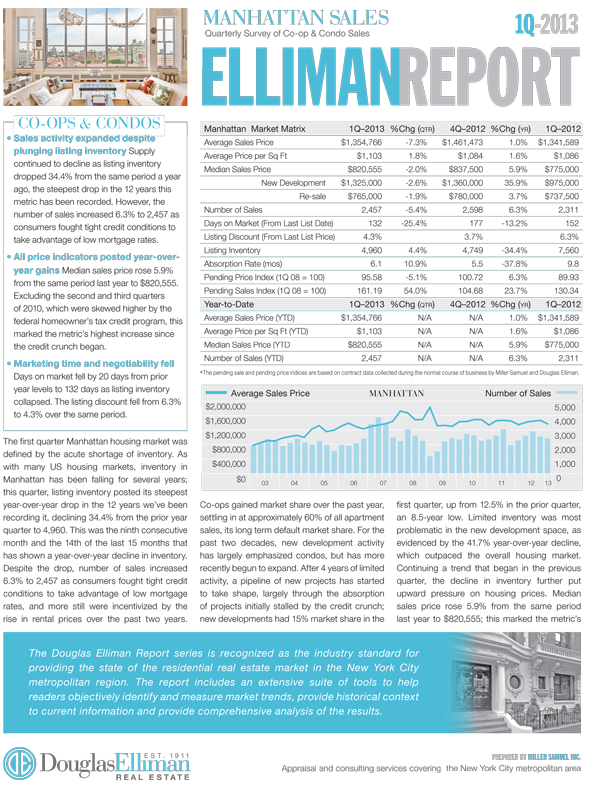
April 2, 2013
Douglas Elliman
,
Elliman Reports
,
IRS
,
Manhattan
[Inventory Collapse] 1Q 2013 Manhattan Sales Report
read more
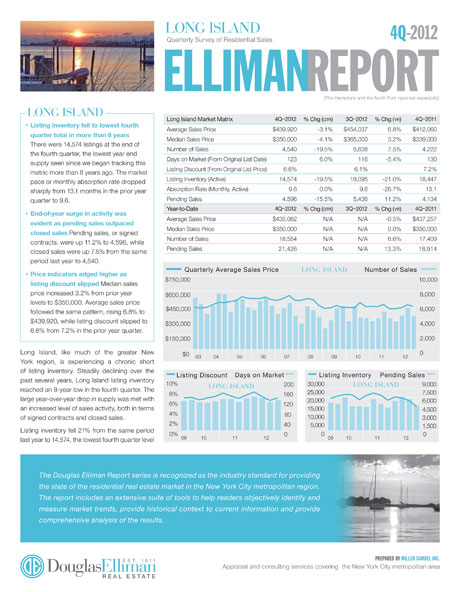
January 25, 2013
Douglas Elliman
,
Elliman Reports
,
IRS
,
Long Island
[Turning Corner?] 4Q 2012 + 2003-2012 Long Island Decade Reports
read more
June 7, 2012
Appraising
,
Credit, Finance, Mortgage, Rates
,
Government, Politics, Regulations & Policy
,
IRS
‘Defensibility’ of Property Values [Part II of Trilogy]
read more
June 23, 2010
Government, Politics, Regulations & Policy
,
IRS
,
Market Reports
[FHFA] U.S. Monthly House Price Index Up 0.8% M-O-M, Down 12.8% From Peak
read more
June 22, 2010
Brokers, Agents, MLS, NAR
,
Distressed Housing
,
IRS
,
Market Reports
,
Wall Street Journal
[NAR] Existing Home Sales Decline 2.2%, But a ‘Northeaster’ Weighed Down the Results
read more
June 21, 2010
IRS
,
Market Reports
,
Washington DC
[CoreLogic] Home Price Index 2.6% YOY and 0.8% MOM Increase
read more
1
2
Next
Load More Posts
Page load link
Go to Top