NAR released its May existing home sales report today. This was one of the most bizarre existing home sale reports I can recall.
First of all, the expectation of a drop in sales activity was widely expected due to the end of the federal tax credit, yet economists surveyed were anticipating an increase in sales in May? Real estate professionals were bracing themselves for a decline in sales in May.
>Economists surveyed by Dow Jones Newswires expected existing-home sales to climb by 5.0%, to a rate of 6.06 million. The surprise decline followed two increases driven by a tax incentive for first-time buyers that the government enacted to spur a housing sector recovery.
I viewed the impact of the tax credit as “poaching” sales from the next 60-90 days rather than a vehicle to jump start the housing market. We really need jobs first.
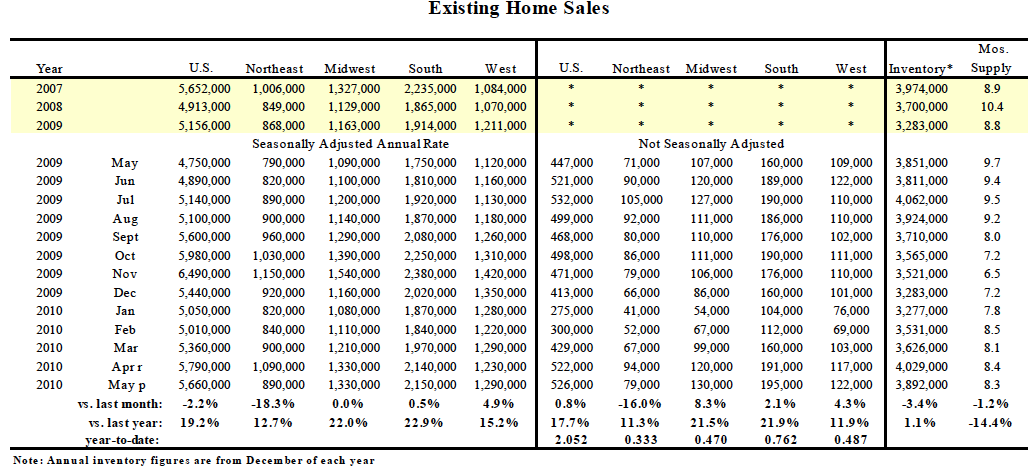
But if you look closely at the data, M-O-M sales were up or flat in each of the 3 regions except the northeast, which posted an 18.3% seasonally adjusted decline.
The report headline was generally accurate “May Shows a Continued Strong Pace for Existing-Home Sales” if you remove the northeast from consideration.
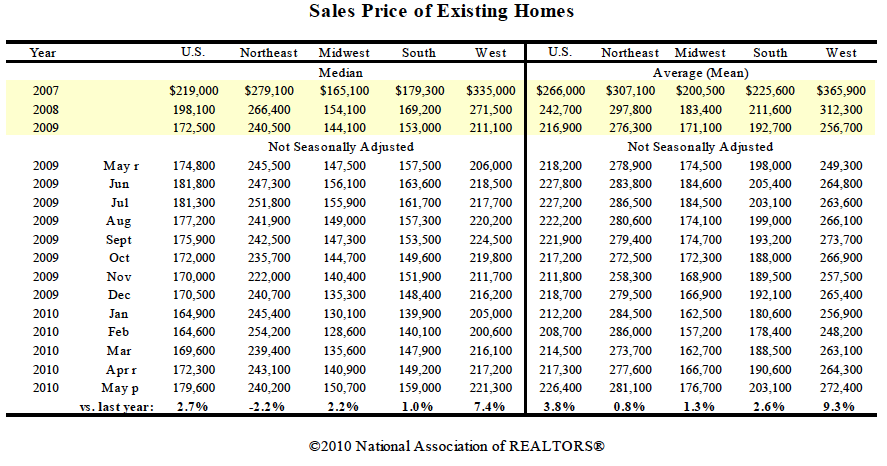
Sales price showed the same pattern. While US prices were up 2.7% M-O-M, the northeast prices declined 2.2%.
My interpretation of this “Northeaster” centers around foreclosures. The south and west posted significant foreclosure activity and price declines nearly 2 years ahead of the northeast. The midwest hasn’t seen the same volatility as the other regions. Perhaps the west and south have been pummeled enough that they are actually seeing a bottom in both sales and prices trends. Foreclosure activity is flowing freely while the northeast seems to be lagging in that regard.
Ok, I’m reaching through generalizations but why the disparity by region?
Here are this month’s metrics:
* existing-home sales fell 2.2 percent to a seasonally adjusted annual rate of 5.66 million units in May down from a revised 5.790 million in April
* existing-home sales are 19.2 percent higher than the 5.1 million-unit pace in May 2009.
* housing inventory fell 3.4 percent to 3.89 million existing homes available for sale from April 10 but is 1.1% above last year
* there is an 8.3-month supply down from an 8.4-month supply in April and down from a 9.7 month supply last year.
* national median existing-home price was $179,600 in May, up 2.7 percent from May 2009.
* distressed homes accounted for 31 percent of sales last month, compared with 33 percent in April 10 and 33 percent in May 09.
One Comment
Comments are closed.


[…] Read further on Matrix » [NAR] Existing Home Sales Decline 2.2%, But a ‘Northeaster’ Weighed Down the Results. […]