 [Source: WSJ]
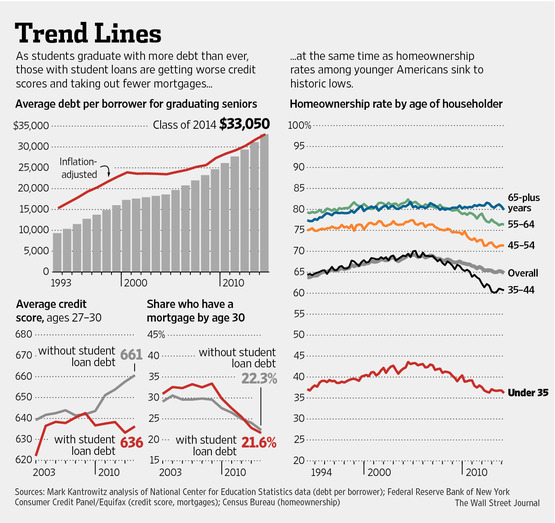
I really like the way this chart illustrates the 20 year decline in the homeownership rate. A few thoughts on what it shows:
Under 35 – Lowest in 20 years – record student debt and tepid economy plays a significant role in falling rate.
35-44 – most volatile, has overcorrected – large gain during credit boom and fell well below 1994 levels.
45-54 – fell below 1994 levels but didn’t rise as much during credit housing boom.
55-60 – higher than 45-54 group but followed a similar arc – fell below 1994 levels but didn’t rise as much during credit housing boom.
65 and above – only category to finish higher than 1994 levels – not heavily influenced by credit bubble.
Overall – is currently higher than 1994 levels. Coming down from artificial credit bubble high – probably won’t stop declining until credit begins to normalize.