 [click to expand]
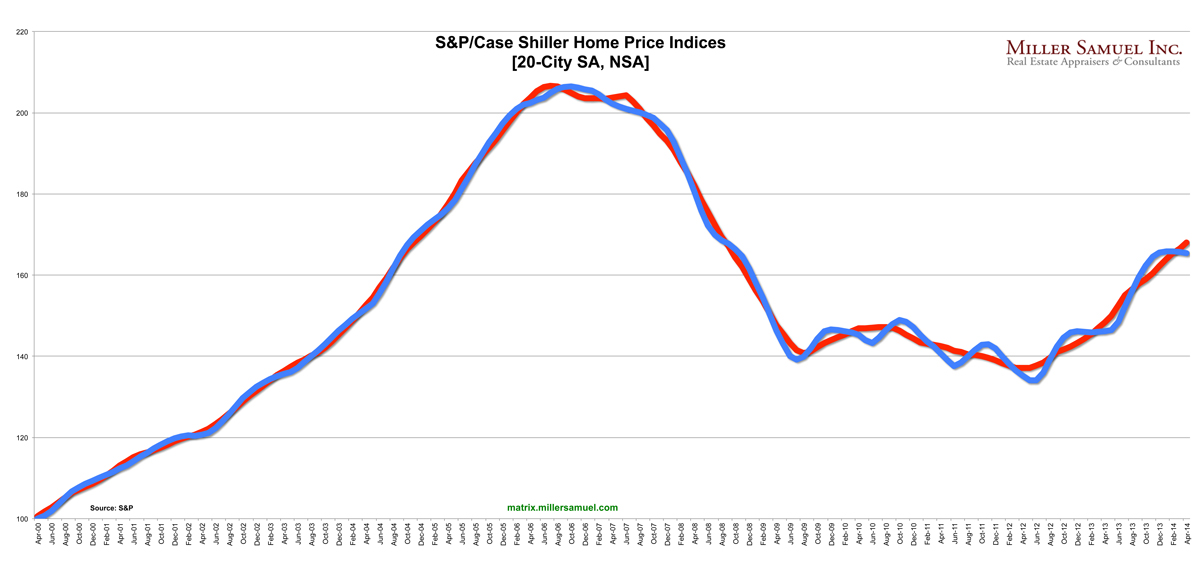
The above chart is a generic trend line for the seasonally and non-seasonally adjusted 20-City Case Shiller Index released today using the data from the release.
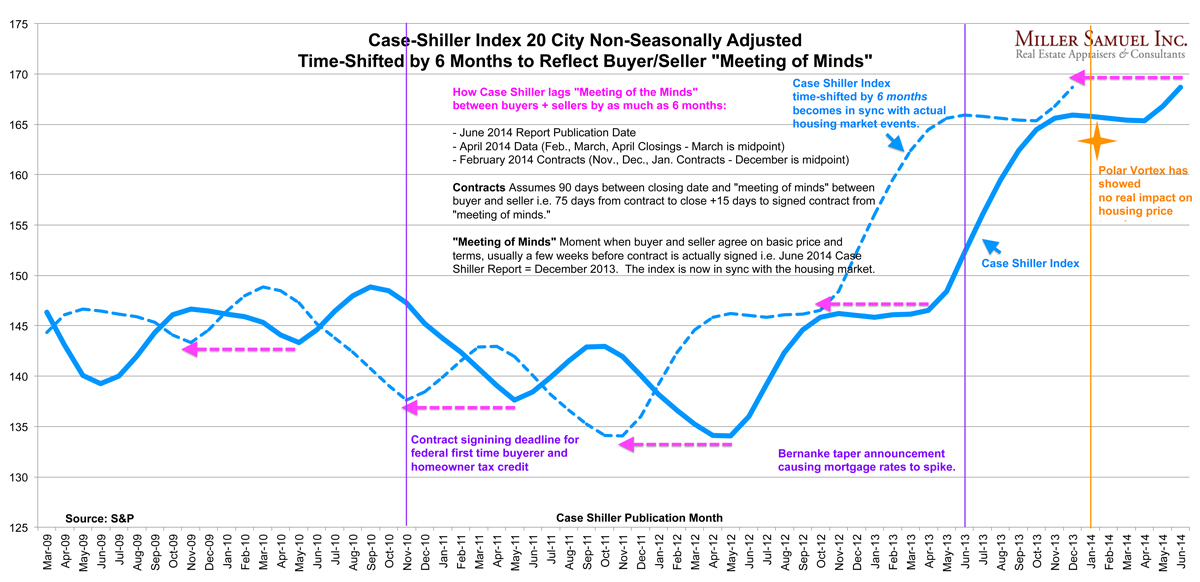
And here’s the same index that I time-shifted backwards by 6 months to reflect the “meeting of the minds” of buyers and sellers. More specific methodology is embedded in the following charts. By moving the index back 6 months, the changes in the direction of the index are in sync with economic events (reality). In my view this index has a 6 month (5-7) month lag rendering it basically worthless to consumers but perhaps a useful tool for academic research where timing may not be as critical. I’m just grasping here.
And here’s a time-shifted trend line for the year-over-year change in the 20 city index. You can see that the pace of year-over-year price growth began to cool at the end of last year. Talk about the weather is still premature since the polar vortex occurred after the new year.

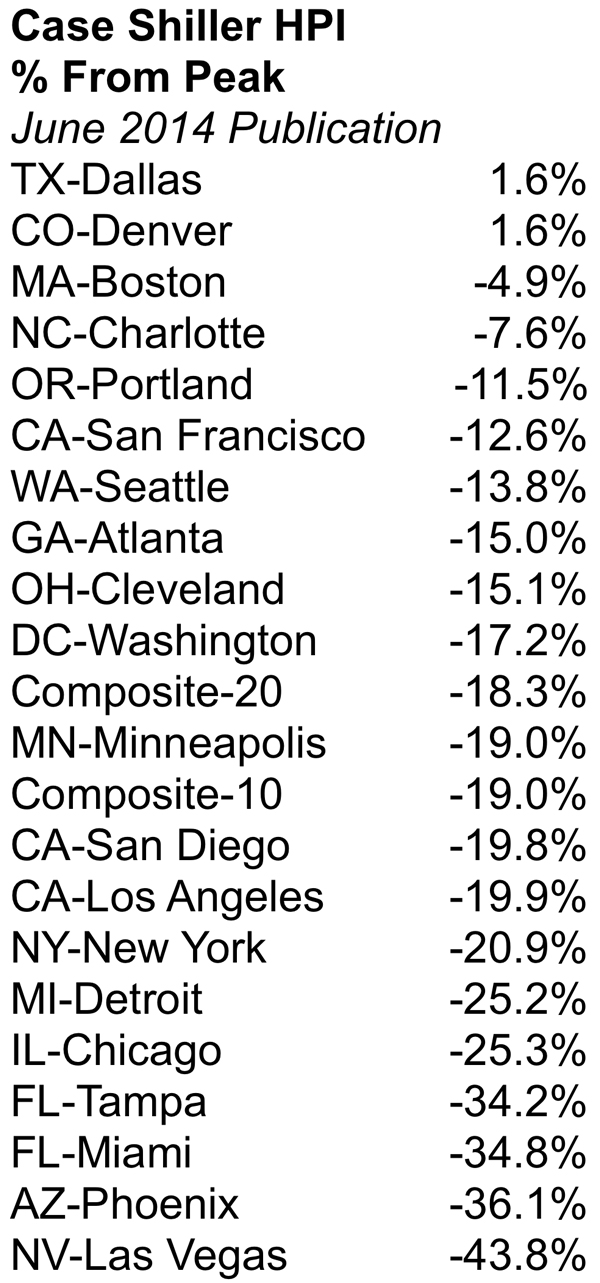
And here is the ranking by year-over-year changes for each city as well as the 10 and 20 city index. Dallas and Denver are no longer under water and Las Vegas, despite recent good news has a long way to go to get to the artificial credit induced high it reached in 2006.