Matrix Blog

Brooklyn

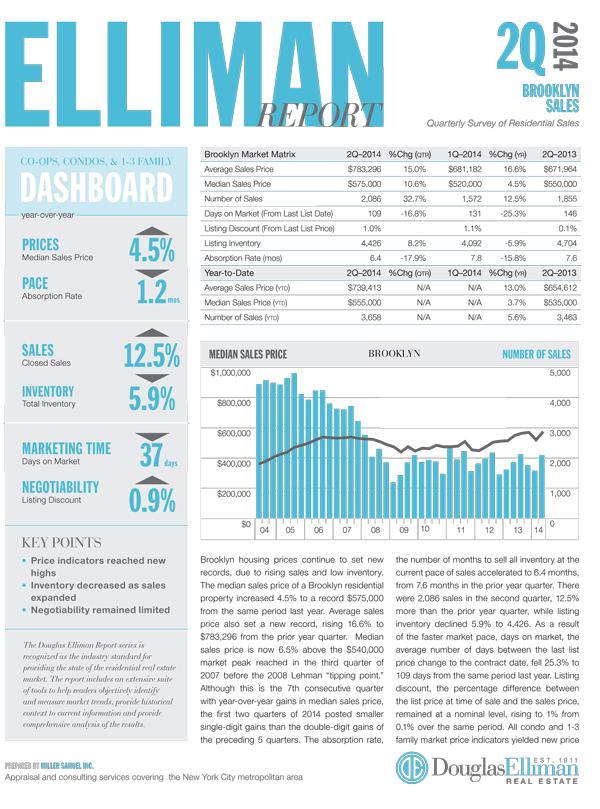
2Q14 Brings Mixed Regional Messages – Brooklyn, Queens and Westchester/Putnam Reports

July 14, 2014 | 8:53 am | | Reports |

If you’ve been:

A. Pouring over state maps of pet ownership
B. Watching the World Cup
C. Watching the Tour de France
D. Fretting about the Russell Stover purchase

Then you may have missed last week’s market report releases for Brooklyn, Queens and Westchester/Putnam Reports. These are part of the report series I’ve been writing for Douglas Elliman since 1994 (20 years!). The reports have a new look – hope you like them.

Click on graphics to open them.

Brooklyn_2Q_2014

BROOKLYN SALES MARKET Brooklyn housing prices continue to set new records, due to rising sales and low inventory. The median sales price of a Brooklyn residential property increased 4.5% to a record $575,000 from the same period last year. Average sales price also set a new record, rising 16.6% to $783,296 from the prior year quarter. Median sales price is now 6.5% above the $540,000 market peak reached in the third quarter of 2007 before the 2008 Lehman “tipping point.” Although this is the 7th consecutive quarter with year-over-year gains in median sales price, the first two quarters of 2014 posted smaller single-digit gains than the double-digit gains of the preceding 5 quarters…

Queens_2Q_2014

QUEENS SALES MARKET The Queens housing market took a breather after 6 consecutive quarters of rising sales. There were 2,404 sales in the second quarter, 3.6% less than the same period last year. Year to date, the number of sales remained 14.2% higher than the same period last year due to the sharp rise in first quarter sales activity. Despite the decline, listing inventory continued to fall for the 13th consecutive quarter. There were 5,892 listings at the end of the second quarter, 5.3% less than the same period last year. As a result of the combination of declining sales and falling inventory, the pace of the market remained stable…

Westchester_2Q_2014

WESTCHESTER/PUTNAM SALES MARKET Westchester single family contract activity was higher than prior year levels as severe winter weather conditions pushed first quarter pending sales into the second quarter. Despite the 16.7% decline in closed home sales, total contracts expanded 3.9% from the prior year quarter and jumped 51.9% from the prior quarter. The rise in contracts from first to second quarter was higher than the 35.5% average increase of the prior 2 years. Listing inventory expanded 7.9% to 3,905 rising from the low water mark set in 2013…


Miller Samuel Aggregate Database [Miller Samuel]
Market Chart Gallery [Miller Samuel]


…and the Home Seller will give you a Free Tesla!

July 12, 2014 | 7:26 pm | |

SodFarmtractor

Back when I was in college, a good friend of mine owned a large Michigan sod farm with his father – acres and acres of putting green quality sod. They wanted to upgrade their big tractor so I joined him on his visit to the local tractor dealership – International Harvester (my parents tell me I am a distant – really distant – relative of John Deere).

1979IHscout

[Source: Hemmings]

The tractor they were looking at included air conditioning and a surround sound stereo system. It was impressive. The salesman said that if they bought the tractor that month the dealership would throw in an International Harvester truck.

My friend’s comment to me under his breath was something along the lines of “looks like we are actually buying the truck too.”

Jhoanna Robeledo’s New York Magazine piece on the guy who throws in a Tesla if you buy his condo talks about this marketing technique.  Using a Tesla is buzz worthy as a well thought of brand – after all marketing is about getting eyeballs on the listing – but is it effective?  Does this technique actual sell properties?

In my view throwing in such a large concession is a red flag signifying the property is over priced enough to cover the seller’s cost of the “gift.”

Econ 101:  There is no such thing as a free lunch.

We’ve seen this marketing gimmick attempted with other cars such as a Prius, a Porsche, a Cadillac and Ferrari.

The funny thing is, you never read a follow-up article that shows how this marketing technique/gimmick was successful.

JohnDeereLM

A buyer for the condo in Jhoanna’s article would have the financial wherewithal to buy their own Tesla and likely isn’t thinking about buying a car during their visit to the property.

We don’t see these extreme marketing gimmicks tried with low margin properties. “If I buy this $75,000 condo I get a free Tesla!” Of course not – the condo seller in this “Tesla” story is telegraphing to a potential buyer the listing is over priced.

Yes, in a typical suburban transaction, a seller may throw in a used lawnmower to close the sale, but this is not something that is usually promoted during the actual marketing of the property.

NEWSFLASH Buyers are a lot smarter than this Tesla-giving away seller is giving them given credit for.

Tags: , , , , , , , ,


PIX11 TV Segment on Manhattan-Brooklyn Rental Report

June 13, 2014 | 8:28 pm | | TV, Videos |

pix11rentalreport
[click to play]

Got a call yesterday from John Ford, a reporter for PIX11 regarding the publication of Douglas Elliman’s Manhattan & Brooklyn Rental Report I author for Douglas Elliman.

He’s a very nice guy and really listened to and presented the key findings of the report. Luciane Serifovic, Elliman’s Director of Rentals made a couple of good points as well. Fun!

Tags: , ,


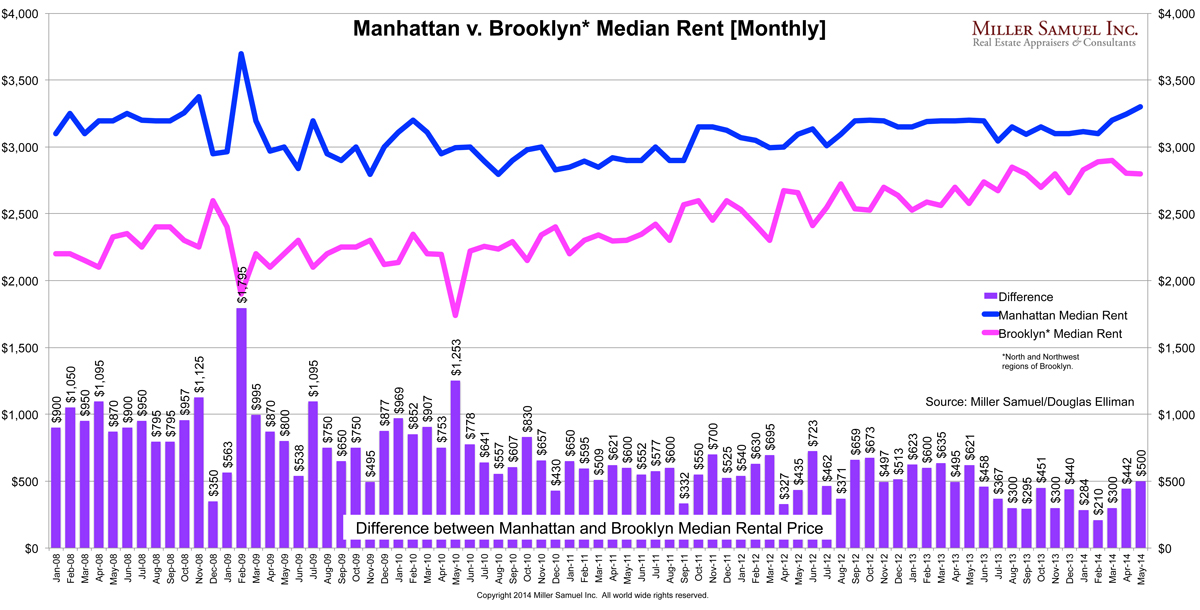
Manhattan-Brooklyn Rental Price Spread Widens to $500

June 12, 2014 | 3:15 pm | | Charts |

2014-5Brooklyn-Manhspread
[click to expand]

The report we author for Douglas Elliman covering the Manhattan/Brooklyn rental markets was published today.

Back in February many observers of the Manhattan and Brooklyn rental markets were saying: “The Spread is Dead, Long Live the Spread!” Ok not really.

But there was a lot made of the fact that the difference in median rental price between the two markets narrowed to $210 from as much as $1,125 in 2008. Manhattan rental prices had stabilized at the end of last year as Brooklyn continued to see sharp gains.

But that was as close as it got. Since the beginning of the year, month-over-month Manhattan rental prices began to rise as Brooklyn started to level off.

Manhattan rents cooled last year as the sales market poached demand from record volume. I saw the decline was temporary. The excess purchase activity from several years of pent-up demand has largely been absorbed allowing rents to begin climbing again.

Brooklyn rents are beginning to level off as a result of all the new rental development entering the market soaking up demand.

Tags:


May 2014 Report: Manhattan and Brooklyn Rentals Swap Roles

June 12, 2014 | 1:29 pm | | Reports |

Rental_0514 Today Douglas Elliman published the Manhattan/Brooklyn rental report that I author. This monthly report is part of an evolving market report series I’ve been writing for Douglas Elliman since 1994 (20 years!). We discontinued the quarterly rental report series but still present the information in our aggregate database.

MANHATTAN
– Median rental price increased to the highest level in more than 5 years.
– After softening in late 2013 with intensive competition from the sales market, median rental prices have trended higher since the beginning of 2014.
– Although the market share of landlord concessions edged higher over the year ago level last year, they have fallen sharply from 13.1% in January.
– Vacancy rate slipped nominally from same period last year, hovering near multi-year lows.
– New rental activity fell reflecting the increased likelihood that tenants would renew their leases as a result of limited alternatives to increased affordability.

BROOKLYN
[North, Northwest Regions]
– Median rental price increased from the same period last year but has showed some stability since the beginning of the year.
– 2 and 3-bed apartments showed weaker price trends with the addition of new rental housing stock and intense competition from the purchase market.
– There was a sharp drop in new rentals from the same month a year ago as more tenants were resigned to sign their leases at time of renewal.
– Although marketing times expanded slightly, negotiability dropped sharply reflecting the ongoing tight market conditions.

Here’s an excerpt from the report:

MANHATTAN For the third consecutive month, median rental price increased above the prior year level. Median rental price was $3,300, 3.1% above the same period last year and the highest level reached since early 2009. After weakening in the second half of 2013 from intensive competition from the sales market, median rental prices have generally trended higher since the beginning of the year. The remaining rental price indicators were mixed. Average rental price slipped 1.2% to $3,902 and average rental price per square foot increased 7.1% respectively from the same month last year…

BROOKLYN Median rental price increased 8.6% to $2,800 from the same month last year, yet remained essentially unchanged from the prior month. Since the beginning of the year, median rental price has showed some stability on a month-over-month basis…

The Elliman Report: 5-2014 Manhattan/Brooklyn Rentals [Miller Samuel]
The Elliman Report: 5-2014 Manhattan/Brooklyn Rentals [Douglas Elliman]
Miller Samuel Aggregate Database [Miller Samuel]
Chart Gallery (Brooklyn Monthly) [Miller Samuel]
Chart Gallery (Manhattan Monthly) [Miller Samuel]
Chart Gallery (Manhattan Quarterly) [Miller Samuel]

Tags: , ,


[Video] TRD Forum: Getting A Sense of the New Development Frenzy

May 23, 2014 | 4:24 pm | | TV, Videos |

I stumbled across this clip taken at the recent New Development Showcase hosted by The Real Deal. The publisher and founder, Amir Korangy, pulls off a couple of well-timed video-bombs!

This video gives you a good sense of the excitement, if not frenzy in the residential development space in New York City. There was a long line of people waiting to enter the venue for the event when I arrived.

Tags: , , , ,


Contrary To Popular Belief, The World Has Manhattan All Wrong

May 18, 2014 | 11:00 am |

nycsubway1969timelife
[Source: Time-Life]

Today, when I speak to friends and relatives in other parts of country, I find a consistency in the image Manhattan currently conveys and it’s completely skewed. Here’s a little background.

1985 to 1995 [Wild West] I moved to Manhattan in 1985 and it was perceived by outsiders as a very dangerous place. “Manhattan-bashing” was in vogue. My relatives in the Midwest saw Manhattan as a place where tourists were getting mugged and stabbed in broad daylight (It didn’t help that my father was mugged twice in Midtown outside of our office in broad daylight on a weekday). They feared for our lives.

1996 to 2000 [Dot Com Boom] Manhattan now had “Silicon Alley” as well as NASDAQ – which was soaring. Midwesterners were caught up in the stock market frenzy as evidence by conversations of trades of Microsoft and Caterpillar stock over potato salad and cheeseburgers and bottles of Faygo.

2001 to 2008 [9/11 to Development Boom to Lehman] The 9/11 tragedy struck New Yorkers hard but the subsequent rise of NYC from the ashes into an eventual new development housing boom was simply amazing. The Manhattan housing boom peaked in 2008, two years after the US housing market had peaked. This period ended with the collapse of Lehman Brothers and access to credit worldwide immediately evaporated.

2009 to 2010 [Collapse and Rebound] There was a surprisingly rapid improvement in the regional economy in the year following Lehman’s collapse and housing rebounded faster than expected.

2011 to 2014 [Playground of Wealthy Foreigners] Manhattan and Brooklyn become a favorite safe haven for international investors to park their money in real estate.

But now we stuck with a Manhattan housing market exaggerated stereotype (represents 90% of media coverage) in 2014:

  • Most sales are all-cash transactions.
  • Most purchasers are made by foreign buyers.
  • Most sales are millions of dollars (i.e. $5M and up).

When in fact, the 2014 Manhattan housing market reality is:

  • 45% of sales are all-cash transactions.
  • Foreign buyers are a small part of the market – i.e. 60% of all sales are co-ops and foreigners don’t purchase them.
  • More than half of all sales are below $1M (i.e. $5M+ is way up in the top 5%).

Tags: , ,


[Infographic] Manhattan and Brooklyn Rents Continue to Rise

May 17, 2014 | 8:55 pm | | Infographics |

Here’s the latest infographic from Douglas Elliman covering the Manhattan & Brooklyn rental market reports for April 2014.

April2014 Manhattan Brooklyn Rentals


Manhattan/Brooklyn Rents Continue to Rise

May 15, 2014 | 10:24 am | | Reports |

Rental_0414

Douglas Elliman published the Manhattan/Brooklyn rental report that I author today. This monthly report is part of an evolving market report series I’ve been writing for Douglas Elliman since 1994. We discontinued the quarterly rental report series but still present the information in our aggregate database.

MANHATTAN
– Second highest median rental price reached in over 5 years (highest was one month spike to $3,695 in Feb-09).
– Second consecutive month with year-over-year rise in median rent after 6 consecutive monthly declines.
– The vacancy rate was the lowest for an April in 4 years, falling to 1.45% from 1.58% a year ago.
– Market share of landlord concessions was up slightly from last year to 6.8%, but down from recent January peak of 13.1%.
– The number of new rentals slipped 6.2%, as landlords and tenants have remained more in sync for the 3rd consecutive month.

BROOKLYN
[North, Northwest Regions]
– Median rental price up year-over-year for the 11th consecutive monthly increase.
– New rental activity surged 57.1% as tenants pushed back against rising rents at time of renewal.
– Marketing times and negotiability expanded from a year ago, but remained stable over the past 3 months.
– Studios showed the largest rise in median rental price. 1-bedrooms and 2-bedrooms also increased.
– Brooklyn median rent was $442 less than Manhattan median rent, up from $210 record low in February.

Here’s an excerpt from the report:

MANHATTAN Median rental price increased 1.6% to $3,247 from the same period last year to the second highest level in more than 5 years. This was the second consecutive year-over-year monthly increase after 6 consecutive months of decline, largely attributable to a higher than normal sales volume in 2013. The robust sales market provided competition, poaching some rental demand as “fencesitters” concerned about rising mortgage rates opted to purchase. Average rental price rose 5.1% to $4,008, the second time the $4,000 threshold was exceeded in the past 4 years. The overall rise in rental prices was largely seen in the studio and 1-bedroom markets with year-over-year gains of 4.2% and 1.4% respectively…

BROOKLYN The 11th consecutive increase, median rental price increased 3.9% to $2,805 from the same month last year, but fell 3.3% from the prior month record of $2,900. Average rental price followed a similar pattern rising 6.4% to $3,209 over the same period. Despite the rising trend, month over month rental price trends for all indicators have showed relative stability since the beginning of the year…

The Elliman Report: 4-2014 Manhattan/Brooklyn Rentals [Miller Samuel]
The Elliman Report: 4-2014 Manhattan/Brooklyn Rentals [Douglas Elliman]
Miller Samuel Aggregate Database [Miller Samuel]
Chart Gallery (Brooklyn Monthly) [Miller Samuel]
Chart Gallery (Manhattan Monthly) [Miller Samuel]
Chart Gallery (Manhattan Quarterly) [Miller Samuel]

Tags: ,


Ready, Set, Download: 1Q 2014 Market Reports for Brooklyn, Queens and Westchester/Putnam Sales

April 12, 2014 | 1:49 pm | |

We released 3 reports for Douglas Elliman on the sales markets for Brooklyn, Queens and Westchester/Putnam this week. Click on the reports to download!

Brooklyn_1Q_2014 BROOKLYN The Brooklyn housing market was characterized by more modest price growth and chronic lack of inventory, holding back sales growth. Median sales price expanded 1% to $520,000 from the same period last year and the highest first quarter result in 6 years. Average sales price grew 7.3% to $681,182 over the same period. Co-ops posted the largest year-over-year gain in median sales price, rising 12.2% to $340,000 but lost 2.1% of the market share. Condos remained essentially unchanged over the year with a $625,000 median sales price and market share edged 1.6% higher. The 1-3 family median sales price increased 5.1% to $588,733 and market share increased a nominal 0.5%…

Queens_1Q_2014 QUEENS The first quarter Queens housing market was a period of rising prices after an extended period of stability, declining inventory, and rising sales. The bottom of the multi-year decline of listing inventory may have been reached in the fourth quarter of 2013. Although the first quarter listing inventory increased 7% from the prior quarter bottom to 5,617, it was the second lowest level recorded in this report series since 2005 and 13.5% below prior year levels. The number of sales jumped 32.8% to 3,156 from the prior year quarter, the highest first quarter total in 6 years. The combination of declining inventory and rising sales led to a faster market pace. The absorption rate, the number of months to sell all listing inventory at the current pace of sales, fell to 5.3 months, less than half the 11.2 month average over the past 5 years…

Westchester_1Q_2014 WESTCHESTER The Westchester housing market saw the most first quarter sales in 7 years, the highest median sales price in 6 years and initial signs that the trend of declining inventory may be ending. There were 1,525 sales in the first quarter, up 13.1% from the prior year quarter and the most first quarter sales since the same period 7 years ago. Listing inventory fell 3.7% to 5,378 from the same period last year and for the 8th consecutive quarter. With the rise in the number of sales and the decline in listing inventory, the pace of the market was faster. The monthly absorption rate, defined as the number of months to sell all inventory at the current pace of sales, fell by 1.8 months to 10.6 months from the prior year quarter…
PUTNAM After bottoming out two years ago, housing prices have generally trended higher as the number of sales expanded and inventory contracted. All price indicators posted gains from prior year levels. Median sales price increased 12.7% to $302,500 while average sales price rose 15.9% to $379,217 over the same period…

Tags:


Brooklyn Rentals: Coolness doesn’t come free

April 11, 2014 | 10:07 am | Public |

4-2014qzmanhattan-brooklyn-rentspread [Source: Quartz]

Rob Ferdman over at Quartz writes a great breakdown of the narrowing rental spread between Manhattan and Brooklyn using the data I crunch for The Elliman Report: Manhattan & Brooklyn Rentals. Here’s my version of the chart.

After I designated last week’s Bloomberg story headline “Brooklyn’s Hipster Economy Challenges Manhattan Supremacy” as my favorite new phrase, specifically:

Brooklyn’s Hipster Economy

Quartz has given me a new favorite phrase (see under original chart):

Coolness doesn’t come free

.

Tags: , , ,


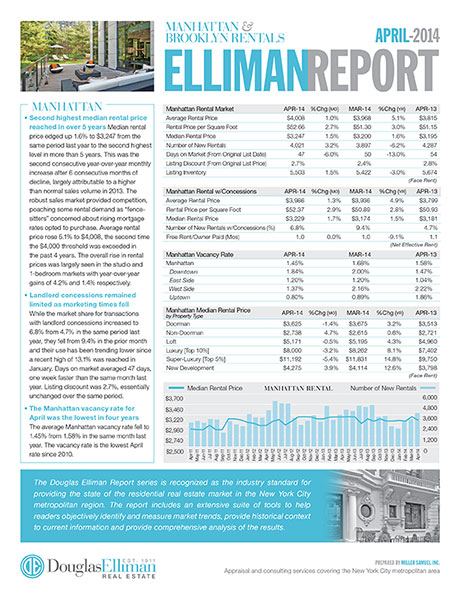
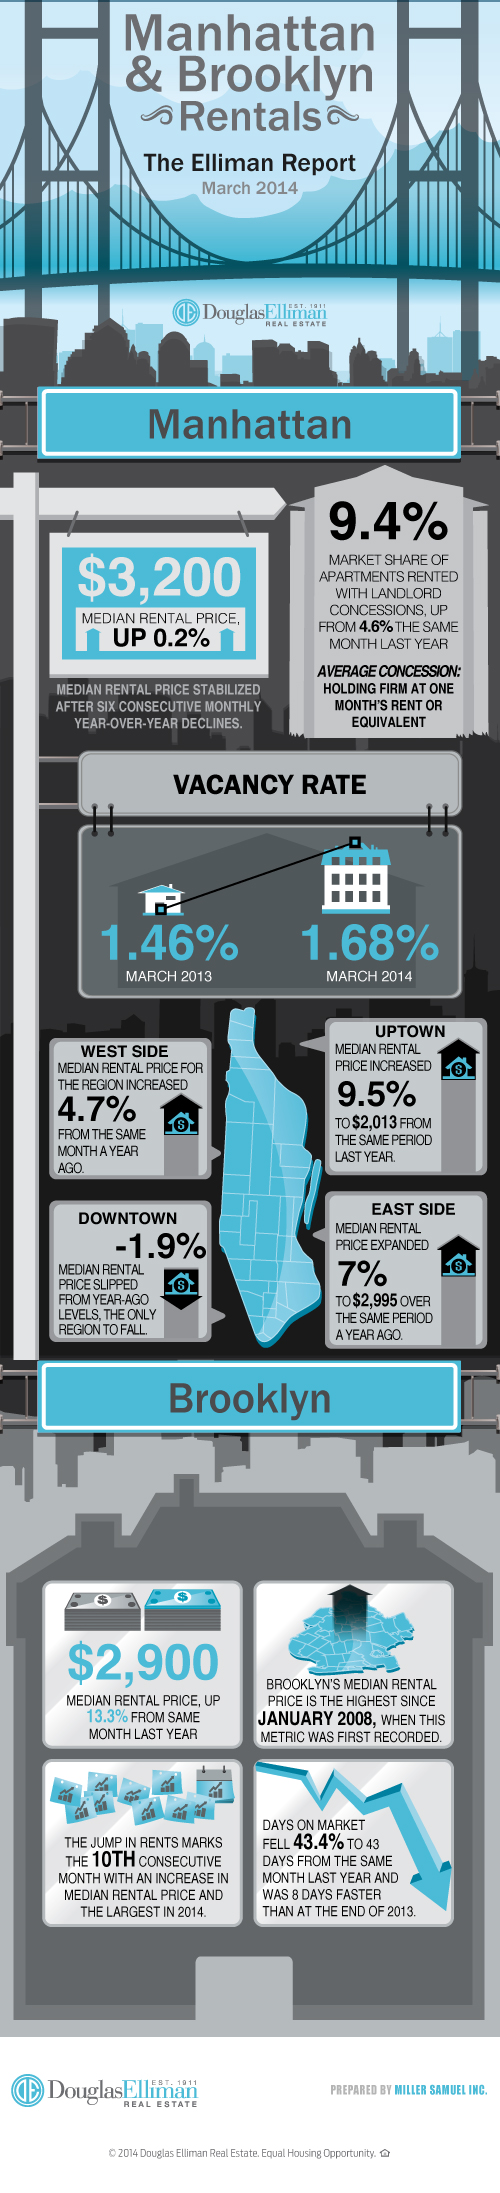
[Infographic] Looking at the Manhattan and Brooklyn Rental Markets 3-2014

April 10, 2014 | 12:00 pm | | Infographics |

Entering the world of infographics, here are some highlights from our just released Elliman Report: Manhattan & Brooklyn Rentals 3-2014

ManhattanBrooklyn3-14INFOGRAPHIC

Get Weekly Insights and Research

Housing Notes by Jonathan Miller

Receive Jonathan Miller's 'Housing Notes' and get regular market insights, the market report series for Douglas Elliman Real Estate as well as interviews, columns, blog posts and other content.

Follow Jonathan on Twitter

#Housing analyst, #realestate, #appraiser, podcaster/blogger, non-economist, Miller Samuel CEO, family man, maker of snow and lobster fisherman (order varies)
NYC CT Hamptons DC Miami LA Aspen
millersamuel.com/housing-notes
Joined October 2007