Matrix Blog

Douglas Elliman

[Three Cents Worth #288 Hamptons] Comparing Price Trends in the Hamptons and Manhattan

June 3, 2015 | 6:25 pm | | Charts |

It’s time to share my Three Cents Worth (3CW) on Curbed Hamptons, at the intersection of sand dunes and real estate in the East End of Long Island, NY.

Check out my 3CW column on @CurbedHamptons:

Now that we’ve crossed over into June, I thought I’d illustrate the price trend relationship between the Hamptons and Manhattan. The former seeing a majority of single family sales and many second home purchases. The latter with a housing market of 98% apartments and single family family sales are a rounding error. Despite the differences in their housing stock, their behavior in terms of price trends has been similar over the past decade…

3cwH6-1-15

[click to expand charts]


My latest Three Cents Worth column: Three Cents Worth: Comparing Price Trends in the Hamptons and Manhattan [Curbed]

Three Cents Worth Archive Curbed NY

Three Cents Worth Archive Curbed DC

Three Cents Worth Archive Curbed Miami

Three Cents Worth Archive Curbed Hamptons

Three Cents Worth Archive Curbed LA

Three Cents Worth Archive Curbed Ski

Tags: , , , , , , , ,


[Three Cents Worth #287 NY] Tracking New York Rents and Asking Prices Over a Century

June 3, 2015 | 6:04 pm | | Charts |

It’s time to share my Three Cents Worth (3CW) on Curbed NY, at the intersection of neighborhood and real estate in the capital of the world…and I’m here to take measurements.

Check out my 3CW column on @CurbedNY:

Back in 2011, I embarked on a fun research project for Douglas Elliman’s 100th anniversary, in which I traced how sales prices and rents changed since the 1910s. I explain in detail how I did the research here, but I ended up with a very loose proxy to represent price per square foot for sales and average monthly rents during each decade…

2015-6-1curbed

Here are some other ways to view the 100 year trend based on feedback from readers.

2015-6-1curbedDoD

2015-6-1curbedCPIDoD

2015-6-1curbedCPI

[click to expand charts]


My latest Three Cents Worth column: Three Cents Worth: Tracking New York Rents and Asking Prices Over a Century [Curbed]

Three Cents Worth Archive Curbed NY

Three Cents Worth Archive Curbed DC

Three Cents Worth Archive Curbed Miami

Three Cents Worth Archive Curbed Hamptons

Three Cents Worth Archive Curbed LA

Three Cents Worth Archive Curbed Ski

Tags: , , , , , ,


[Three Cents Worth #286 NY] How Many NYC Apartments Are Bought With Cold Hard Cash?

May 30, 2015 | 5:53 pm | | Charts |

It’s time to share my Three Cents Worth (3CW) on Curbed NY, at the intersection of neighborhood and real estate in the capital of the world…and I’m here to take measurements.

Check out my 3CW column on @CurbedNY:

The Washington Post published an article last year titled “8 in 10 Manhattan home sales are all-cash,” a statement that was (and still is) hyperbole; the actual figure was 45 percent. The data is worth revisiting, though, and I thought it might be a good time to look at the makeup of Manhattan apartment purchases in regards to cash versus financing. Obviously, there has been some confusion in the past, so I thought it would be helpful to display a year’s worth of trend data…

3cw5-27-15

[click to expand chart]


My latest Three Cents Worth column: Three Cents Worth: How Many NYC Apartments Are Bought With Cold Hard Cash? [Curbed]

Three Cents Worth Archive Curbed NY

Three Cents Worth Archive Curbed DC

Three Cents Worth Archive Curbed Miami

Three Cents Worth Archive Curbed Hamptons

Three Cents Worth Archive Curbed LA

Three Cents Worth Archive Curbed Ski

Tags: , , , , ,


[Three Cents Worth #285 Ski] Aspen Real Estate Has Had Many Peaks, But It’s Not Peaking

May 22, 2015 | 8:00 pm | | Charts |

It’s time to share my Three Cents Worth (3CW) on Curbed Ski, whether I’m on the trail or in the base lodge of a ski mountain near you…or I’m in the lift line taking notes with my gloves off.

Check out my 3CW column on @Curbedski:

For my first Three Cents Worth column on Curbed Ski, I felt compelled to provide a look at one of the priciest ski towns around: Aspen, Colorado. As a real estate analyst and appraiser for nearly 30 years (and a skier, of course!) I have relied on information culled during the research for the quarterly housing market report for Douglas Elliman. In Aspen, the first quarter of 2015 reflected a thorough shift towards larger home sales resulting in large aggregate housing prices gains…

3cwASPEN5-21-15

[click to expand chart]


My latest Three Cents Worth column: Three Cents Worth: Aspen Real Estate Has Had Many Peaks, But It’s Not Peaking [Curbed]

Three Cents Worth Archive Curbed NY

Three Cents Worth Archive Curbed DC

Three Cents Worth Archive Curbed Miami

Three Cents Worth Archive Curbed Hamptons

Three Cents Worth Archive Curbed LA

Three Cents Worth Archive Curbed Ski

Tags: , , ,


[Three Cents Worth #284 Miami] Miami Drill Down: Picking Up the Scraps of the Financial Crisis

May 21, 2015 | 8:00 pm | | Charts |

It’s time to share my Three Cents Worth (3CW) on Curbed Miami, at the intersection of neighborhood and real estate in the Magic City. And I’m taking notes on the beach.

Check out my 3CW column on @CurbedMiami:

As we make our way through the second quarter (more than halfway!), I took a look at some trends extracted from the first quarter reports we prepare for Douglas Elliman. I went all out and created a four charter that addresses a number of issues born out of the financial crisis that still touch the current market..

3cw5-20-15

[click to expand chart]


My latest Three Cents Worth column: Three Cents Worth: Miami Drill Down: Picking Up the Scraps of the Financial Crisis [Curbed]

Three Cents Worth Archive Curbed NY

Three Cents Worth Archive Curbed DC

Three Cents Worth Archive Curbed Miami

Three Cents Worth Archive Curbed Hamptons

Three Cents Worth Archive Curbed LA

Three Cents Worth Archive Curbed Ski

Tags: , , ,


[Three Cents Worth #283 LA] How Much Does It End Up Costing When a House Lingers on the Market in Los Angeles?

May 21, 2015 | 10:00 am | | Charts |

It’s time to share my Three Cents Worth (3CW) on Curbed LA, texting at the intersection of neighborhood and real estate, just off the freeway.

Check out my 3CW column on @CurbedLA:

Since Los Angeles is all about relationships and you don’t know me (yet), I thought I’d better get started on my first Three Cents Worth Column for Curbed LA. I’ve been compiling and analyzing data for Douglas Elliman’s market report series for more than 20 years and one thing I’ve learned: there is nothing better than a good chart. For this column I thought I’d explore the relationship between days on market and listing discount and how that is changing…

3cw5-21-15

[click to expand chart]


My latest Three Cents Worth column: Three Cents Worth: How Much Does It End Up Costing When a House Lingers on the Market in Los Angeles? [Curbed]

Three Cents Worth Archive Curbed NY

Three Cents Worth Archive Curbed DC

Three Cents Worth Archive Curbed Miami

Three Cents Worth Archive Curbed Hamptons

Three Cents Worth Archive Curbed LA

Three Cents Worth Archive Curbed Ski

Tags: , , , ,


Speaking at ULI Miami Condo Market Symposium

December 30, 2014 | 8:24 pm | | Public |

ULIsoFLjjmpanel

Since it’s the end of the year, I’ve been thinking about some of my favorite events 2014. This past November, I was invited to keynote and moderate the main panel at the Urban Land Institute’s, Southeast FL/Caribbean District Council’s Miami Condo Market Symposium.

My panel included the heavy hitters of condo development and brokerage in South Florida – who spoke candidly in front of a sold out venue at the Epic Residences & Hotel:

– Ugo Colombo, Founder, CMC Group Inc.
– Eduardo Costantini, Chairman, Consultatio Real Estate Inc.
– Richard LeFrak, Chairman & CEO, LeFrak Organization
– Howard Lorber, CEO, Vector Group Ltd. & Chairman, Douglas Elliman
– Jorge Perez, Chairman, CEO & Founder, The Related Group

A recap of my panel and the other speakers and panels…

Photos…
ULIjjmkeynoteULIjjmLeFrakPerez
ULIjjmpanel13ULIjjmpanel12

Tags: , , , , , , , ,


3Q14 Manhattan Sales Market: Operating Just Below Record Levels

October 1, 2014 | 6:17 pm | | Reports |

Manhattan_3Q14

Today Douglas Elliman published the Elliman Report on Manhattan Sales that I author. This quarterly report is part of an evolving market report series I’ve been writing for Douglas Elliman since 1994 (20 years!).

Key Points
– Sales fell below last year’s third quarter record but still 29% above decade quarterly average.
– Luxury market price gains outpaced the overall market.
– Inventory is up from last year’s low but still 18% below decade quarterly average.
– New development market share of closed sales was up from year ago level, but expected to rise sharply over next year.
– Highest market share of sales at or above list price in 6 years (49.2%).

Here’s an excerpt from the report:

Manhattan housing prices continued to rise as additional supply remained inadequate to meet demand. Bidding wars and a shift toward larger units applied additional upward pressure to rising price trends. Sharp gains in New York City employment, the continued influx of international investors and low mortgage rates have kept the market tight. A product of five years of pent-up demand and the fear of rising mortgage rates, sales volume fell short of prior year records. Marketing times and negotiability eased, as the market downshifted from last year’s frenetic pace. Luxury market price growth exceeded the overall market, while new development product targeted at the luxury segment continued to enter the market…

The Elliman Report: 3Q14 Manhattan Sales [Miller Samuel]
Miller Samuel Aggregate Database [Miller Samuel]
Market Chart Gallery [Miller Samuel]


North America Leads Luxury Housing Trends in 2Q14 – Knight Frank

July 30, 2014 | 12:34 pm | |

KFpgci2q14NA

Knight Frank published their quarterly Prime Global Cities Index today and North America led the way as a region with a 14.5% rise in prices. “Prime” translates to “Luxury” in US housingspeak. We provide research for their Manhattan and Miami results through the Elliman Reports we prepare.

The report conclusion succinctly summarizes the state of high end housing today and speaks to the global phenomenon:

…the index’s annual increase of 6.2% in the year to June is above the long-run average of 4.6% recorded since Lehman’s collapse in the third quarter of 2008, underlining the extent to which prime property has become a favoured asset class globally.

Here’s the table…

KFpgci2q14
[click on table to open report]

Tags: ,


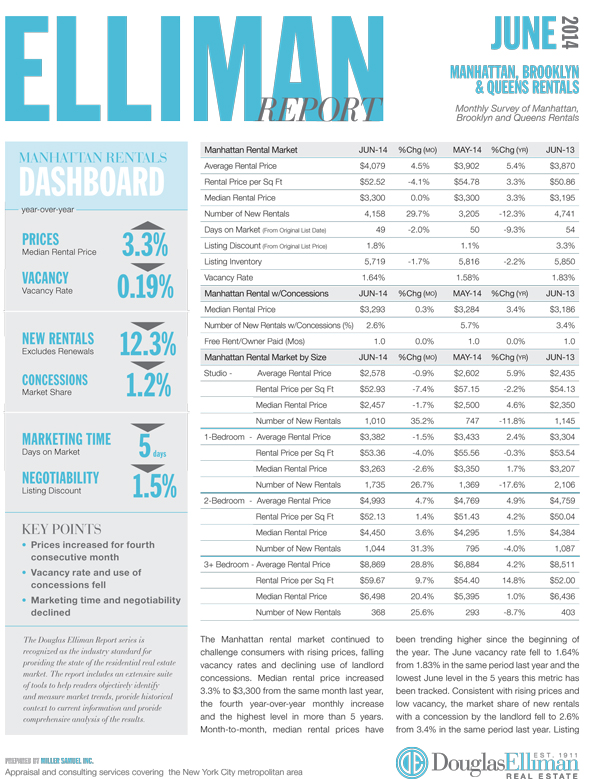
Adding Queens To Our Manhattan/Brooklyn Rental Report

July 14, 2014 | 9:12 am | | Reports |

Rental_0614

We’ve expanded the Elliman rental report to include Queens this month and added additional metrics for Manhattan and Brooklyn.

MANHATTAN
– Prices increased for 4th consecutive month after year end lull.
– Median rent is at highest point in more than 5 years.
– The vacancy rate was lowest June in 5 years.
– Use of concessions continued to fall, now at nominal levels.
– Marketing times and negotiability continued to fall.
– Luxury market outperformed the overall market.

BROOKLYN
[North, Northwest, East Regions]
– Median rental price up year over year for 13 consecutive months.
– Rents hovering near record highs but have remained stable since beginning of year.
– New rentals surged indicating resistance to price increases at time of renewal.
– Nominal use of concessions by landlords.
– Overall market outperformed luxury market, price growth stronger in smaller units.
– Manhattan-Brooklyn rental price gap remained at $500, more than the $210 record low in February but less than half of 2008 level.

QUEENS
[Northwest Region]
– Median rental price year-over-year slipped after 4 consecutive monthly increases.
– Shift in mix to smaller units (60.2% share of 1-bedrooms) pulling down overall prices.
– Nearly half of the rental stock is located in new development buildings.
– Overall market outperformed luxury market, price growth stronger in smaller units.
– Marketing time slipped as listing discount remained nominal.


The Elliman Report [Miller Samuel]
Miller Samuel Aggregate Database [Miller Samuel]
Chart Gallery [Miller Samuel]


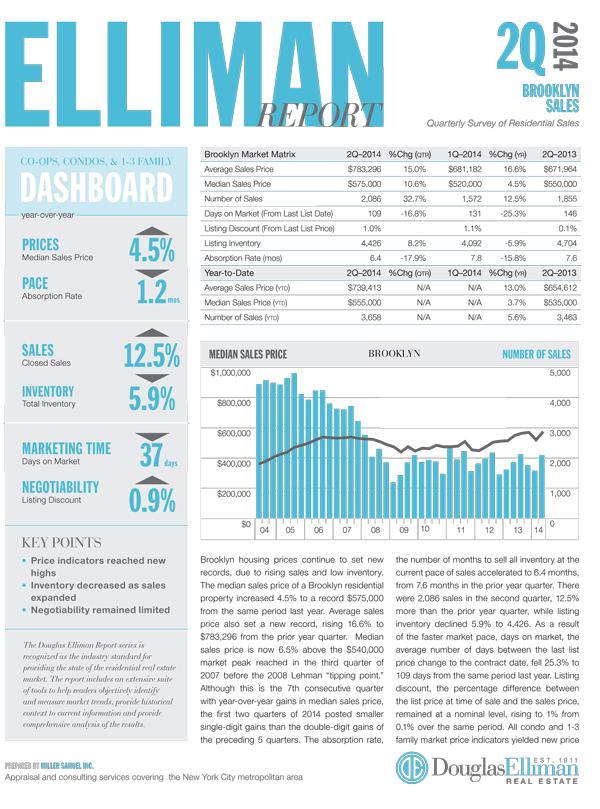
2Q14 Brings Mixed Regional Messages – Brooklyn, Queens and Westchester/Putnam Reports

July 14, 2014 | 8:53 am | | Reports |

If you’ve been:

A. Pouring over state maps of pet ownership
B. Watching the World Cup
C. Watching the Tour de France
D. Fretting about the Russell Stover purchase

Then you may have missed last week’s market report releases for Brooklyn, Queens and Westchester/Putnam Reports. These are part of the report series I’ve been writing for Douglas Elliman since 1994 (20 years!). The reports have a new look – hope you like them.

Click on graphics to open them.

Brooklyn_2Q_2014

BROOKLYN SALES MARKET Brooklyn housing prices continue to set new records, due to rising sales and low inventory. The median sales price of a Brooklyn residential property increased 4.5% to a record $575,000 from the same period last year. Average sales price also set a new record, rising 16.6% to $783,296 from the prior year quarter. Median sales price is now 6.5% above the $540,000 market peak reached in the third quarter of 2007 before the 2008 Lehman “tipping point.” Although this is the 7th consecutive quarter with year-over-year gains in median sales price, the first two quarters of 2014 posted smaller single-digit gains than the double-digit gains of the preceding 5 quarters…

Queens_2Q_2014

QUEENS SALES MARKET The Queens housing market took a breather after 6 consecutive quarters of rising sales. There were 2,404 sales in the second quarter, 3.6% less than the same period last year. Year to date, the number of sales remained 14.2% higher than the same period last year due to the sharp rise in first quarter sales activity. Despite the decline, listing inventory continued to fall for the 13th consecutive quarter. There were 5,892 listings at the end of the second quarter, 5.3% less than the same period last year. As a result of the combination of declining sales and falling inventory, the pace of the market remained stable…

Westchester_2Q_2014

WESTCHESTER/PUTNAM SALES MARKET Westchester single family contract activity was higher than prior year levels as severe winter weather conditions pushed first quarter pending sales into the second quarter. Despite the 16.7% decline in closed home sales, total contracts expanded 3.9% from the prior year quarter and jumped 51.9% from the prior quarter. The rise in contracts from first to second quarter was higher than the 35.5% average increase of the prior 2 years. Listing inventory expanded 7.9% to 3,905 rising from the low water mark set in 2013…


Miller Samuel Aggregate Database [Miller Samuel]
Market Chart Gallery [Miller Samuel]


2Q14 Manhattan Sales Market: More Supply, But Not Even Close to Enough

July 1, 2014 | 5:55 pm | | Charts |

Manhattan_2Q_2014

Today Douglas Elliman published the Elliman Report on Manhattan Sales that I author. This quarterly report is part of an evolving market report series I’ve been writing for Douglas Elliman since 1994 (20 years!).

Incidentally, we are tweaking the visual aspects of this Elliman report series – we do this every few years. We added a dashboard to provide at-a-glance information but expanded and yet consolidated the text to be one comprehensive section. I expanded the size of the charts but kept the matrix tables just about the same. Since this is a labor of love and a work in progress, please feel free to send along suggestions.

Key Points
– Sales increased for the 7th consecutive quarter, but less at a lower rate than the 27.6% average quarterly increase of the prior 4 quarters.
– Median sales price for co-ops increased 9% as consumer sought out greater affordability as condos increased 0.8%.
– Inventory is up from last year’s near record low. The inventory bottom appears to have been reached in 4Q 2013.
– There were 45.9% listings that sold at or above list price, the largest market share in nearly 6 years.
– Luxury price increases out paced the overall market.
– Sellers are being both motivated and enabled to list as a result of rising prices.
– Mortgage lending remains significantly challenging to buyers.

Here’s an excerpt from the report:

Manhattan housing prices continued to press higher, driven by low inventory and seven consecutive quarters of year-over-year sales growth. Mortgage rates have drifted lower, nearly returning to their prior year levels while the local economy has added jobs and international demand for product has been relentless. The luxury market showed the most price gains as more new development product has begun to close…

Here is some context on the lack of inventory [click each chart to expand]:

2q14Manhattan-inventorybyMonth

2q14Manhattan-inventorySPLIT


The Elliman Report: 2Q14 Manhattan Sales [Miller Samuel] Miller Samuel Aggregate Database [Miller Samuel] Market Chart Gallery [Miller Samuel]

Get Weekly Insights and Research

Housing Notes by Jonathan Miller

Receive Jonathan Miller's 'Housing Notes' and get regular market insights, the market report series for Douglas Elliman Real Estate as well as interviews, columns, blog posts and other content.

Follow Jonathan on Twitter

#Housing analyst, #realestate, #appraiser, podcaster/blogger, non-economist, Miller Samuel CEO, family man, maker of snow and lobster fisherman (order varies)
NYC CT Hamptons DC Miami LA Aspen
millersamuel.com/housing-notes
Joined October 2007