Matrix Blog

Douglas Elliman

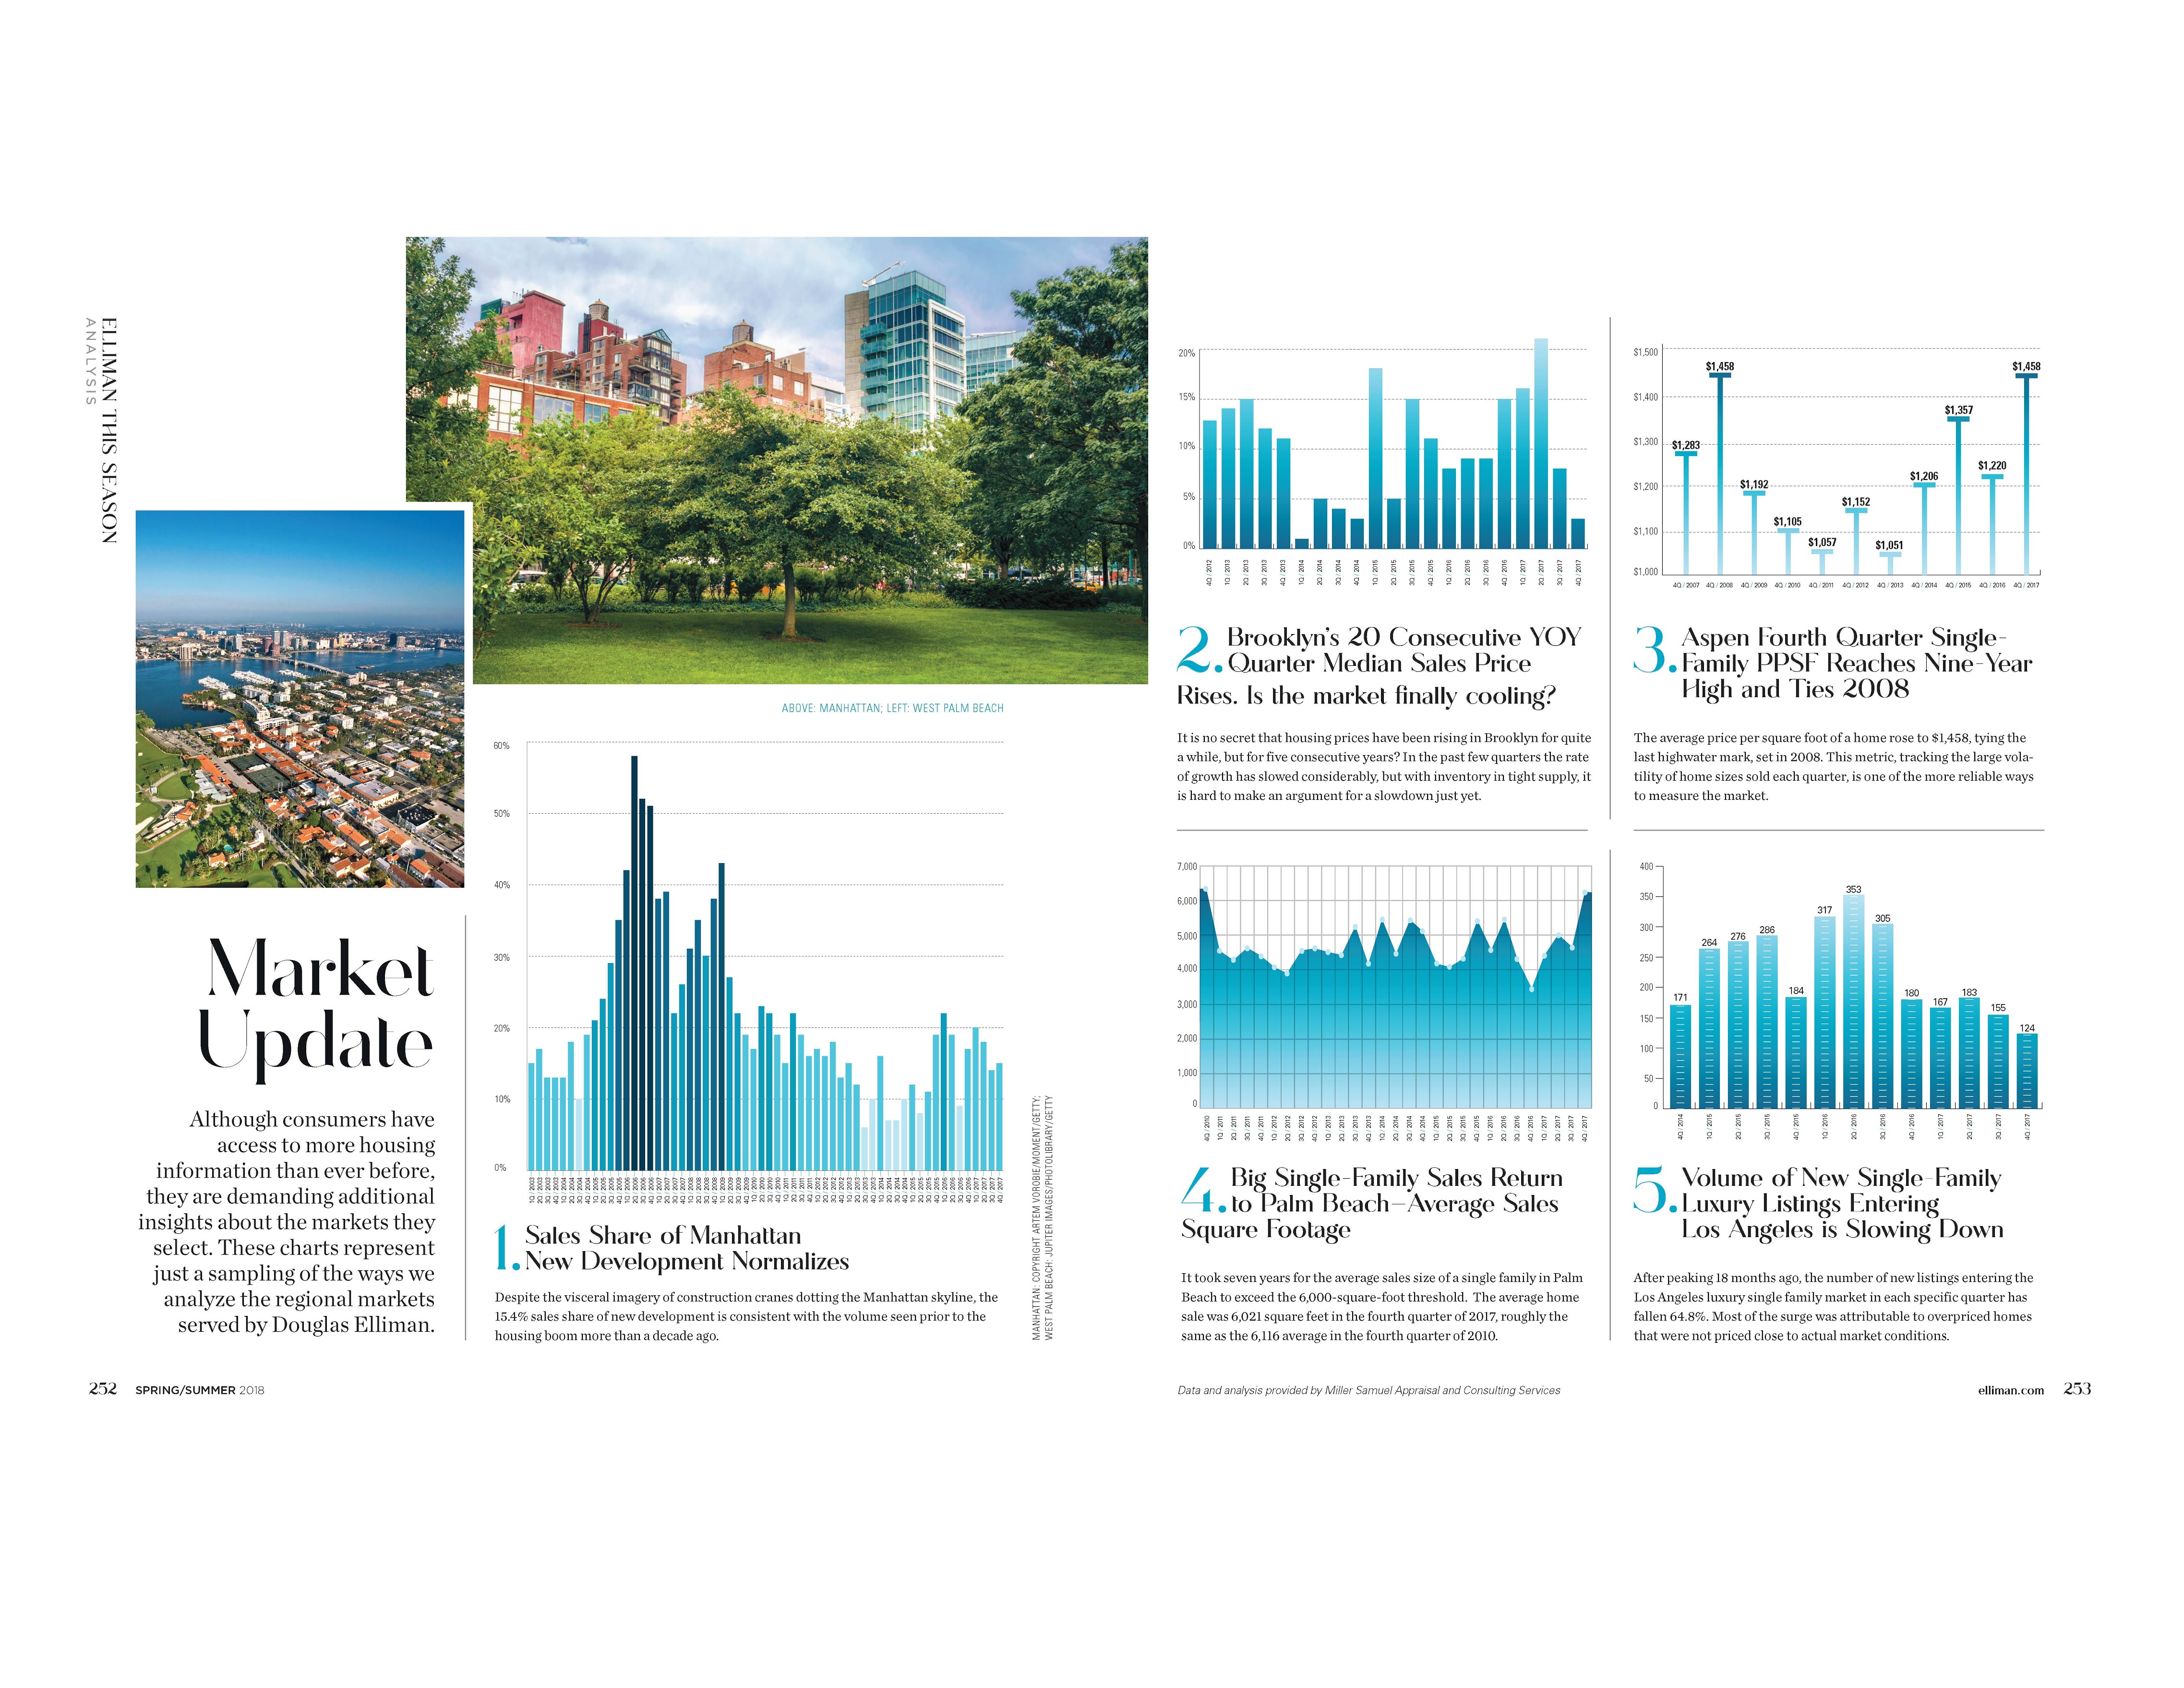
Elliman Magazine Spring Edition – 5 Charts

April 15, 2018 | 4:10 pm | | Infographics |

Every seasonal edition, Douglas Elliman Real Estate asks me to provide a visual market update for their magazine in any 5 of the markets they cover nationwide. The following graphic is found in their latest Elliman Magazine.

Click on the following graphic to see my charts in all their majesty.

Tags:


[Media] Bloomberg Markets Interview January 11, 2018

January 11, 2018 | 11:07 pm | | Milestones |

So I was walking down Fifth Avenue in Midtown Manhattan in the late morning after a meeting and got a call from Bloomberg TV. Apparently, two different stories that featured two of the market reports I author – published by Douglas Elliman – were the number one and two most emailed on the Bloomberg Terminals worldwide.  They wanted to talk about them.

So I took a left and walked over Bloomberg HQ.  Got to speak with Vonnie Quinn and Shery Ahn on set – who knew how to make an interview go well.

This is a 2-minute clip of the 5-minute interview, but you’ll get the gist. I’ll expand on this discussion tomorrow at 2 pm when my weekly Housing Note is released.

[click to view video]

Tags: , , ,


Real Estate ChartArt in Elliman Magazine’s Fall 2017 Issue

September 18, 2017 | 3:12 pm | | Charts |

Douglas Elliman Real Estate just published their fall issue. I created the content for pages 208-209 and I think it looks pretty snazzy (and interesting).

Click on image below to expand.

EllimanMag

Tags:


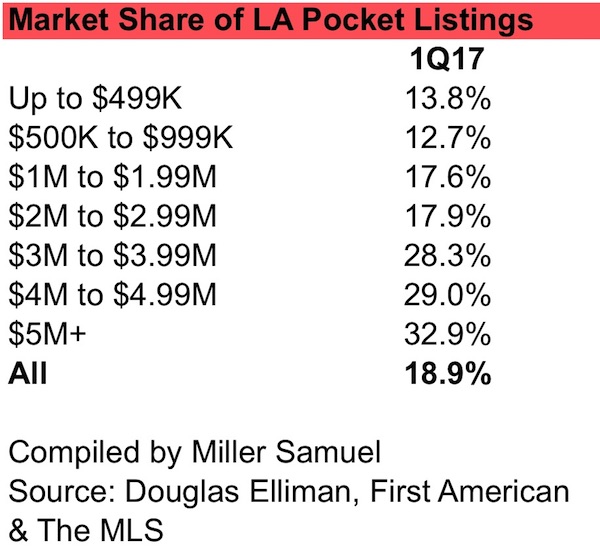
Pocket Listings: Appreciating Los Angeles Sales We Didn’t Know About

April 27, 2017 | 1:00 pm | |

We took a look at the pocket listing phenomenon in Los Angeles.

I’ve been authoring an LA housing market report for Douglas Elliman as part of their expanding Elliman Report series I’ve been authoring for 23 years. The report covers their firm’s LA footprint, namely the Westside, Downtown and other areas including Malibu.

Aside from Brooklyn, this housing market is one of the most robust we covered in 1Q17. Price growth, elevated sales and sliding inventory remained the theme.

We matched public record closings with properties listed on the MLS. Those sales missing from the MLS were either FSBOs or “pocket listings.” I don’t have a great way to separate the two at this point but I’m inclined to believe the higher the price, the more likely the sale was a pocket listing.

The chart shows that about 19% of all sales are not shared through the MLS. But even more interesting is the pattern shown by price. Approximately one-third of all sales over $5 million are missing from the MLS.

Tags: , ,


[In The Media] Bloomberg TV: October 4, 2016

October 6, 2016 | 8:00 pm | | TV, Videos |

bbtv10-4-2016

Had a nice chat with Scarlet Fu and Matt Miller on Bloomberg TV, to discuss our 3Q2016 report on the Manhattan residential sales market that I author for Douglas Elliman. We referred to Oshrat Carmiel’s Bloomberg News story on the Manhattan housing market that went viral on the Bloomberg Terminals as the number one read story world wide and the story chart made their “Chart of the Hour” on their home page.

10-4-16bbmostread

bb10-4-16chart

10-4-16bbchartofhour

Tags: , , ,


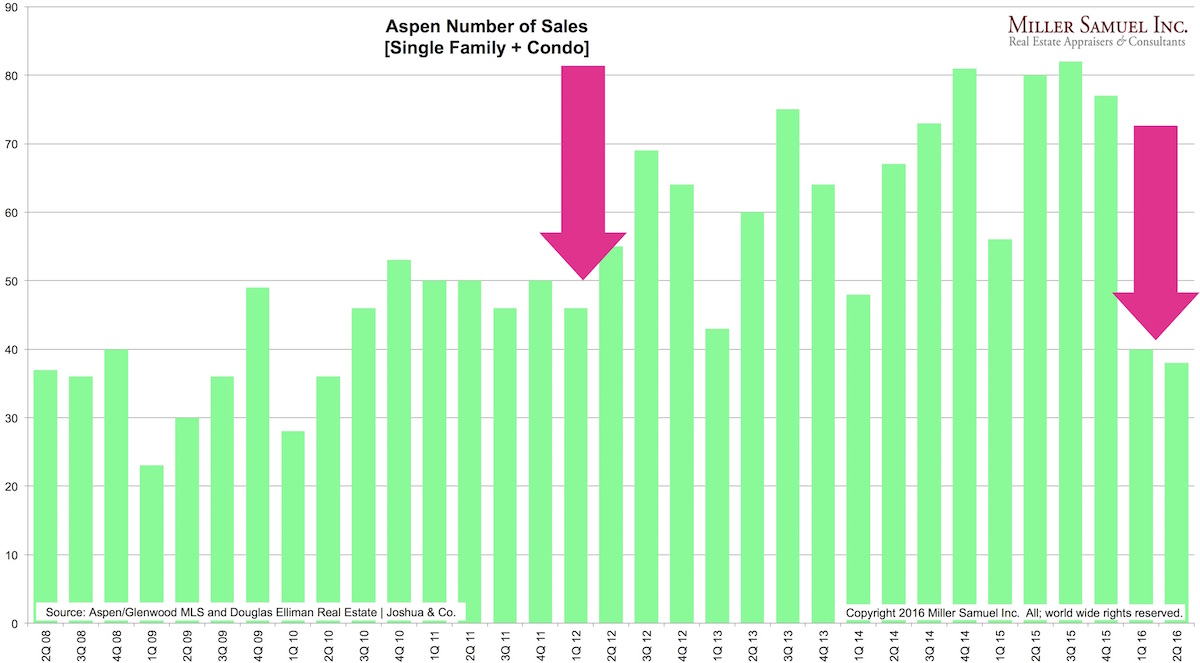
Aspen Sales “Nosedive” as U.S. Luxury Market Returns to Sea Level

August 16, 2016 | 3:40 pm | | Charts |

2q16aspen-NOS

When compared to the rest of the U.S. housing market, Aspen Colorado is a really a niche luxury market with an overall median sales price of $1,407,500 in the second quarter of 2016. This was 27% higher than Manhattan in New York City – with a current condo reportedly under contract for around $250 million – whose market-wide median sales price was $1,108,500 in the same period.

I saw a Denver Post article in my twitter feed yesterday that had an SEO friendly headline: Aspen real estate in a first-ever sustained nosedive and a subtitle: Brokers struggling to explain sudden, precipitous drop in luxury real estate market.

Some noteworthy superlatives used in the article were:

  • nosedive
  • precipitous
  • sudden
  • evaporating
  • boogeyman
  • jaw-dropping

If you use the article’s June year to date residential sales volume for the entire county, it is clear that 2015 was an outlier. However because most real estate brokers on commission tend to look at the market in the short run, there was an expectation that the sales trend from 2014 to 2015 would continue into 2016. Because of the uncertainty described in the article, Aspen buyers – who are by definition “luxury” buyers – are clearly pulling back (and in many U.S. luxury markets).

2Q16pritkinsalesvolume

I author a market report that covers Aspen for Douglas Elliman’s market report series, which I began writing in 194. The year over year drop in Aspen 2Q16 sales was 52.5%. Here is the breakdown of sales at the high end:

2q16aspen-$10M

Based on the behavior of the luxury market in high end enclaves like Manhattan, The Hamptons, Greenwich, Miami and Los Angeles that are also covered in our report series, the prevailing pattern for housing remains “soft at the top” and it looks like Aspen is no exception. The impact of the 2012 on Aspen sales didn’t seem as pronounced as this year if you believe that is a significant cause. However my theory is that the heavy luxury volume of the prior year (2015) may have poached demand from 2016, exacerbated by the 2016 election and other items of uncertainty like Brexit, the U.S. economy and the financial markets.

Think snow.

Tags: , , , ,


Greenwich CT Pre-Lehman “Reno, Then Flip” Mentality Is Long Gone

February 26, 2016 | 9:41 am | | Charts |

Fairfield County, CT is one of the more recent editions to our Elliman Report series. Greenwich, CT as a submarket has proven to be a market still strongly linked to the heady days before the collapse of Lehman Brothers in 2008 and the beginning of the financial crisis. There remain many owners of high end homes purchased a decade ago that remain value-anchored to those days of yore.

I took a look at the last 15 years of residential sales, measuring the amount of time that passed from a home’s prior renovation to sale. From the late 1990s to Lehman, there was a compression of time from renovation to eventual sale, reflective of the speculative conditions leading up to Lehman. Reno a home, then sell it. During those days, business cards passed out by doctors and lawyers at Greenwich cocktail parties were either “hedge fund manager” or “developer.” Not so much anymore.

Subsequent to Lehman, the late 1990s pattern that preceded the U.S. housing bubble returned by 2010 and has remained remarkably stable since.

4Q15GR-sincelastreno

Tags: ,


Brooklyn, Queens Set Records, NYC rents jump, Westchester, Putnam and Dutchess Get Busy

October 8, 2015 | 9:05 pm | | Reports |

wsjbrooklyn3q15-600

We published a slew of research today for Douglas Elliman Real Estate:

Manhattan, Brooklyn & Queens Rentals

Manhattan Rentals – Median rental price increased year-over-year for the 18th consecutive month – Median rental price was third highest on record – Brisk employment growth and strong economic conditions kept upward pressure on rents – Mortgage lending conditions remained tight tipping would-be first-time buyers back into rental market – Strength at lower end of market remained as non-doorman rents rose faster than doorman rents – Luxury median rental price slipped, showing weakest conditions of all price segments – Inventory slipped and marketing time remained low, despite rise in vacancy rate

Brooklyn Rentals – Median rental price set a new record for third consecutive month – Median rental price exceeded the $3,000 threshold for first time – Landlord concessions remained at nominal level as inventory slipped – Rental price indicators moved higher across all size categories – Listing inventory as well as negotiability between landlords/tenants fell – Median Brooklyn rent was $288 less than Manhattan

Queens Rentals – Price indicators showed mixed results, suggesting general stability overall – Studios showed strong price growth as 1-bedrooms and 2-bedrooms were flat – New development market share comprised 30.2% of new rentals – Luxury market median price gain was modest, but exceeded the overall market – Median Queens rent was $362 less than Brooklyn and $650 less than Manhattan

Brooklyn Sales – Brooklyn median and average sales price set a new record – Brooklyn remains the only New York City borough with a median sales price above the pre-financial crisis high – Condo, co-op and 1-3 family properties set new median sales price record – Luxury housing prices followed overall market trend – Sales expanded as listing inventory declined, resulting in brisk market pace – Fastest marketing time in 8 years

Queens Sales – Queens median and average sales price set a new record – Condo median sales price set a record for second consecutive quarter – Co-op price indicators set new record – 1-3 Family price indicators set new record – Luxury price indicators set new record – Inventory declined as sales surged – Marketing time fell as negotiability expanded

Westchester County Sales (expanded) – Record number of sales for the quarter, based in historical back to 1981 – Fastest marketing time and least negotiability in the 5.5 years this metric has been measured – Listing inventory for all property types slipped from year ago levels – Absorption rate was fastest market pace in 15 years – Single family and condo median sales price indicated stability – Single family market share declined even though sales increased – Luxury price indicators slipped, out performed by overall market

Putnam/Dutchess County Sales (new)

Putnam County – Price trend indicators increased on a year over year basis – Listing inventory slipped as the number of sales surged – Based on absorption, the market pace was 17.2% faster than the year ago quarter – Marketing time and listing discount expanded despite faster market pace

Dutchess County – Price indicators suggested general stability – Single family prices edged higher as condo prices declined – The pace of the market slowed as sales declined and inventory expanded

Tags: , , ,


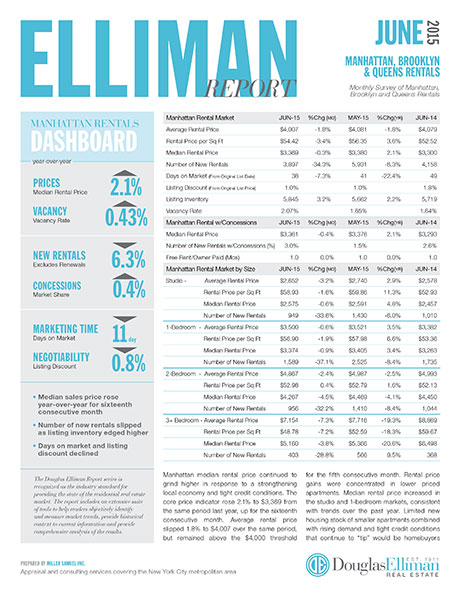
Manhattan Report 3Q15 Just Published

October 1, 2015 | 8:06 am | | Reports |

Manhattan_3Q_2015

The Elliman Report: Manhattan Sales 3Q-2015 we author on behalf of Douglas Elliman Real Estate was published today. It’s part of our report series that has been expanding since 1994.

Here’s a brief summary but I’ll provide a more thorough explanation of the results in tomorrow’s Housing Notes (don’t just stare blankly at the screen, please sign up for my free weekly newsletter here.)

  • Median sales price was second highest on record, highest since 2008
  • PPSF set 26 year record of $1,497 per sqft
  • Year-over-year sales increased for first time in a year as pent-up demand from financial crisis has been fully absorbed
  • Listing inventory growth stalled in 2015 after bottoming at the end of 2013
  • 51% of all sales were cash purchases, up from 43% a year ago
  • 53.9% of all sales were “at or above” list price at time of contract, a seven year record
  • Luxury housing prices did not see the same growth as overall market
  • Days on market was lowest (fastest) in 15 years at an average of 73 days
  • Larger price gains seen in larger apartments such as 2, 3, 4 bedrooms than studios – 1 bedrooms
  • New development market share of closed sales continued to rise

Tags: , ,


Record Queens Condo Prices: Bigger Than Crises in Greece, China

July 9, 2015 | 9:51 pm | |

Rental_0615Douglas Elliman published our research today covering Queens sales, Brooklyn sales Westchester/Putnam sales as well as the rental market for Manhattan Brooklyn & Queens. You can download the reports and more at Douglas Elliman’s market report page.

Like last week’s Manhattan report, there were lots of records set and it wasn’t simply the influence of high end sales – prices were up across the board in most markets.

Incidentally, the Bloomberg News article that covered record Queens condo sales was the second most emailed story world-wide. It stoked more interest than the finance crisis in Greece and the recent Chinese stock market gyrations. Apparently only “investors with satellites” was a more popular read.

Idea (?) for next quarter: Talk about drones and investors in the Queens housing market.

2q15queensrptBLOOMBERGTERMINALS

Tags: , ,


[Video] Yahoo! Finance w/Lauren Lyster 7-6-2015

July 6, 2015 | 2:11 pm | | TV, Videos |

Lauren Lyster put together an interesting piece called: $100 million listings?! Pros explain why this real estate market is hot, but not a bubble that explores the disconnect between this development boom and the housing bubble last decade.

Tags: , , ,


[Three Cents Worth #289 NY] Proof: Summer Is the Hardest Time to Rent in New York City

June 25, 2015 | 11:07 pm | |

It’s time to share my Three Cents Worth (3CW) on Curbed NY, at the intersection of neighborhood and real estate in the capital of the world…and I’m here to take measurements.

Check out my 3CW column on @CurbedNY:

This week I thought I’d dig out some of the residual stuff from last week’s rental report to explore the vacancy hyperbole. As far as I know, firms that present the vacancy rate (including mine) use a sampling of buildings from different neighborhoods/regions of Manhattan where building rental status is continually updated. The bottom line—and a reality check—is that the vacancy rate has always been low. It’s remained below 5 percent since at least World War II. (At least that’s what I’ve read; I only started writing for Curbed circa 2004.)…

3cwNY2015-6-17

[click to expand charts]


My latest Three Cents Worth column: Three Cents Worth: Proof: Summer Is the Hardest Time to Rent in New York City [Curbed]

Three Cents Worth Archive Curbed NY

Three Cents Worth Archive Curbed DC

Three Cents Worth Archive Curbed Miami

Three Cents Worth Archive Curbed Hamptons

Three Cents Worth Archive Curbed LA

Three Cents Worth Archive Curbed Ski

Tags: , , , ,

Get Weekly Insights and Research

Receive Jonathan Miller's 'Housing Notes' and get regular market insights, the market report series for Douglas Elliman Real Estate as well as interviews, columns, blog posts and other content.

Follow Jonathan on Twitter

#Housing analyst, #realestate, #appraiser, podcaster/blogger, non-economist, Miller Samuel CEO, family man, maker of snow and lobster fisherman (order varies)
NYC CT Hamptons DC Miami LA Aspen
millersamuel.com/housing-notes
Joined October 2007