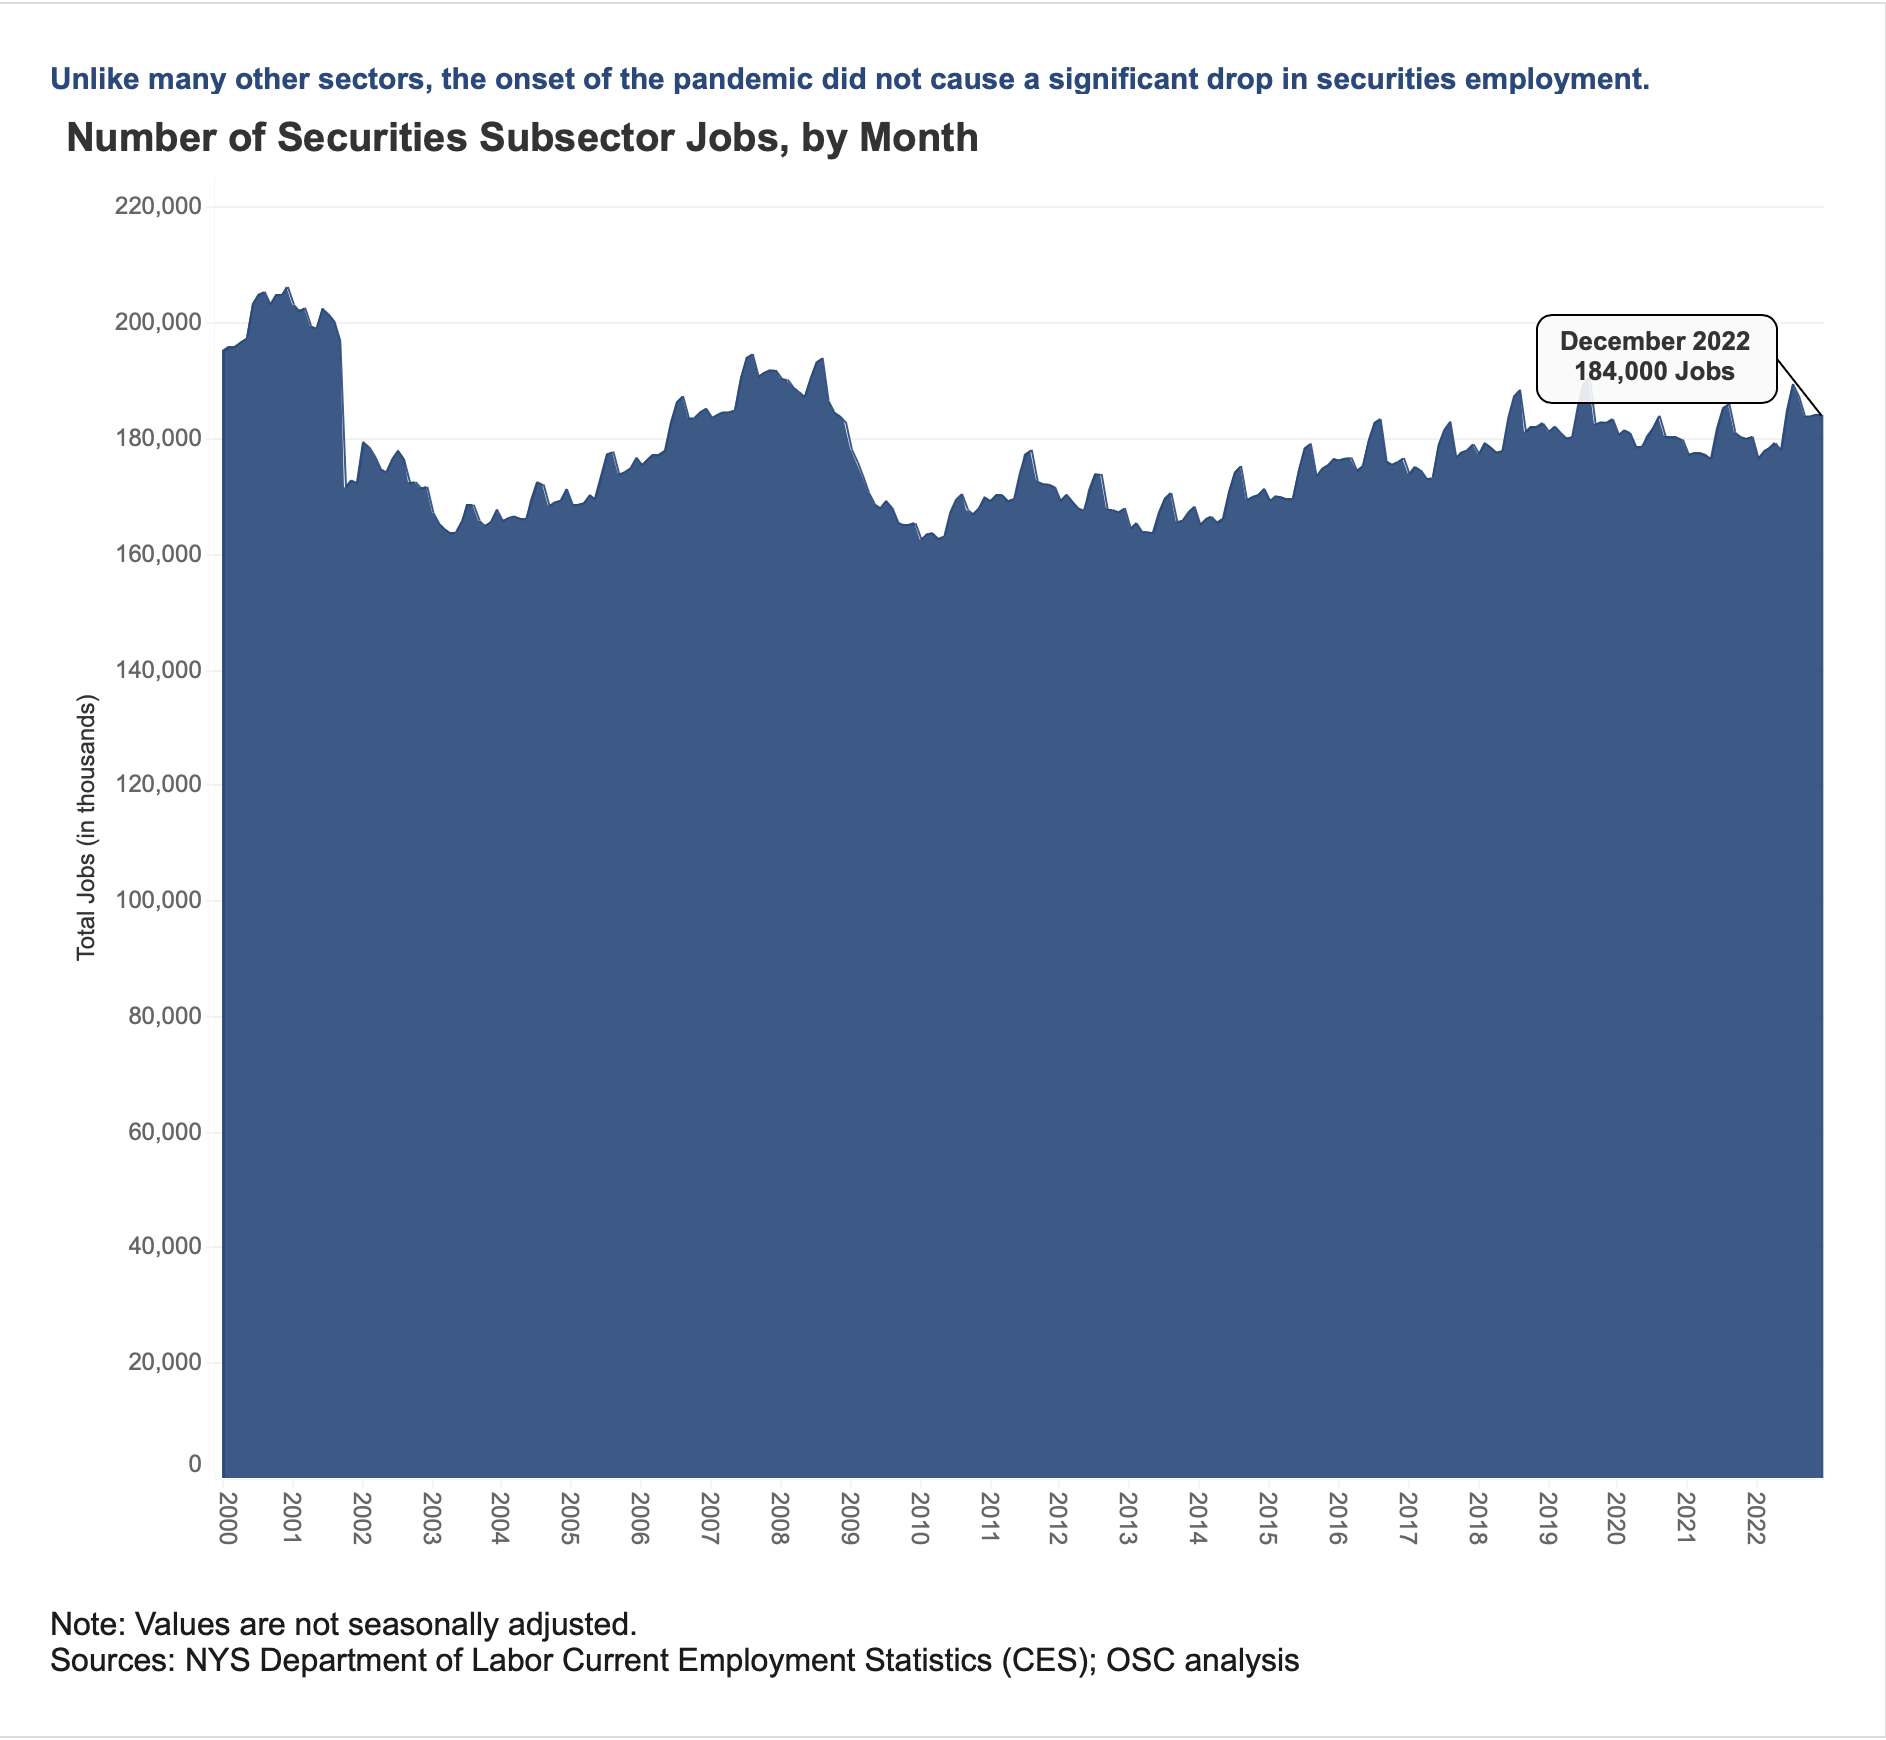
Wall Street Bonuses Fall To Pre-Pandemic Levels

April 1, 2023 | 12:26 pm | Explainer |

The Office of the New York State Comptroller released its analysis of Wall Street Bonuses for 2022 last week.

The real estate industry used to go gaga over this report before the housing bubble. But now, with so many bonuses received as deferred compensation or in a non-cash format, the Manhattan housing market no longer sees an immediate surge in demand when bonuses are announced. However, securities industry jobs seemed relatively unphased by the pandemic and the economic surge in the aftermath of the lockdown.

Wall Street’s 2022 average bonus paid to securities employees dropped to $176,700, a 26% decline from the previous year’s $240,400, according to New York State Comptroller Thomas P. DiNapoli’s annual estimate. Rising interest rates and fear of a recession led to fewer profits on Wall Street after a record haul in 2021.

I update my yearly chart series that breaks out the annual bonus results. Most notable here is the slightly diminished reliance on the securities sector, as noted by the declining salary multiplier to the private sector since the peak in 2007 and the smaller share of securities industry employment to total employment. It’s not in the chart, but the slightly lower contribution of the securities industry with its much higher-paying jobs has been partially offset by the influx of the tech sector, which pays higher wages than the overall private sector.

These chart colors are obnoxious, but their story is still easy to read.

Tags: ,


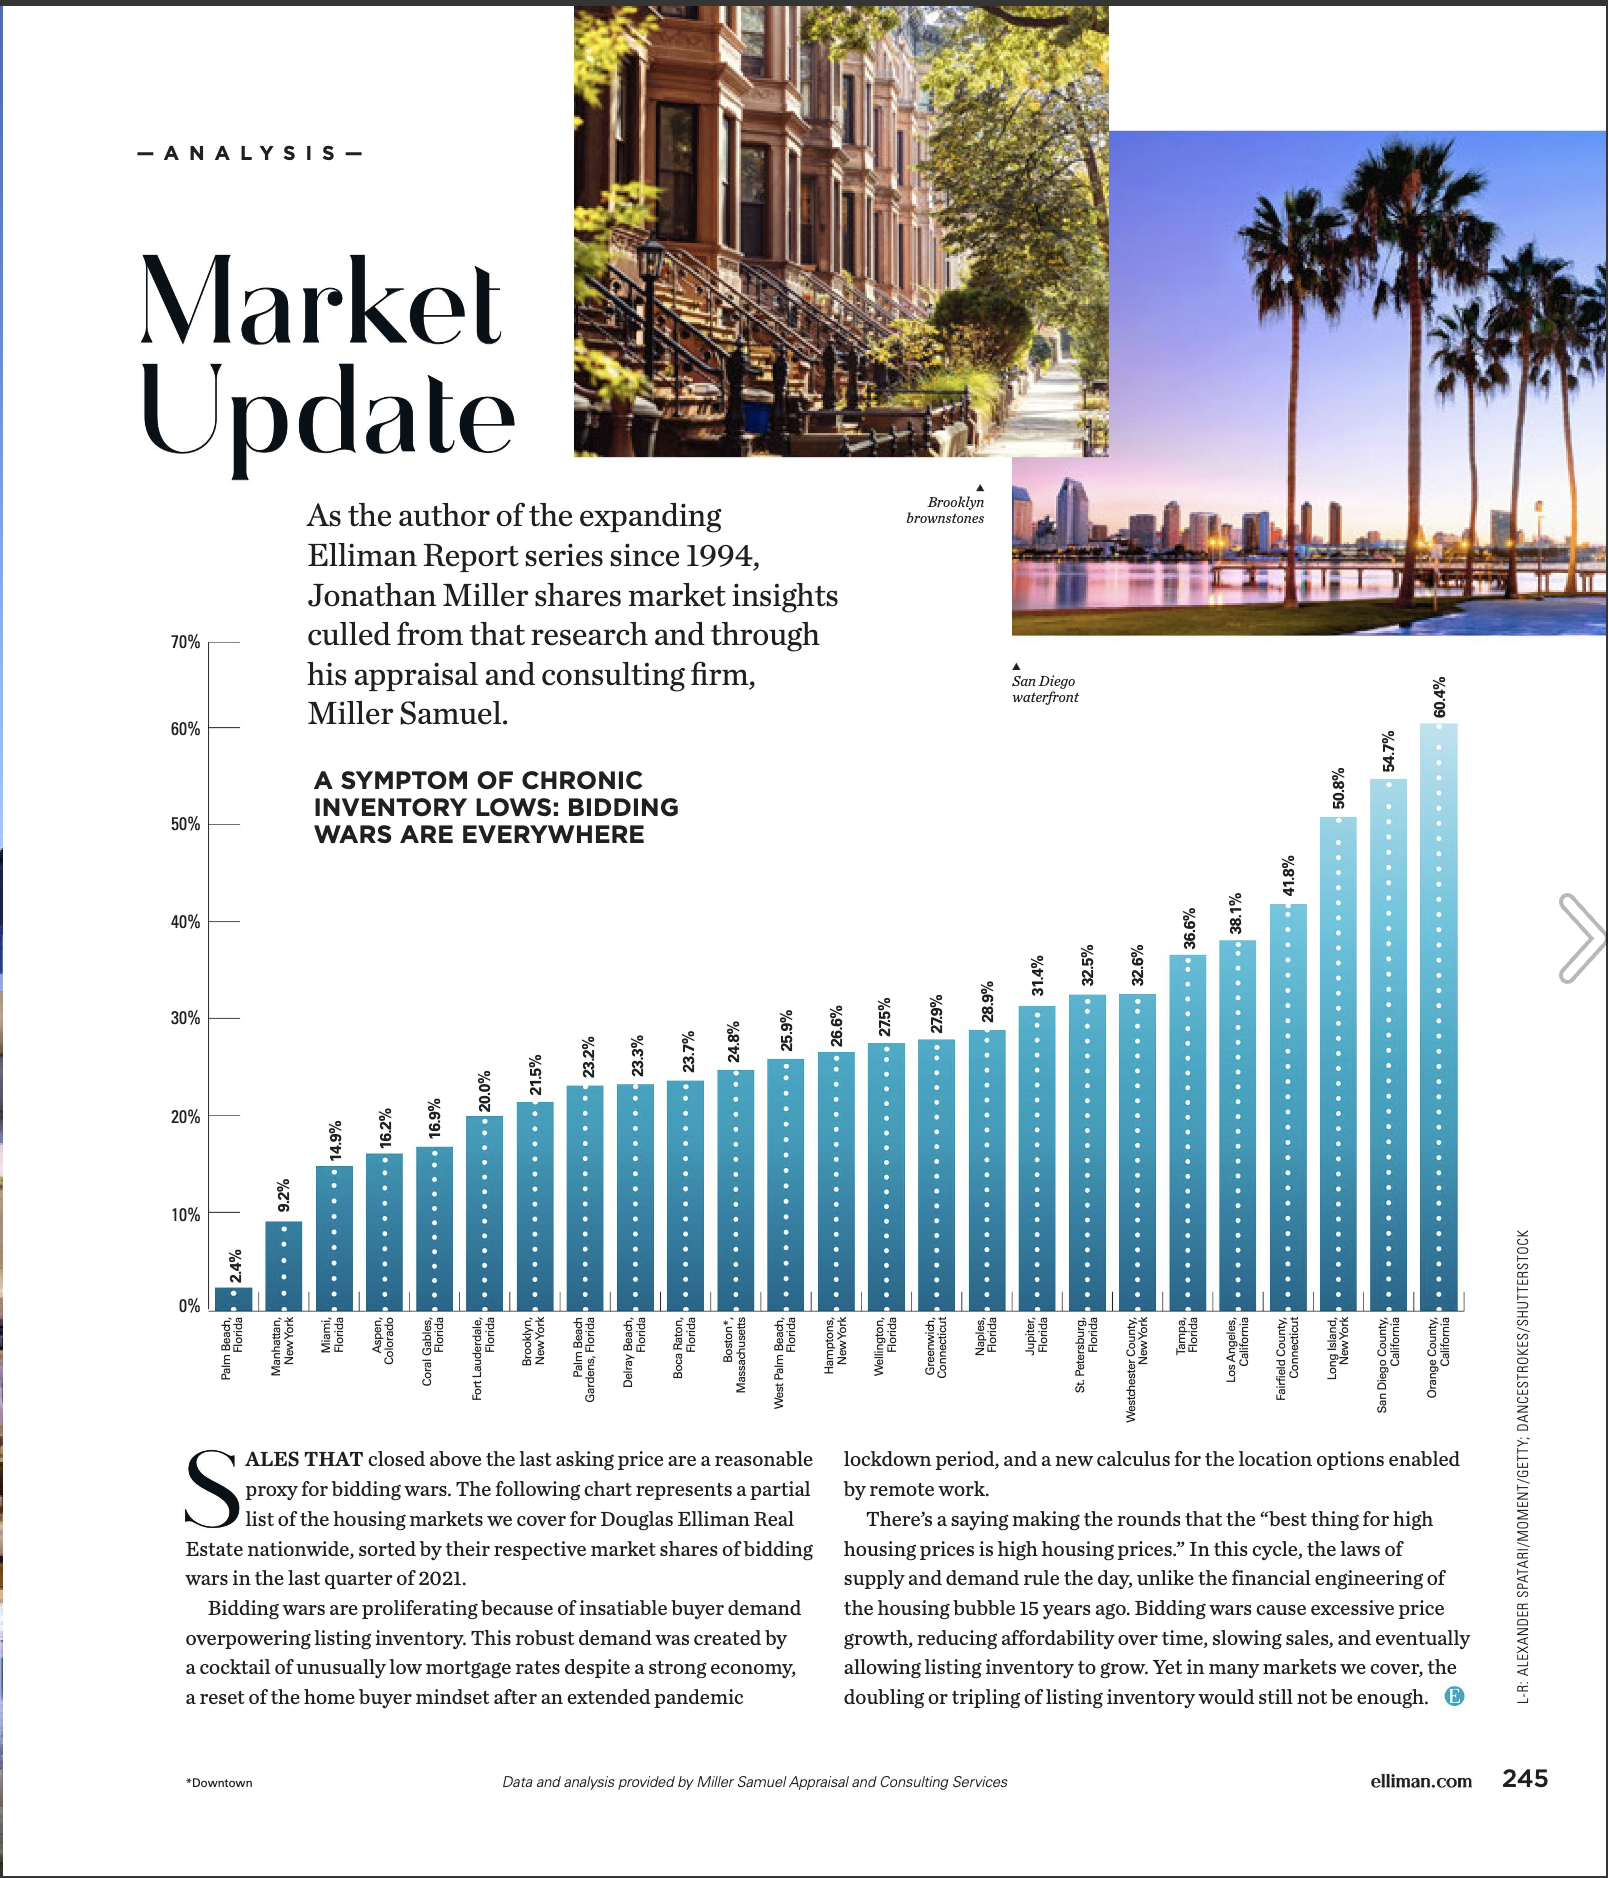
Elliman Magazine Column – A Symptom of Chronic Inventory Lows: Bidding Wars Are Everywhere

April 14, 2022 | 4:35 pm | | Charts |

For each issue of Elliman Magazine produced by Douglas Elliman, the same company that publishes most of our U.S. market research, I write a brief column and create a graphic to illustrate an important issue facing the luxury housing market. Of course, the graphic I create is then supercharged by their very talented graphics staff.

Listing inventory has essentially collapsed in most U.S. housing markets as unusually low rates against the backdrop of robust economic conditions have burned off supply to record lows. Evidence of this is seen in the proliferation of U.S. housings markets with a significant share of bidding wars. Since these are broad markets, various submarkets can see the market share at must higher levels. The proxy for market share is the share of transactions that close above the asking price at time of sale against total period sales.

In the current issue of Elliman Magazine: Spring/Summer 2022, my column “A Symptom of Chronic Inventory Lows: Bidding Wars Are Everywhere”


[click to expand]

Tags: , , ,


Listing Inventory Trends In The Time Of COVID

December 2, 2021 | 2:49 pm | | Charts |

The Winter 2022 issue of Elliman Magazine was published this week and it is quite a beautiful publication. I created a chart for the publication which compares month listing inventory trends across a number of the markets we cover for Douglas Elliman.


[click to expand image]

Tags: ,


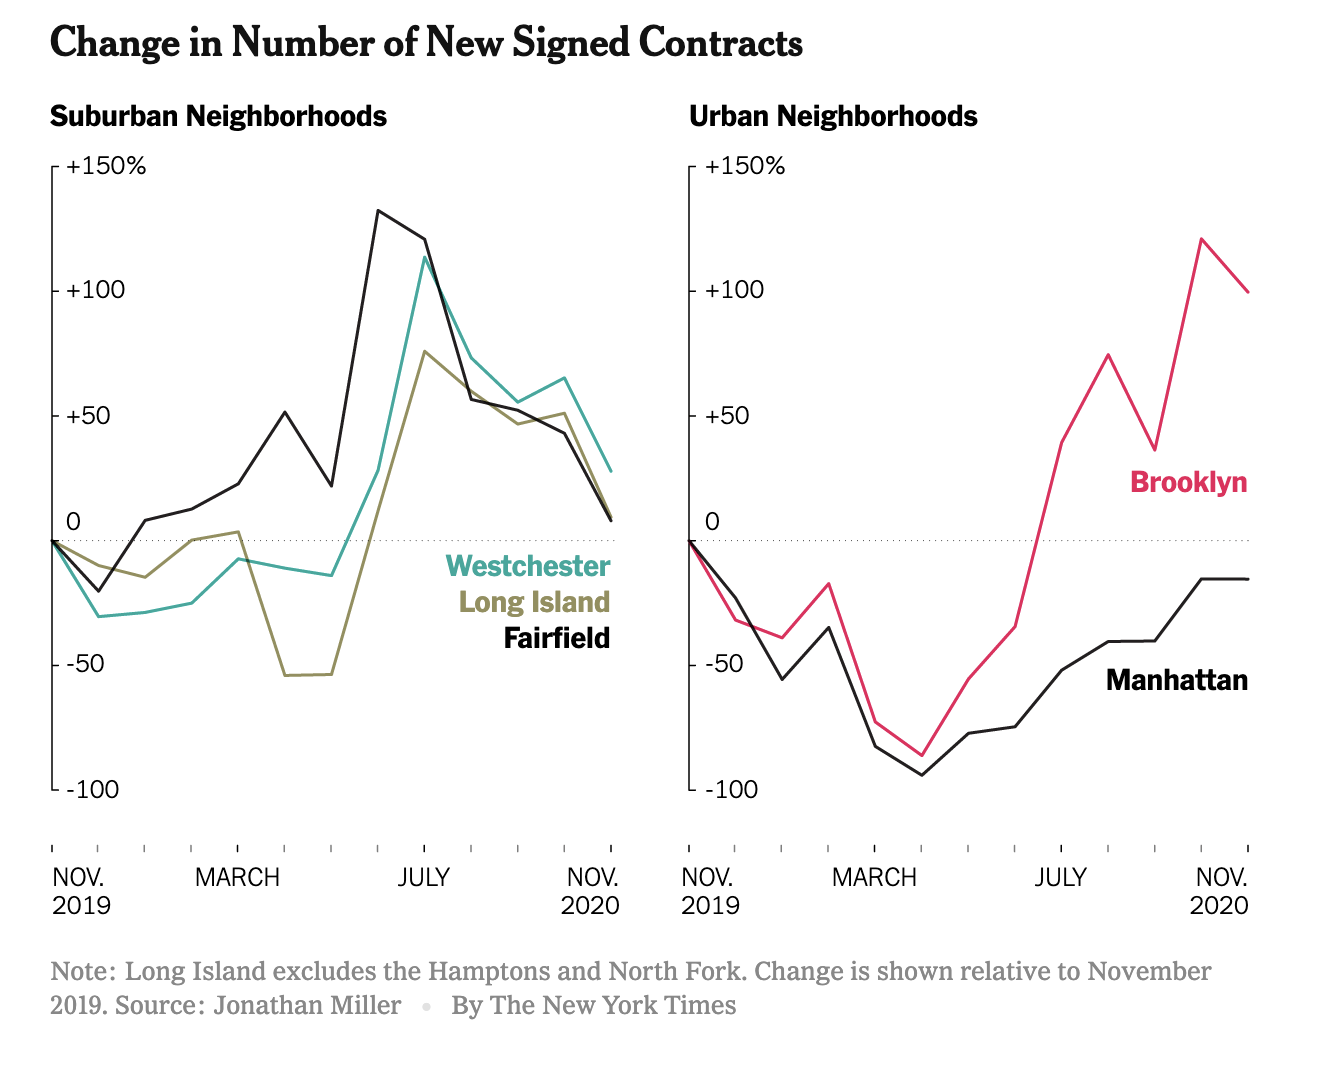
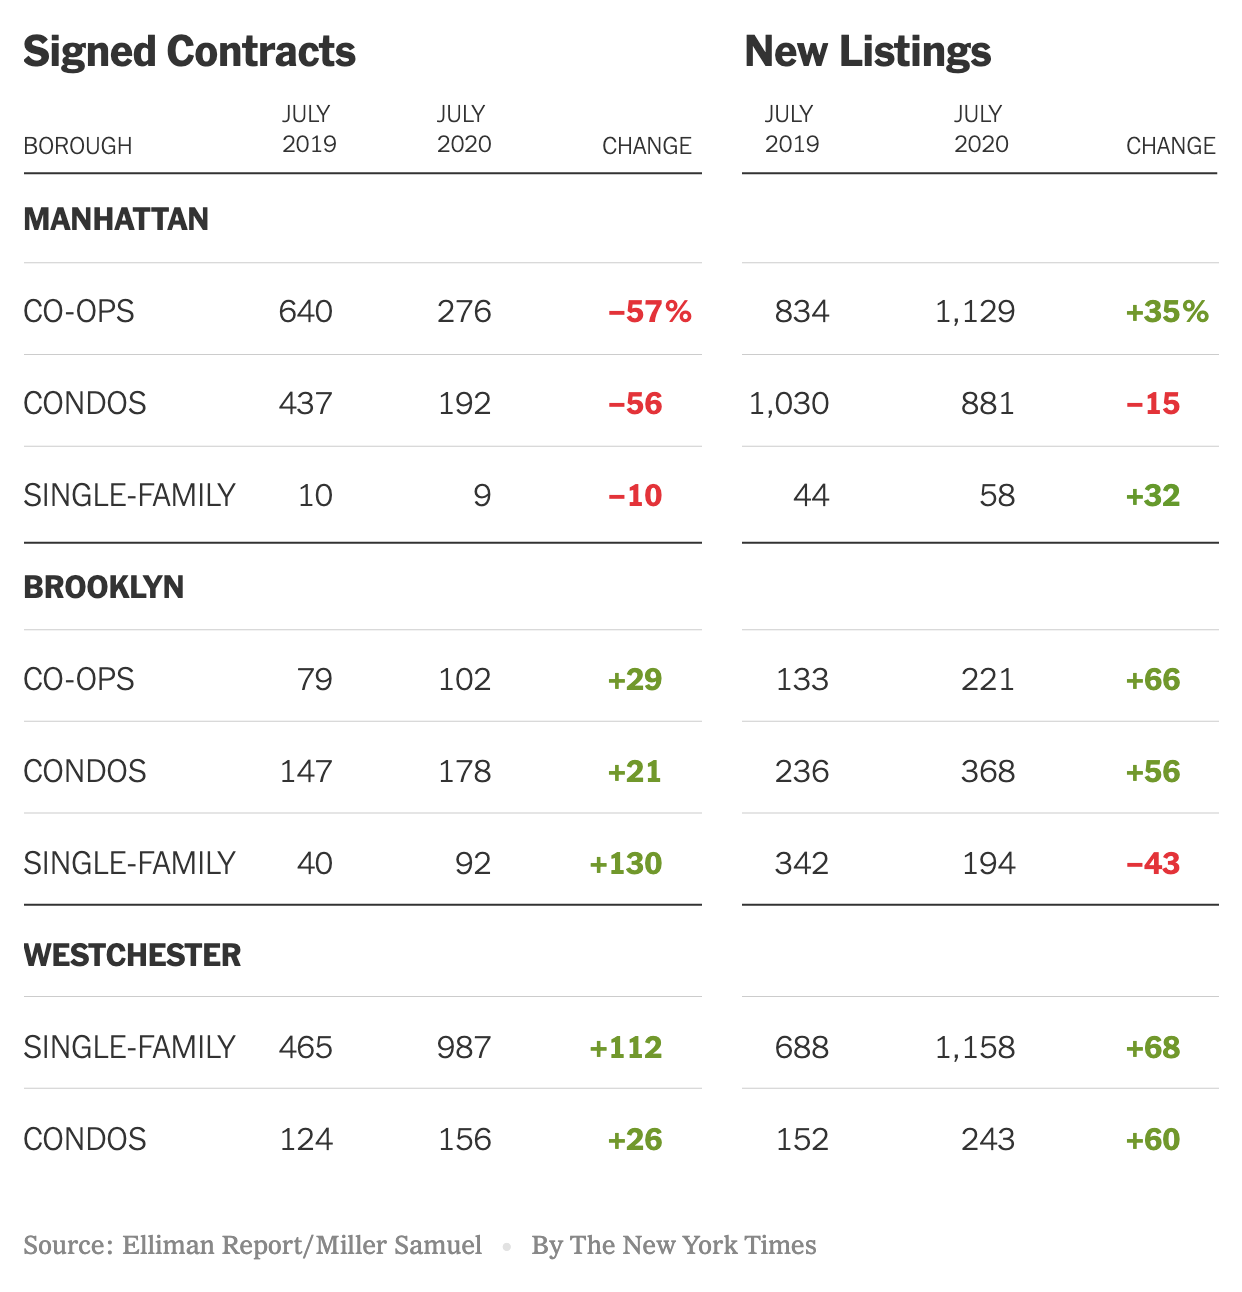
Peak Suburb Has Passed

December 28, 2020 | 2:22 pm | | Explainer |

The New York Times got the market nuances right in their epic end of year The Real Estate Collapse of 2020.

And including epic charts makes it even better.


I noticed that the Streeteasy median rent chart used in the piece shows the same pattern as my recent chart in Bloomberg. That drop in rent is gigantic.


[Source: Bloomberg – click image to open article]

Tags: , , , , , ,


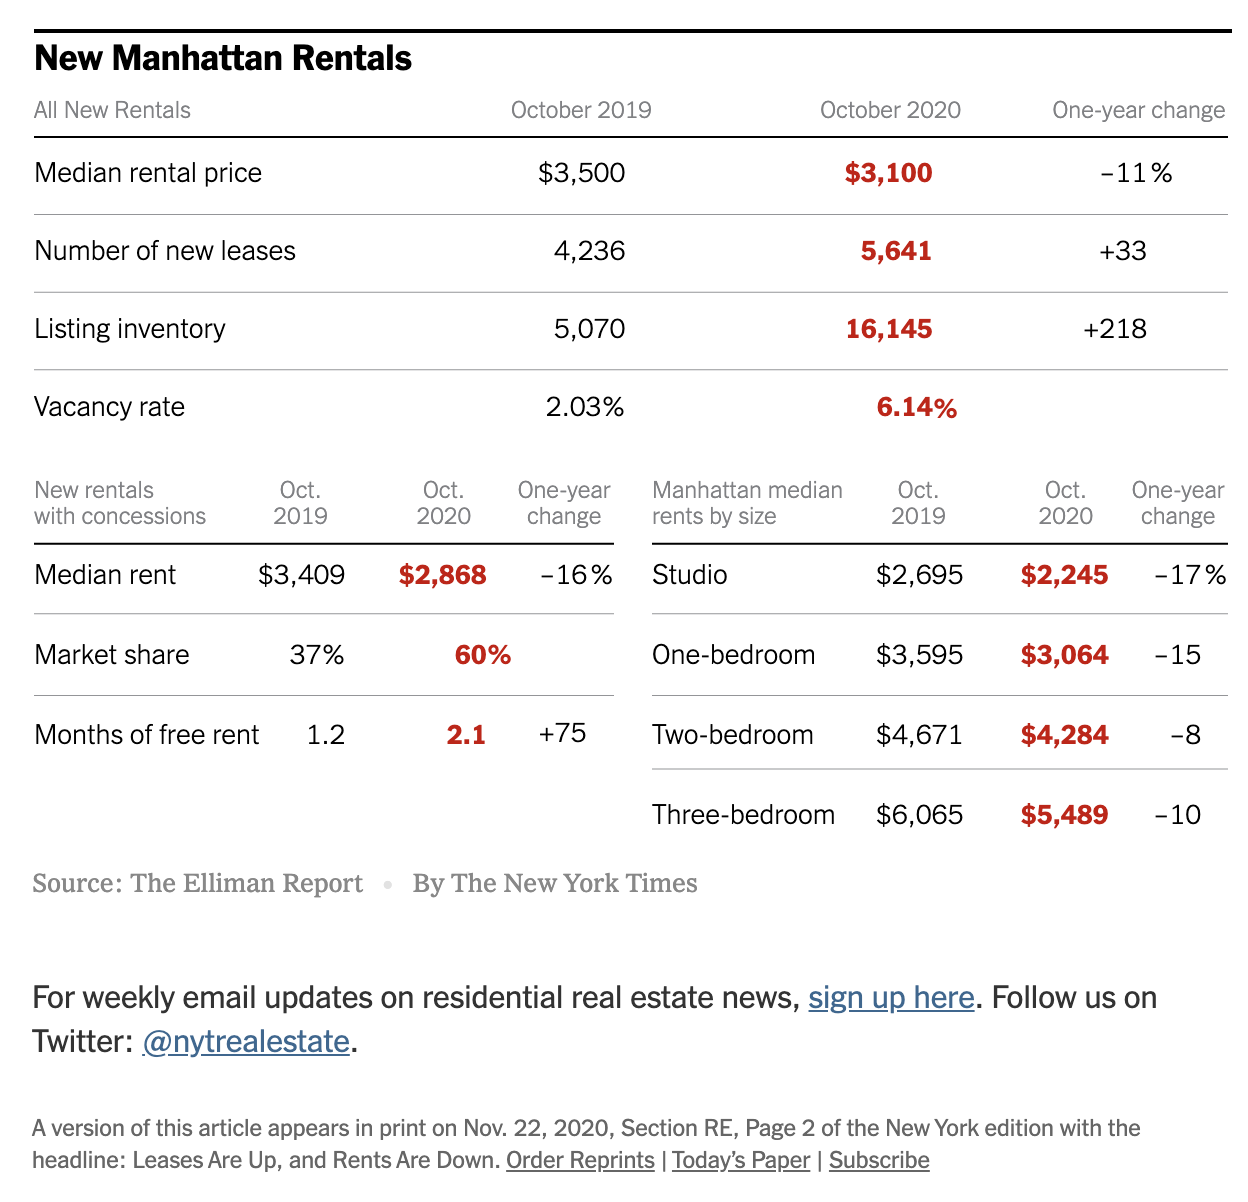
NYT Real Estate: Signs of a Manhattan Rental Market Recovery

November 21, 2020 | 12:49 pm | | Charts |

This weekend’s New York Times Real Estate Calculator column provides a visualization of the recent rental market results in The Elliman Report: October 2020 Manhattan, Brooklyn & Queens Rentals

The Manhattan changes were the most interesting to me – record highs set for the vacancy rate, concession market share, concession amount, yoy% change in median net effective rent overall, studio, 1-bed, & 2-beds. Yet we saw for the first time in fourteen months, a jump in YOY% new lease signings and the highest October new lease signing total on record.

The significantly weaker rental market final hit a point that caused demand to begin to flood back into the market.


[click to open article]

Tags: , , ,


The ‘Urban To Suburban’ Narrative Is Really ‘Manhattan To Suburban’

August 19, 2020 | 1:26 pm | | Charts |

This post previously appeared in the August 14, 2020 edition of Housing Notes. I’ve been writing these weekly summaries on housing topics for more than five years. To subscribe for free, you can sign up here. Then you can look forward to each issue every Friday at 2pm New York Time.

The New York Times created a terrific graphic on our Elliman New Signed Contract Report by illustrating the performance of Manhattan and Brooklyn versus Westchester County. Brooklyn’s sales market performance is closer to Westchester than it is to its city counterpart.


Tags: , , , ,


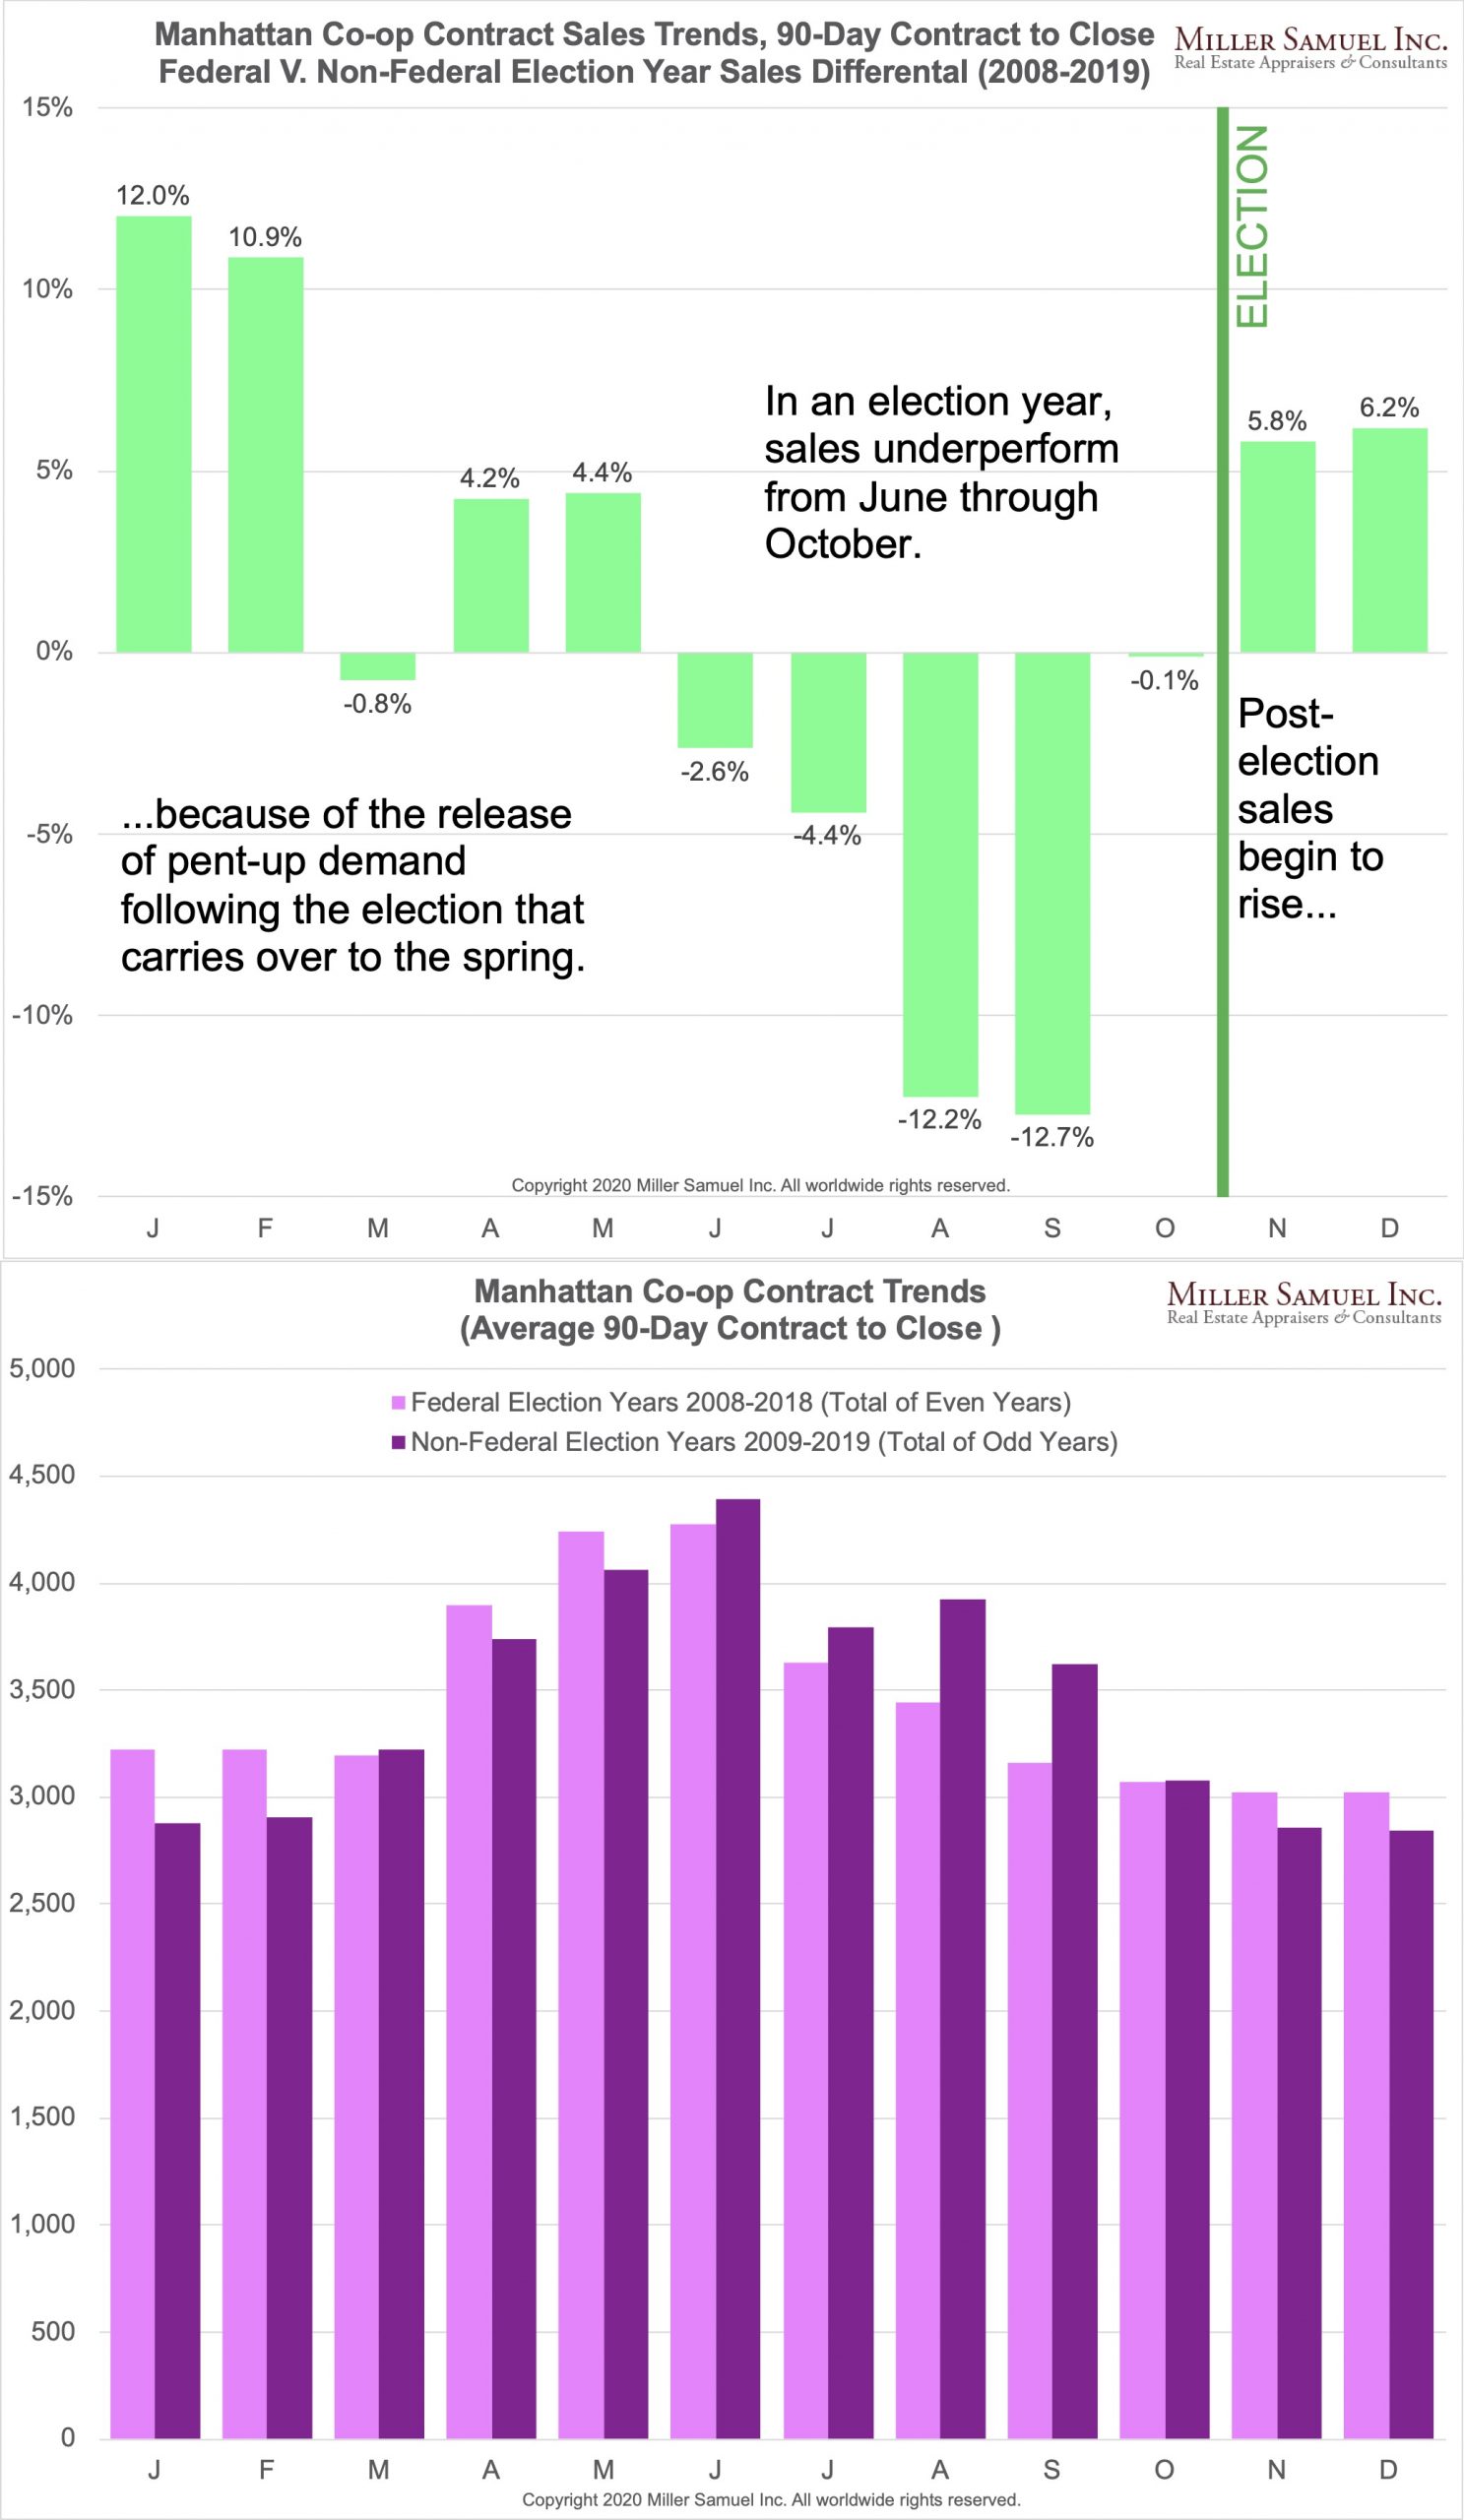
Manhattan Co-op Sales Fall During Federal Election Year

February 5, 2020 | 3:52 pm | | Charts |

For the past decade, I’ve been observing a pullback in sales in the summer of an election year and then a release in sales after the election into the new year, no matter the party or the candidate. I was speaking about this to Sylvia Varnham O’Regan at The Real Deal Magazine, and she asked me to prove it empirically.

So I did.

Her article: This is how presidential elections really affect home sales lays it out for the Manhattan market.

My methodology:

  • The data set was co-op based because they account for 74% of the apartment market and doesn’t have the wild fluctuation of contract versus closing date because of condo new development lags.
  • We don’t have all the contract dates for co-ops, but for those we do, they have been remarkably consistent at around 90 days. That 90-day average was applied to all the closing dates to reverse-engineer contract dates.
  • Contracts for even and odd years were compared: Even years represented federal election years, including midterms.

The results compared federal election years to non-federal election years, finding that beginning in June of an election year, sales were progressively weaker than their non-election year counterpart. The most significant difference occurred in September during an election year with a 12.7% weaker sales market than a non-election year. Beginning in November during an election year, sales overpower their non-election year counterpart, with the release of pent-up demand occurring well into the following spring.

Tags: , , ,


January 2019 YOY% Change in Manhattan Co-op/Condo Listing Inventory

February 7, 2019 | 1:53 pm | Charts |

Tags:


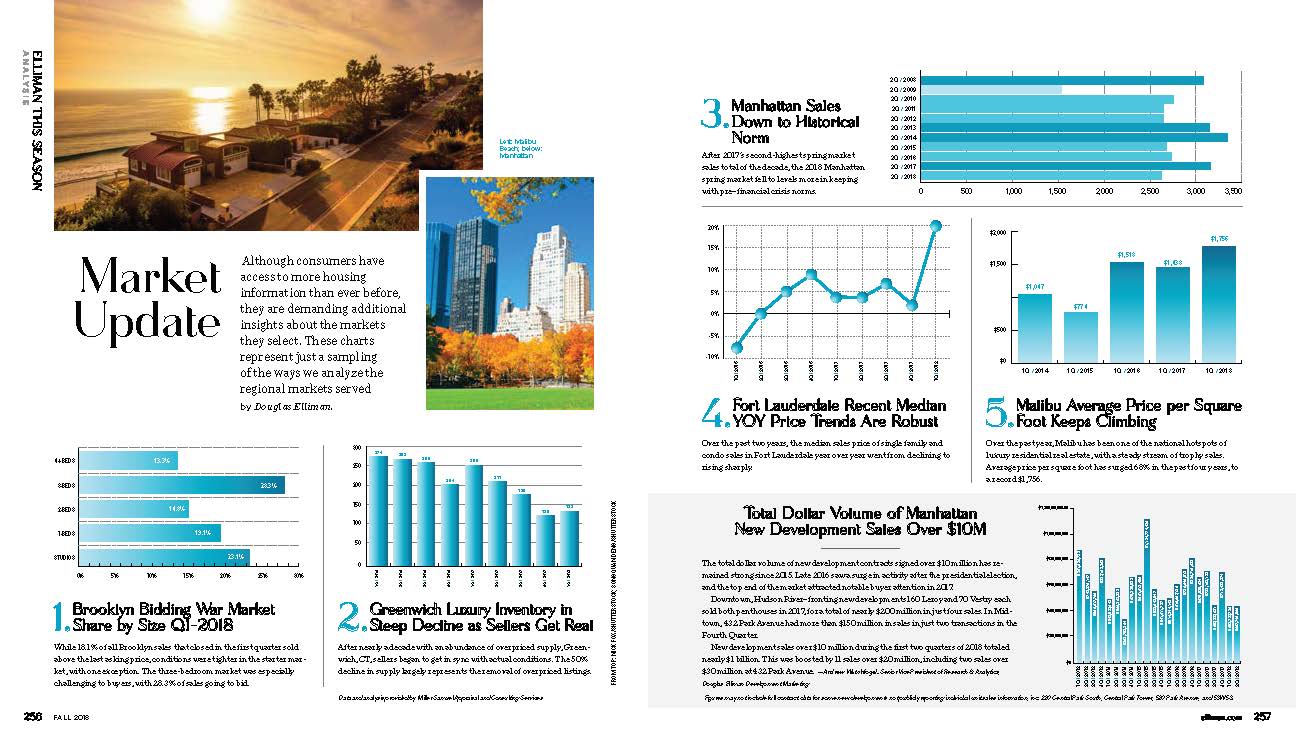
Elliman Magazine Winter 2019 – Market Update

December 14, 2018 | 3:18 pm | | Charts |

The Winter 2019 Issue of Elliman Magazine was just released. I provided a two-page spread showing various market tidbits on random U.S. markets where Douglas Elliman has a footprint. The magazine is well done and a good aspirational read.


[click to expand]

Here’s the full online version of the magazine:

Tags:


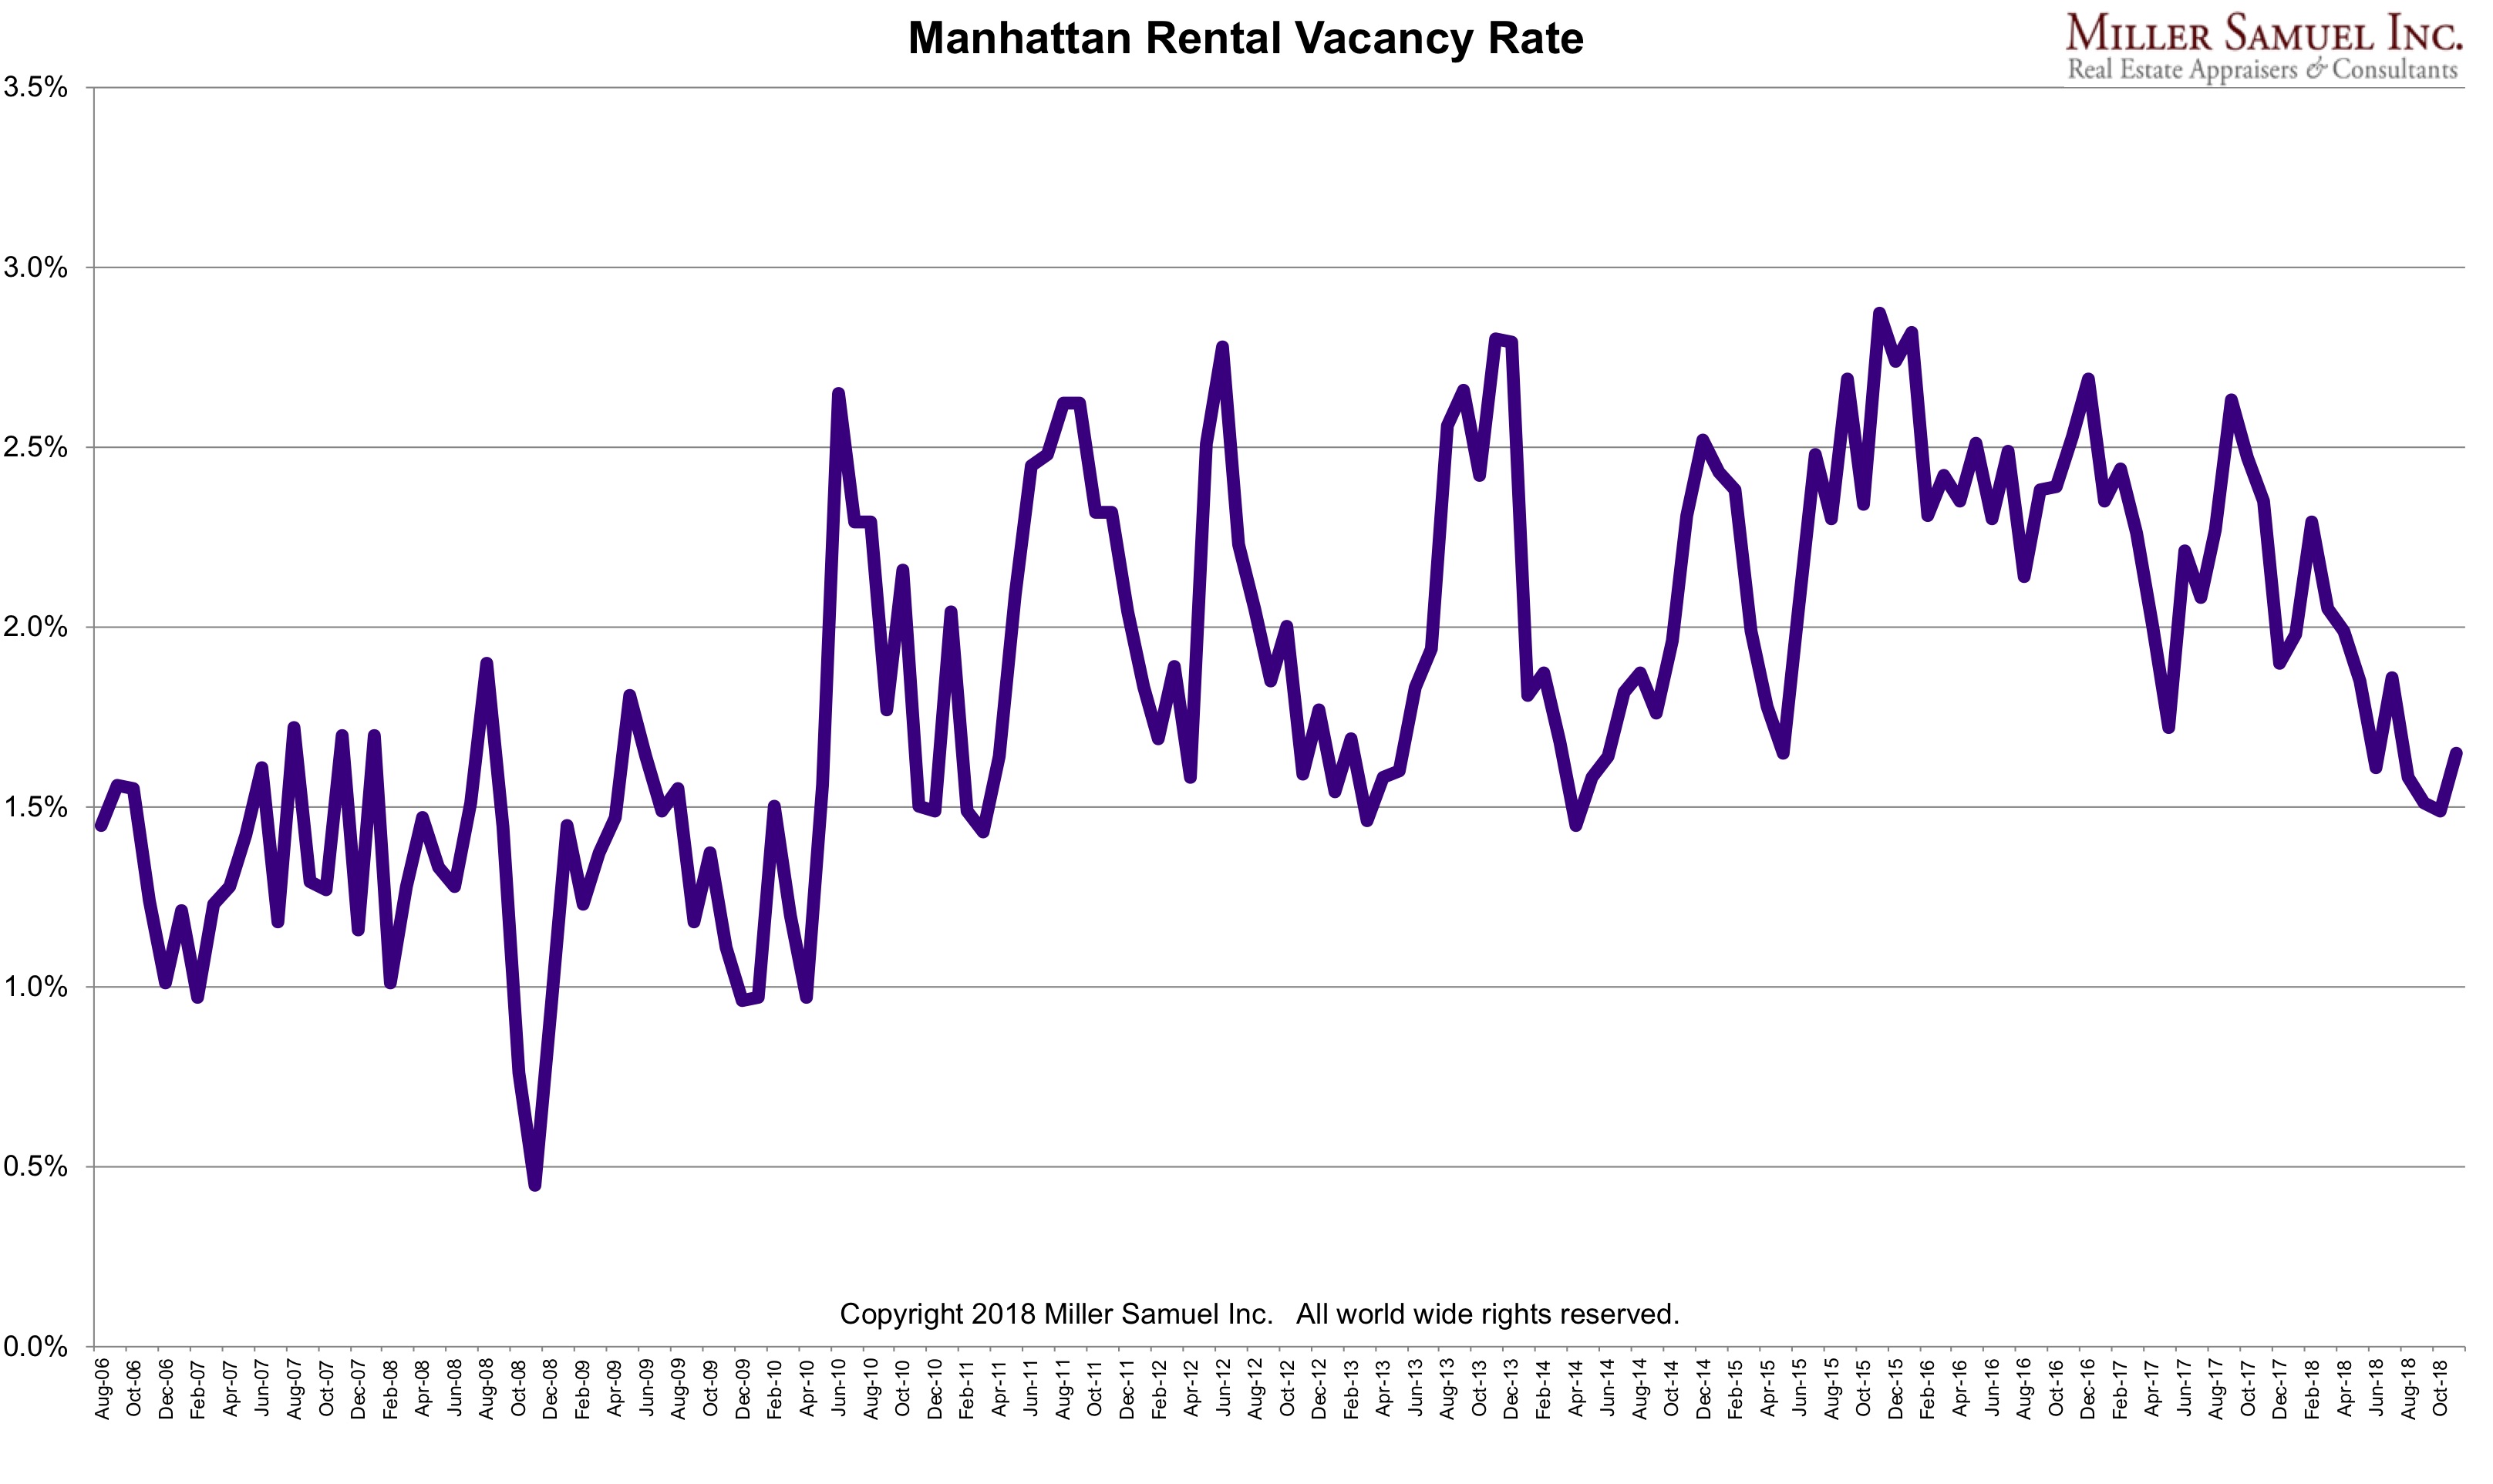
Manhattan Residential Vacancy Rate Isn’t Seasonal?

December 13, 2018 | 1:01 am | Charts |

Since housing market trends are all about seasonality, I thought it was interesting that the Manhattan residential vacancy rate seems devoid of such patterns.

What am I missing here?

Tags: , ,


New Manhattan Condos Got Really Big Over The Past Three Years

January 3, 2018 | 6:00 am | Charts |

Average sales size patterns for these two size sales categories split sharply three years ago.


[Click to expand]

Tags: , , ,


2017: The Year The 2015 Manhattan Market Shift Became Conventional Wisdom

January 1, 2018 | 11:00 am | | Charts |

After controlling the Manhattan housing market for quite a while, sellers and landlords exchanged roles with buyers and tenants circa 2015.

After peaking in 3Q 2015, the market share of bidding wars fell by two thirds. Bidding wars remain more common at lower price points. After bottoming in the 3Q 2015, the market share of rentals with landlord concessions has expanded sharply due to high-end rental development over-building. But like the sales market, the oversupply remains at the upper end.

Aside

Sunday, December 31, 2017, was a trifecta of my New York Times Real Estate market insight goodness before the year ended:

Landlords and Sellers Adjust [New York Times: Calculator column]

Manhattan Prices Stable in 2017, Even as Luxury Takes a Breather [New York Times: Big Ticket column]

Ditching the Tub [New York Times]

Tags: , ,

Get Weekly Insights and Research

Housing Notes by Jonathan Miller

Receive Jonathan Miller's 'Housing Notes' and get regular market insights, the market report series for Douglas Elliman Real Estate as well as interviews, columns, blog posts and other content.

Follow Jonathan on Twitter

#Housing analyst, #realestate, #appraiser, podcaster/blogger, non-economist, Miller Samuel CEO, family man, maker of snow and lobster fisherman (order varies)
NYC CT Hamptons DC Miami LA Aspen
millersamuel.com/housing-notes
Joined October 2007