Matrix Blog

Sales

[Three Cents Worth #288 Hamptons] Comparing Price Trends in the Hamptons and Manhattan

June 3, 2015 | 6:25 pm | | Charts |

It’s time to share my Three Cents Worth (3CW) on Curbed Hamptons, at the intersection of sand dunes and real estate in the East End of Long Island, NY.

Check out my 3CW column on @CurbedHamptons:

Now that we’ve crossed over into June, I thought I’d illustrate the price trend relationship between the Hamptons and Manhattan. The former seeing a majority of single family sales and many second home purchases. The latter with a housing market of 98% apartments and single family family sales are a rounding error. Despite the differences in their housing stock, their behavior in terms of price trends has been similar over the past decade…

3cwH6-1-15

[click to expand charts]


My latest Three Cents Worth column: Three Cents Worth: Comparing Price Trends in the Hamptons and Manhattan [Curbed]

Three Cents Worth Archive Curbed NY

Three Cents Worth Archive Curbed DC

Three Cents Worth Archive Curbed Miami

Three Cents Worth Archive Curbed Hamptons

Three Cents Worth Archive Curbed LA

Three Cents Worth Archive Curbed Ski

Tags: , , , , , , , ,


Bloomberg View Column: Costly City Housing Is an Economic Drag

June 3, 2015 | 6:12 pm | | Charts |

BVlogo

Read my latest Bloomberg View column Costly City Housing Is an Economic Drag.

bv6-2-14a

bv6-2-14b

Here’s an excerpt…

It’s tough living in a big city — the people, the traffic, the noise. Oh, and did we mention the cost of housing? Contrary to conventional wisdom, high and rising housing costs in the U.S.’s biggest cities are not ideal for an economic recovery. Just the opposite: When housing costs take a big bite out of incomes, it diverts money that could be spent on local goods and services or invested in new businesses that stimulate growth…

[read more]


My Bloomberg View Column Directory

My Bloomberg View RSS feed.

Tags: , , , , ,


[Three Cents Worth #287 NY] Tracking New York Rents and Asking Prices Over a Century

June 3, 2015 | 6:04 pm | | Charts |

It’s time to share my Three Cents Worth (3CW) on Curbed NY, at the intersection of neighborhood and real estate in the capital of the world…and I’m here to take measurements.

Check out my 3CW column on @CurbedNY:

Back in 2011, I embarked on a fun research project for Douglas Elliman’s 100th anniversary, in which I traced how sales prices and rents changed since the 1910s. I explain in detail how I did the research here, but I ended up with a very loose proxy to represent price per square foot for sales and average monthly rents during each decade…

2015-6-1curbed

Here are some other ways to view the 100 year trend based on feedback from readers.

2015-6-1curbedDoD

2015-6-1curbedCPIDoD

2015-6-1curbedCPI

[click to expand charts]


My latest Three Cents Worth column: Three Cents Worth: Tracking New York Rents and Asking Prices Over a Century [Curbed]

Three Cents Worth Archive Curbed NY

Three Cents Worth Archive Curbed DC

Three Cents Worth Archive Curbed Miami

Three Cents Worth Archive Curbed Hamptons

Three Cents Worth Archive Curbed LA

Three Cents Worth Archive Curbed Ski

Tags: , , , , , ,


Bloomberg View Column: A Housing Recovery Built to Last?

May 16, 2015 | 9:17 pm | | Charts |

BVlogo

Read my latest Bloomberg View column A Housing Recovery Built to Last?.

bvchartfaststart

Here’s an excerpt…

The housing market has recovered in fits and starts since the financial crisis, so it’s worth noting when one important indicator looks really strong. This is the case with the pending home sales index, which reflects contracts signed for purchases of single-family homes, co-ops and condos, published by the National Association of Realtors…

[read more]


My Bloomberg View Column Directory

My Bloomberg View RSS feed.

Tags: , , , , ,


Brick Underground: Timeline For Selling A NYC Apartment

February 9, 2015 | 8:44 am | |

Leigh Kamping-Carder over at Brick Underground put together a pretty cool infographic that covers the sales process of a NYC apartment.

brickclosingtimeline

Tags:


[Three Cents Worth #276 NY] Proving New York’s Blockbuster $100M Sale Is An Outlier

January 22, 2015 | 1:08 pm | | Charts |

It’s time to share my Three Cents Worth (3CW) on Curbed NY, at the intersection of neighborhood and real estate in the capital of the world…and I’m here to take measurements.

Check out my 3CW column on @CurbedNY:

Finally, after nearly two years of referring to the $88 million sale at 15 Central Park West as the “highest Manhattan residential sale on record,” we get a change of scenery. A new record was set with the $100.47 million sale of the penthouse at One57 recorded late last week. Timing is everything, although, in this case timing really wasn’t. I believe this sale went to contract in 2012, which would be shortly after the $88 million sale went to contract in December 2011 and closed in early 2012. While these super luxury sales are more of a circus sideshow and have little, if anything, to do with the vast majority of the Manhattan housing market, I find them surreal to consider…


3cw1-21-15-short
[click to expand chart]


My latest Three Cents Worth column on Curbed: Three Cents Worth: Proving New York’s Blockbuster $100M Sale Is An Outlier [Curbed]

Three Cents Worth Archive Curbed NY
Three Cents Worth Archive Curbed DC
Three Cents Worth Archive Curbed Miami
Three Cents Worth Archive Curbed Hamptons

Tags: , ,


Bloomberg View Column: Living the High Life

January 22, 2015 | 11:24 am | | Charts |

BVlogo

Read my latest Bloomberg View column Living the High Life.

Please join the conversation over at Bloomberg View. Here’s an excerpt…

Never have so many residential buildings had such lofty aspirations. Based on the number of stories in buildings worldwide that are more than 650 feet (200 meters) high, we’re in the midst of an edifice eruption. An even bigger surge is forecast for next year. The interest in what might be called pinnaclenomics has been driven by capital seeking higher returns in hard assets like luxury real estate in the world’s financial centers — especially in developing nations….

[read more]

Some other related content on the tall building phenomenon:


My Bloomberg View Column Directory

My Bloomberg View RSS feed.

Tags: , , , , ,


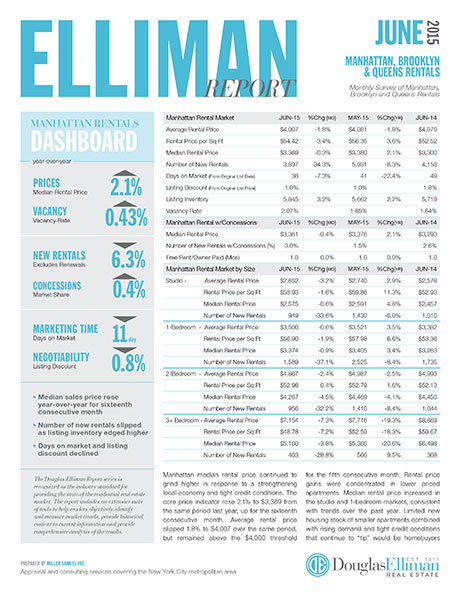
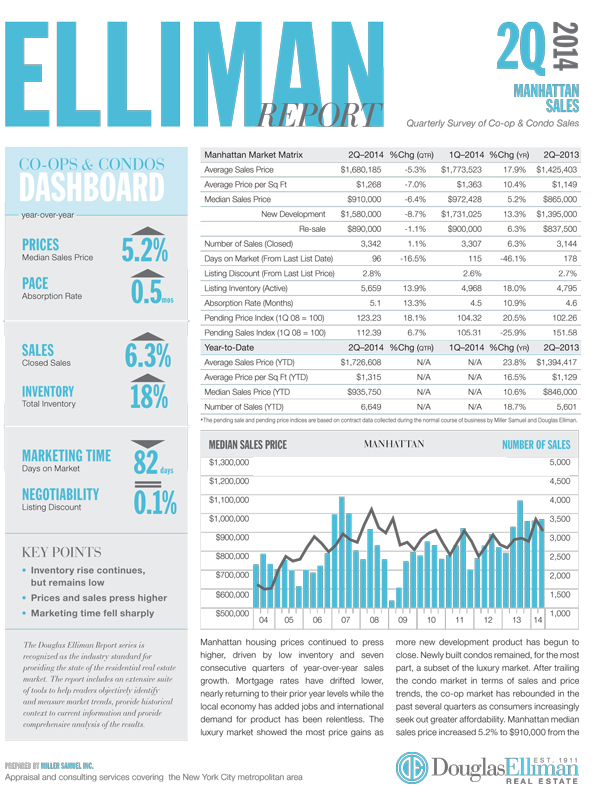
2Q14 Manhattan Sales Market: More Supply, But Not Even Close to Enough

July 1, 2014 | 5:55 pm | | Charts |

Manhattan_2Q_2014

Today Douglas Elliman published the Elliman Report on Manhattan Sales that I author. This quarterly report is part of an evolving market report series I’ve been writing for Douglas Elliman since 1994 (20 years!).

Incidentally, we are tweaking the visual aspects of this Elliman report series – we do this every few years. We added a dashboard to provide at-a-glance information but expanded and yet consolidated the text to be one comprehensive section. I expanded the size of the charts but kept the matrix tables just about the same. Since this is a labor of love and a work in progress, please feel free to send along suggestions.

Key Points
– Sales increased for the 7th consecutive quarter, but less at a lower rate than the 27.6% average quarterly increase of the prior 4 quarters.
– Median sales price for co-ops increased 9% as consumer sought out greater affordability as condos increased 0.8%.
– Inventory is up from last year’s near record low. The inventory bottom appears to have been reached in 4Q 2013.
– There were 45.9% listings that sold at or above list price, the largest market share in nearly 6 years.
– Luxury price increases out paced the overall market.
– Sellers are being both motivated and enabled to list as a result of rising prices.
– Mortgage lending remains significantly challenging to buyers.

Here’s an excerpt from the report:

Manhattan housing prices continued to press higher, driven by low inventory and seven consecutive quarters of year-over-year sales growth. Mortgage rates have drifted lower, nearly returning to their prior year levels while the local economy has added jobs and international demand for product has been relentless. The luxury market showed the most price gains as more new development product has begun to close…

Here is some context on the lack of inventory [click each chart to expand]:

2q14Manhattan-inventorybyMonth

2q14Manhattan-inventorySPLIT


The Elliman Report: 2Q14 Manhattan Sales [Miller Samuel] Miller Samuel Aggregate Database [Miller Samuel] Market Chart Gallery [Miller Samuel]


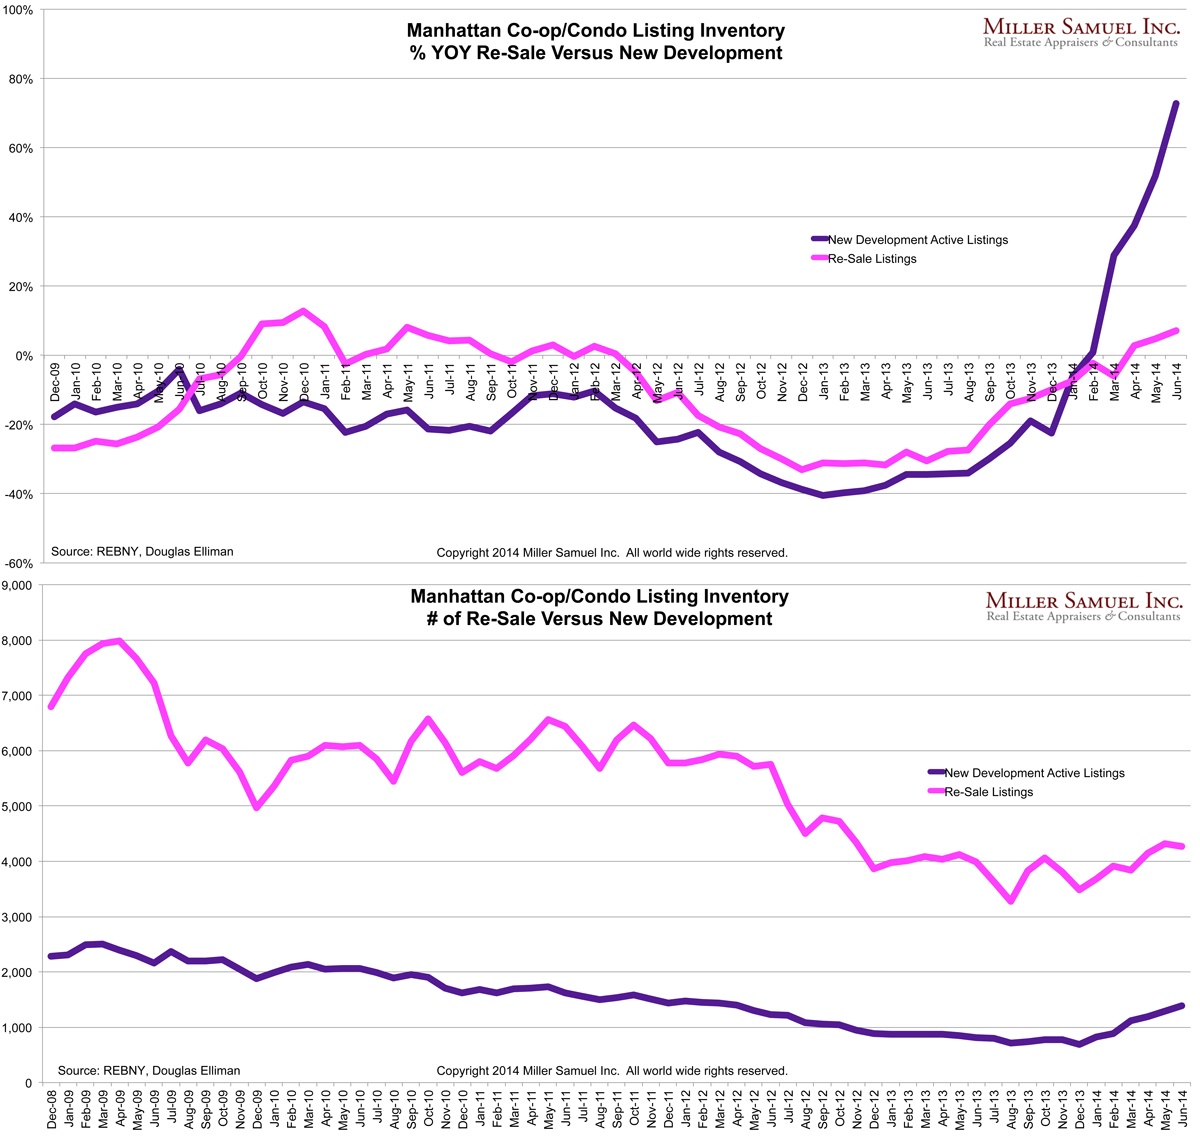
Manhattan New Development: Small Share, But Rising Sharply

June 20, 2014 | 11:58 am | | Charts |

matrixnewdevresalelist-6-20-14

[Click to expand]

I took a look at the change in new development inventory versus re-sale inventory both by year-over-year change (quite dramatic) and number of units.  Both categories bottomed out at the end of 2013.

These trends are based on Manhattan co-ops and condos which represent more than 98% of the “non-rental” market.  Much of the new inventory coming online is located within the “luxury” market which is the top 10% based on price.

Tags:


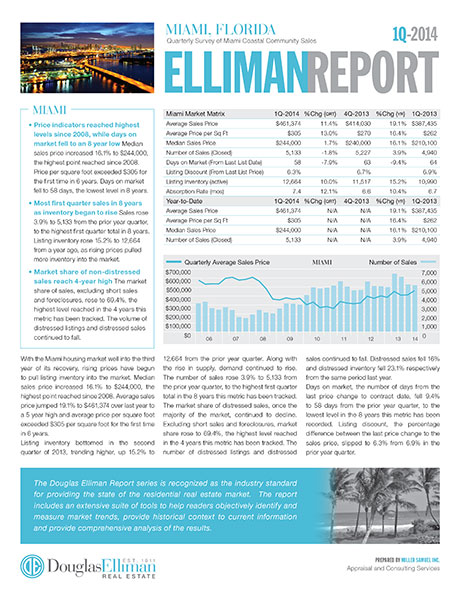
[Ready, Set, Download] South Florida Market Reports 1Q 2014

April 18, 2014 | 4:01 pm | | Reports |

Our 4 comprehensive reports for Douglas Elliman on the residential sales markets for Miami, Boca Raton, Fort Lauderdale and Palm Beach this week.

Click on each report to download!

Miami_1Q14

MIAMI
With the Miami housing market well into the third year of its recovery, rising prices have begun to pull listing inventory into the market. Median sales price increased 16.1% to $244,000, the highest point reached since 2008. Average sales price jumped 19.1% to $461,374 over last year to a 5 year high and average price per square foot exceeded $305 per square foot for the first time in 6 years. Listing inventory bottomed in the second quarter of 2013, trending higher, up 15.2% to 12,664 from the prior year quarter. Along with the rise in supply, demand continued to rise. The number of sales rose 3.9% to 5,133 from the prior year quarter, to the highest first quarter total in the 8 years this metric has been tracked. The market share of distressed sales, once the majority of the market, continued to decline. Excluding short sales and foreclosures, market share rose to 69.4%, the highest level reached in the 4 years this metric has been tracked. The number of distressed listings and distressed With the Miami housing market well into the third year of its recovery, rising prices have begun to pull listing inventory into the market. Median sales price increased 16.1% to $244,000, the highest point reached since 2008. Average sales price jumped 19.1% to $461,374 over last year to a 5 year high and average price per square foot exceeded $305 per square foot for the first time in 6 years…

BocaRaton_1Q14

BOCA RATON
CONDO Median sales price surged 16.3% to $150,000 and average sales price declined 8.8% to $229,569 respectively from the prior year quarter. Listing discount, the percent difference between the list price at time of contract and the sales price, rose to 7% from 3.8% in the prior year quarter, but fell from 7.7% in the prior quarter…

SINGLE FAMILY Median sales price jumped 19.4% to $370,000 and average sales price rose 5.3% to $528,616 respectively from the prior year quarter. Listing discount edged up to 6.9% from 6.1% in the prior year quarter, as sellers were slightly more optimistic when determining their listing price…

FtLauderdale_1Q14

FORT LAUDERDALE
CONDO Median sales price jumped 19.8% to $255,000 from the same quarter last year, the highest level reached since 2008. Average sales price followed the same pattern, rising 23.9% to $379,391 over the same period also reaching a 5 year high.

SINGLE FAMILY The average time to market a property was 91 days, essentially unchanged from 90 days in the prior year quarter. Listing discount, the percentage difference between the list price at time of contract and the sales price, jumped to 8.1% from 4.5% as sellers pressed list prices higher than market trends support.

PalmBeach_1Q14

PALM BEACH
CONDO There were 68 sales during the quarter, 25.9% more than the same period last year. Listing inventory fell 16.9% to 360 over the same period. As a result the absorption rate, the number of months to sell all inventory at the current pace of sales, fell 34% to 15.9 months from the same period last year. The faster market pace pushed down days on market, the number of days from the last price change to the contract date, by 10 days to an average of 182 days.

SINGLE FAMILY Median sales price increased 10.7% to $3,100,000 from the prior year quarter to the highest first quarter reached since 2009. Average sales price jumped 56.7% to $6,450,093 over the same period. The average square footage of a sale was 5,261, up 20.9% from the prior year quarter.

Tags:


Ready, Set, Download: 1Q 2014 Market Reports for Brooklyn, Queens and Westchester/Putnam Sales

April 12, 2014 | 1:49 pm | |

We released 3 reports for Douglas Elliman on the sales markets for Brooklyn, Queens and Westchester/Putnam this week. Click on the reports to download!

Brooklyn_1Q_2014 BROOKLYN The Brooklyn housing market was characterized by more modest price growth and chronic lack of inventory, holding back sales growth. Median sales price expanded 1% to $520,000 from the same period last year and the highest first quarter result in 6 years. Average sales price grew 7.3% to $681,182 over the same period. Co-ops posted the largest year-over-year gain in median sales price, rising 12.2% to $340,000 but lost 2.1% of the market share. Condos remained essentially unchanged over the year with a $625,000 median sales price and market share edged 1.6% higher. The 1-3 family median sales price increased 5.1% to $588,733 and market share increased a nominal 0.5%…

Queens_1Q_2014 QUEENS The first quarter Queens housing market was a period of rising prices after an extended period of stability, declining inventory, and rising sales. The bottom of the multi-year decline of listing inventory may have been reached in the fourth quarter of 2013. Although the first quarter listing inventory increased 7% from the prior quarter bottom to 5,617, it was the second lowest level recorded in this report series since 2005 and 13.5% below prior year levels. The number of sales jumped 32.8% to 3,156 from the prior year quarter, the highest first quarter total in 6 years. The combination of declining inventory and rising sales led to a faster market pace. The absorption rate, the number of months to sell all listing inventory at the current pace of sales, fell to 5.3 months, less than half the 11.2 month average over the past 5 years…

Westchester_1Q_2014 WESTCHESTER The Westchester housing market saw the most first quarter sales in 7 years, the highest median sales price in 6 years and initial signs that the trend of declining inventory may be ending. There were 1,525 sales in the first quarter, up 13.1% from the prior year quarter and the most first quarter sales since the same period 7 years ago. Listing inventory fell 3.7% to 5,378 from the same period last year and for the 8th consecutive quarter. With the rise in the number of sales and the decline in listing inventory, the pace of the market was faster. The monthly absorption rate, defined as the number of months to sell all inventory at the current pace of sales, fell by 1.8 months to 10.6 months from the prior year quarter…
PUTNAM After bottoming out two years ago, housing prices have generally trended higher as the number of sales expanded and inventory contracted. All price indicators posted gains from prior year levels. Median sales price increased 12.7% to $302,500 while average sales price rose 15.9% to $379,217 over the same period…

Tags:


1Q 2014 Manhattan Sales Report Released, Records Reached

April 1, 2014 | 4:46 pm | | Reports |

Manhattan_1Q_2014

Douglas Elliman published the Manhattan sales report today that I author. This report is part of an evolving series I’ve been writing for Douglas Elliman since 1994.

Key Trends

  • Most first quarter sales in 7 years, but not expected to keep torrid pace.
  • Price per square foot sets 25-year record of $1,363.
  • Median sales price jumped 18.5% but remained 5.1% below 2008 peak.
  • Inventory was flat for first time in 3 years.
  • Comparisons against year ago levels skewed higher from brief “fiscal cliff” lull.
  • Credit remains tight partly due to implementation of QM – keeping inventory low.

Here’s an excerpt from the report:

First quarter Manhattan housing market conditions included double-digit price gains from prior year levels as the sales mix shifted to larger units and a growing new development market share targeted the luxury market. Sales momentum from a record setting 2013 carried into the new year and listing inventory stabilized after twelve consecutive quarterly year-over-year declines.

Median sales price increased 18.5% to $972,428 from the last year, but remained 5.1% below the high water mark set in the second quarter of 2008 before the Lehman tipping point in the subsequent quarter. Average sales price jumped 30.9% to $1,773,523 from the same period last year due to a number of factors, including the rise in luxury new development market share, the increase in the average sales size and larger price gains at the upper end of the market. The average square footage of an apartment was 1,301, a 5.9% increase from the same period last year. The average price per square foot of a Manhattan apartment reached a record $1,363, 23.6% above year the prior year level…

There was heavy media coverage of the report release this quarter.


The Elliman Report: 1Q 14 Manhattan Sales [Miller Samuel]
The Elliman Report: 1Q 14 Manhattan Sales [Douglas Elliman]
Miller Samuel Aggregate Database [Miller Samuel]
Chart Gallery [Miller Samuel]

Tags:

Get Weekly Insights and Research

Housing Notes by Jonathan Miller

Receive Jonathan Miller's 'Housing Notes' and get regular market insights, the market report series for Douglas Elliman Real Estate as well as interviews, columns, blog posts and other content.

Follow Jonathan on Twitter

#Housing analyst, #realestate, #appraiser, podcaster/blogger, non-economist, Miller Samuel CEO, family man, maker of snow and lobster fisherman (order varies)
NYC CT Hamptons DC Miami LA Aspen
millersamuel.com/housing-notes
Joined October 2007