Skip to content
Services
Appraisals
Consulting
Resources
Market Reports
Charts
Matrix Blog
Articles & Research
Press
About
get in touch
Charts
› Housing Trends & Cycles
November 7, 2021
Analysis & Research
,
Explainer
,
Homebuying Process
,
Housing Indices & Portals
,
Housing Trends & Cycles
Zillow Offers As A Proxy For ‘Big Data’ Shows The Lack Of Qualitative Analysis
read more
August 20, 2021
Brooklyn
,
Charts, Maps, Images, Infographics, Video
,
Fairfield County, CT
,
Hamptons/North Fork
,
Housing Trends & Cycles
,
Long Island
,
Manhattan
,
Queens
,
Westchester County, NY
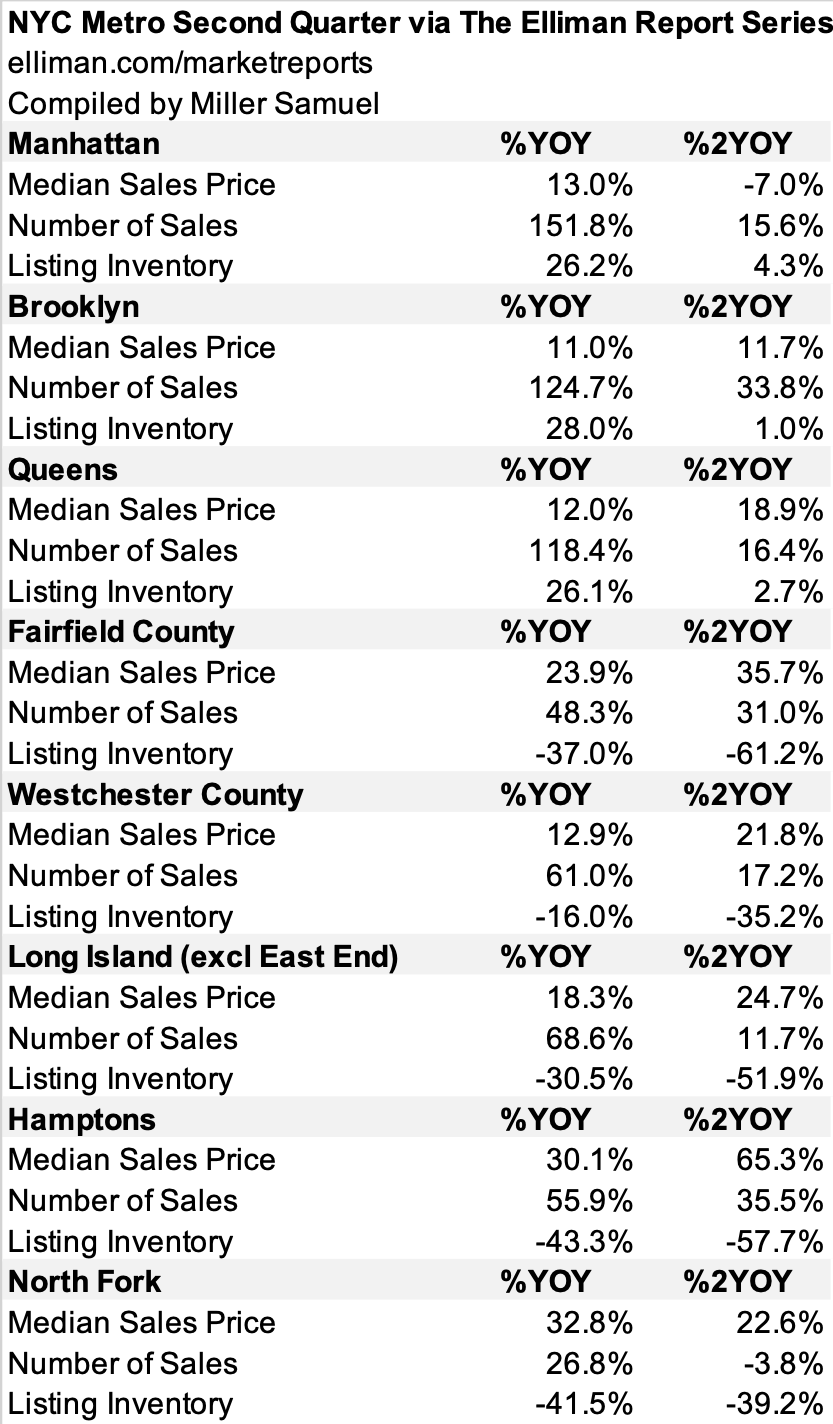
NYC Metro Conditions Much More Robust Than Two Years Ago
read more
June 18, 2021
Elliman Reports
,
Housing Trends & Cycles
,
Long Island
TV: Newsday Live: Hot Tips For a Hot Market: For Sellers
read more
May 1, 2021
Appraising
,
Bloomberg Radio
,
Credit, Finance, Mortgage, Rates
,
Government, Politics, Regulations & Policy
,
Housing Note
,
Housing Trends & Cycles
[Podcast] Masters In Business: Jonathan Miller on the Real Estate Industry
read more
March 17, 2021
Bloomberg Radio
,
Bloomberg TV
,
Charts, Maps, Images, Infographics, Video
,
Housing Trends & Cycles
,
New York City
,
Public Speaking
,
South Florida
I Discuss The Florida-New York Housing SMACKDOWN On Bloomberg TV’s Surveillance March 12, 2021
read more
December 28, 2020
Bloomberg News
,
Brooklyn
,
Charts, Maps, Images, Infographics, Video
,
Douglas Elliman
,
Elliman Reports
,
Fairfield County, CT
,
Greenwich
,
Hamptons/North Fork
,
Housing Trends & Cycles
,
Long Island
,
Manhattan
,
New York Times
,
Rentals, Investing
,
Sales
,
Westchester County, NY
Peak Suburb Has Passed
read more
December 28, 2020
Brooklyn
,
Douglas Elliman
,
Elliman Reports
,
Fairfield County, CT
,
Hamptons/North Fork
,
Housing Trends & Cycles
,
Long Island
,
Manhattan
,
The Real Deal
,
Westchester County, NY
TRD Quick Question: Jonathan Miller “What’s Happening in the NYC Real Estate Market?”
read more
November 21, 2020
Brooklyn
,
Elliman Reports
,
Housing Trends & Cycles
,
Manhattan
,
New York Times
,
Queens
,
Rentals, Investing
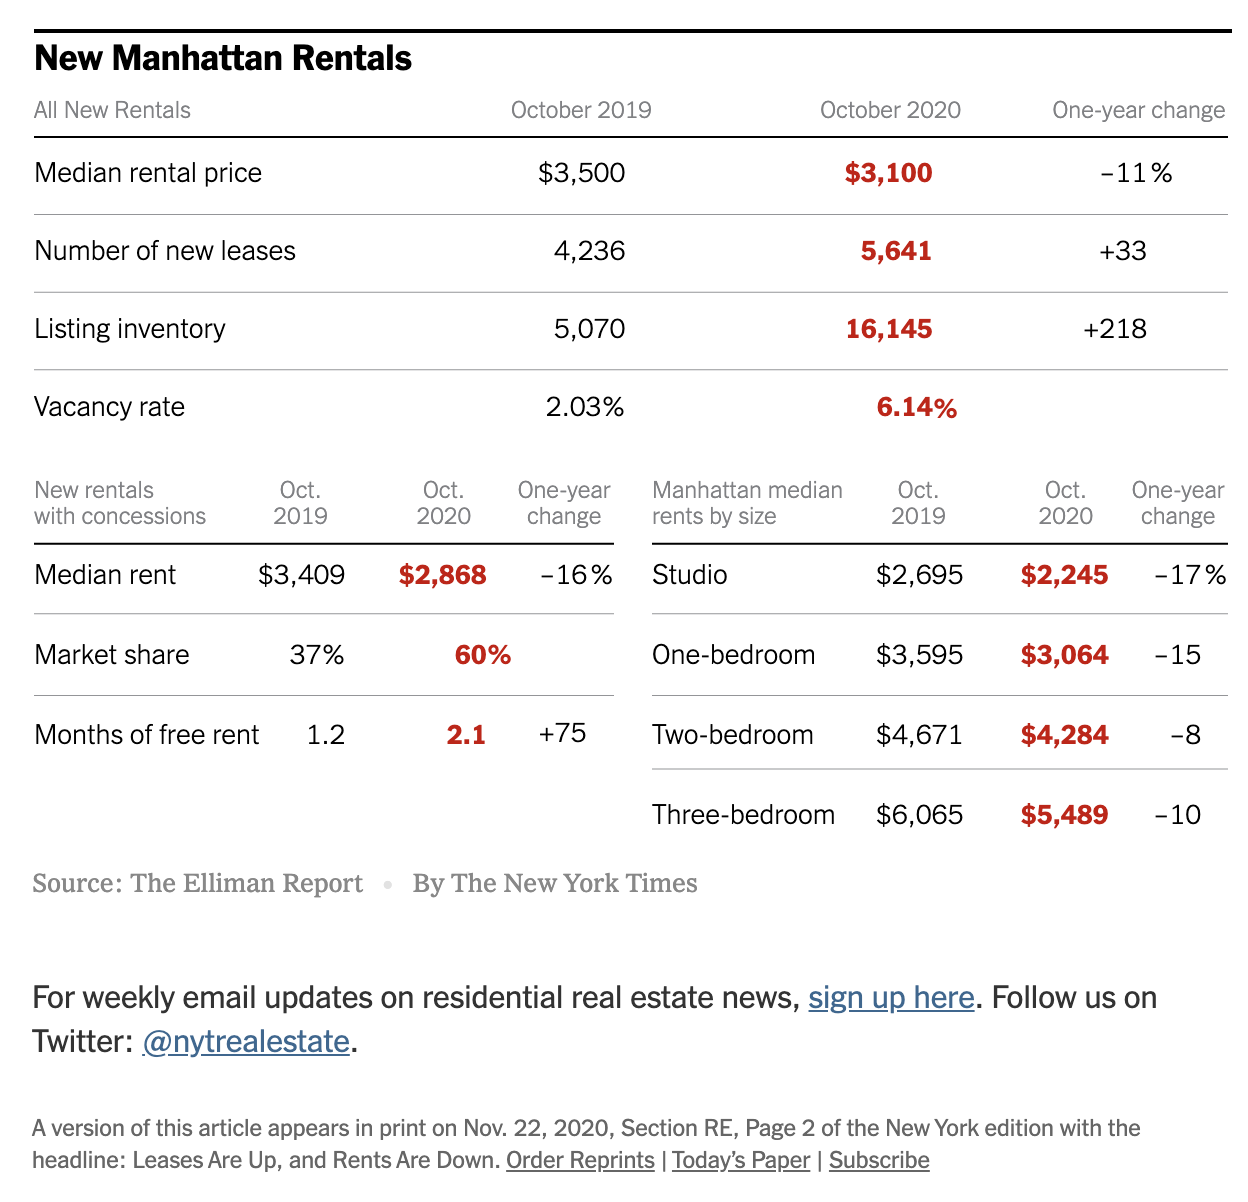
NYT Real Estate: Signs of a Manhattan Rental Market Recovery
read more
August 19, 2020
Brooklyn
,
Charts, Maps, Images, Infographics, Video
,
Elliman Reports
,
Housing Note
,
Housing Trends & Cycles
,
Manhattan
,
New York Times
,
Westchester County, NY
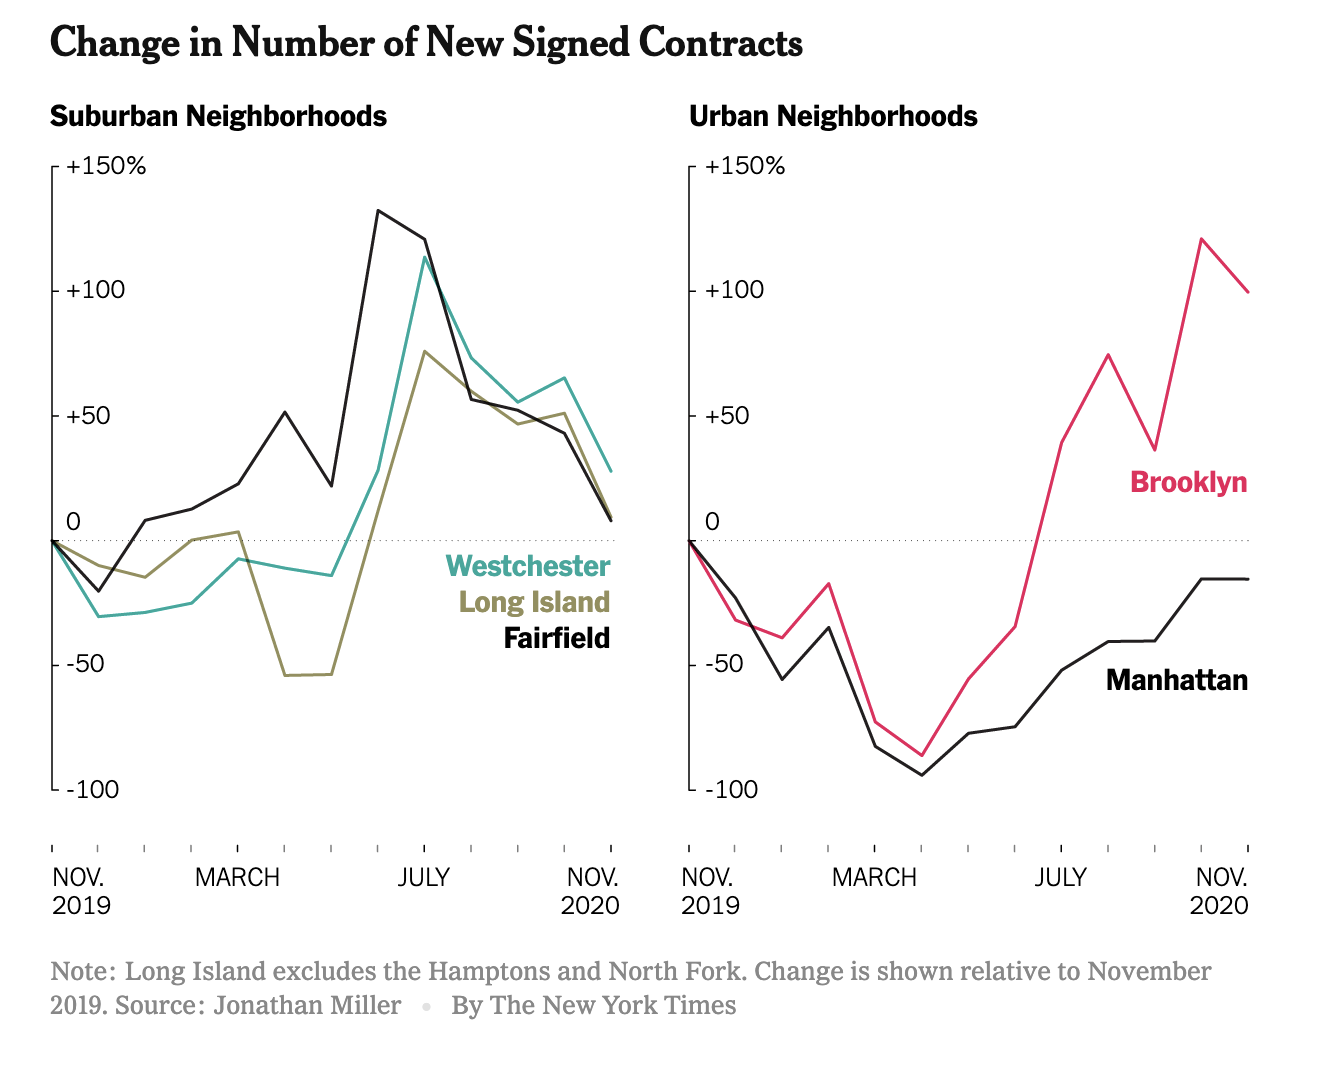
The ‘Urban To Suburban’ Narrative Is Really ‘Manhattan To Suburban’
read more
July 7, 2020
Affordability, Affordable Housing
,
Housing Trends & Cycles
,
Manhattan
,
New York City
[Spectrum TV/NY1] Stuy Town Vacancies Surge 7/6/20
read more
July 6, 2020
Analysis & Research
,
Bloomberg TV
,
Charts, Maps, Images, Infographics, Video
,
Elliman Reports
,
Housing Trends & Cycles
,
New York City
[Bloomberg TV] Bloomberg Markets 7-6-20: A Busy Housing Market This Summer
read more
June 28, 2020
Brokers, Agents, MLS, NAR
,
Explainer
,
Housing Trends & Cycles
,
New York City
,
Op-Ed
My Forbes Column: Keeping Housing Market Results From The Public Is Never Justified: An Expansive View
read more
Previous
1
2
3
Next
Load More Posts
Page load link
Go to Top