Skip to content
Services
Appraisals
Consulting
Resources
Market Reports
Charts
Matrix Blog
Articles & Research
Press
About
get in touch
Charts
› Charts, Maps, Images, Infographics, Video
September 9, 2017
Affordability, Affordable Housing
,
Charts, Maps, Images, Infographics, Video
,
Housing Trends & Cycles
Vancouver’s Epic Real Estate Boom, Visualized
read more
August 6, 2017
Charts, Maps, Images, Infographics, Video
,
Luxury, Super, Ultra, Mega
,
Market Reports
,
Media
VIDEO Nightly Business Report: U.S. Luxury Market Trends
read more
April 7, 2017
Charts, Maps, Images, Infographics, Video
,
Dutchess County, NY
,
Manhattan
,
New York Times
,
Putnam County
,
Suburban, Urban, Commuting
,
Westchester County, NY
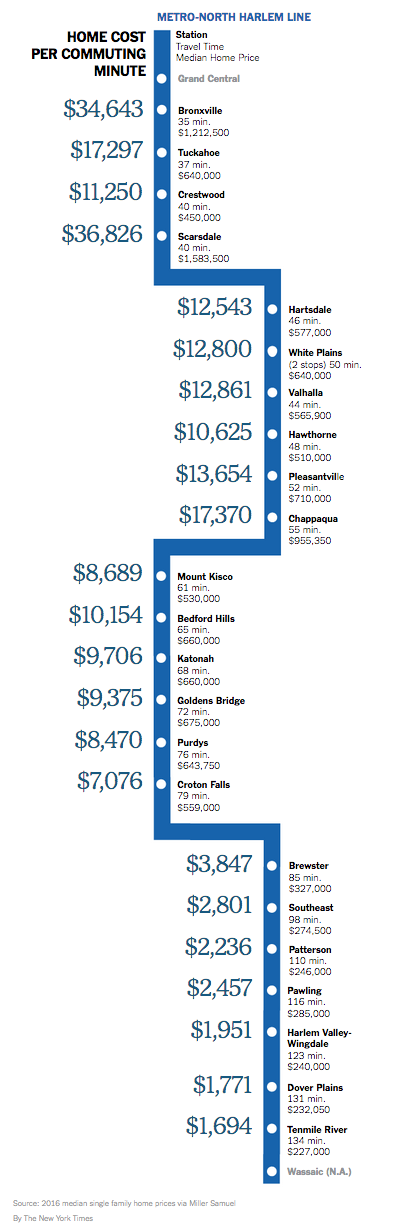
Westchester to Manhattan Commute Time by Housing Cost
read more
January 21, 2017
Charts, Maps, Images, Infographics, Video
,
Elliman Reports
,
Housing Trends & Cycles
,
Manhattan
,
New York Times
,
Statistics, Metrics & Data
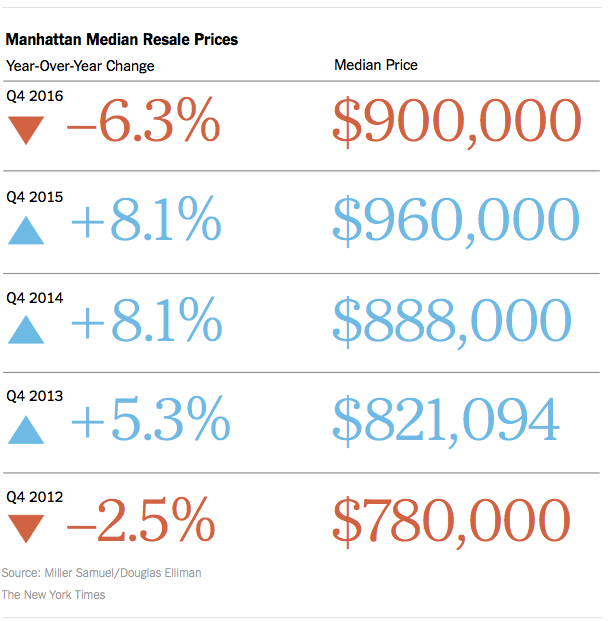
NYT Calculator Chart: The Resale Pendulum Swings Toward Middle
read more
December 11, 2016
Analysis & Research
,
Brooklyn
,
Charts, Maps, Images, Infographics, Video
,
Junk Statistical Analysis, Luck, Superstition and Coincidence
,
Luxury, Super, Ultra, Mega
,
Manhattan
,
Palm Beach
John Burns Has It Wrong, Luxury Home Sales Are Not Increasing
read more
November 30, 2016
Charts, Maps, Images, Infographics, Video
,
Historical, Landmark, Milestone
,
Housing Indices & Portals
Declaring A Housing Recovery Using A Threshold Based on Fraud
read more
November 25, 2016
Affordability, Affordable Housing
,
Analysis & Research
,
Charts, Maps, Images, Infographics, Video
,
New York Times
,
Trulia
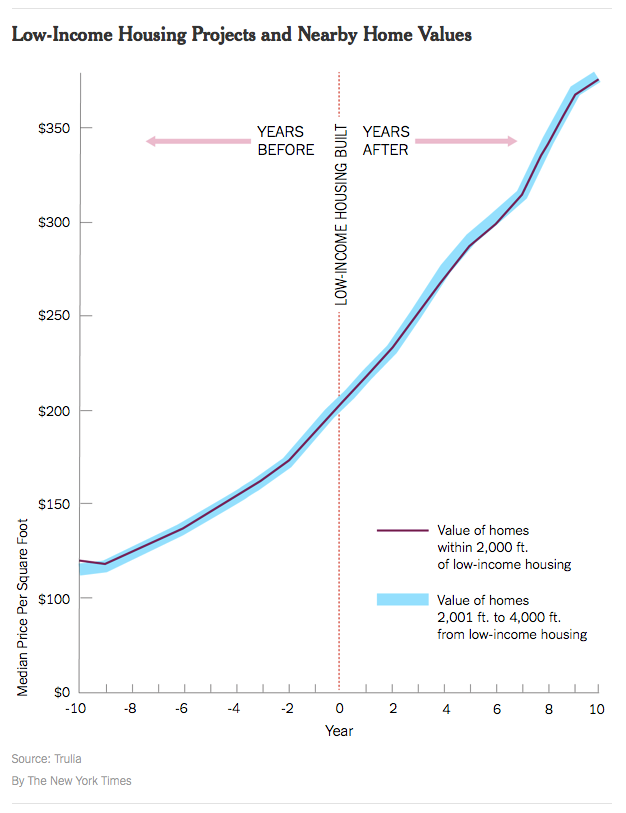
YIMBY: Low-Income Housing
read more
October 28, 2016
Affordability, Affordable Housing
,
Charts, Maps, Images, Infographics, Video
,
Fairfield County, CT
,
Housing Trends & Cycles
,
Manhattan
,
Media
,
New York City
,
New York Times
,
Suburban, Urban, Commuting
,
Zoning , Land Use, Location, Transportation
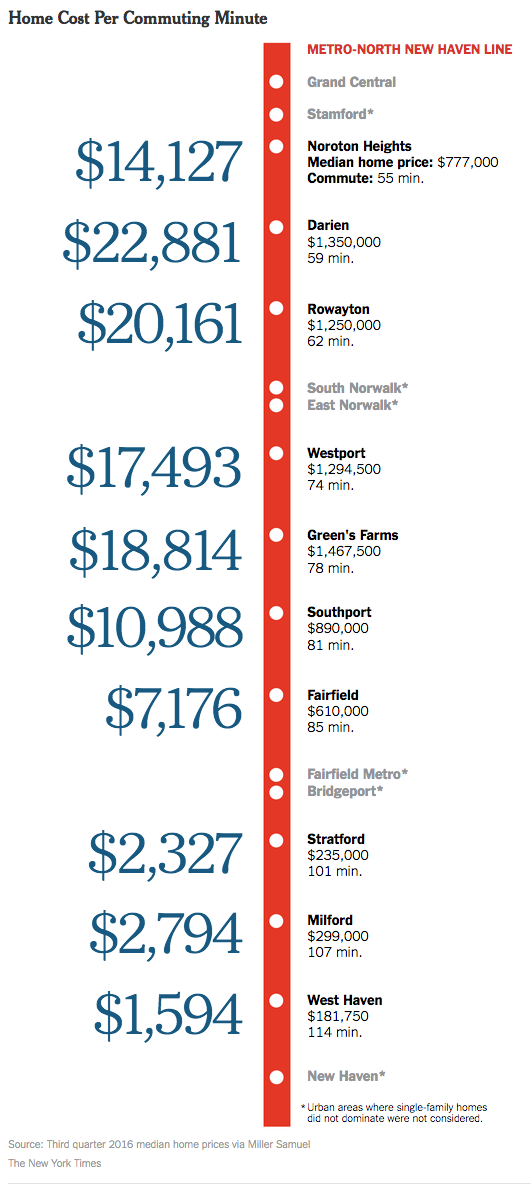
The Relationship Between Commute Time and Housing Prices
read more
October 9, 2016
Brooklyn
,
Charts, Maps, Images, Infographics, Video
,
Elliman Reports
,
Housing Trends & Cycles
,
Manhattan
,
New York Times
,
Queens
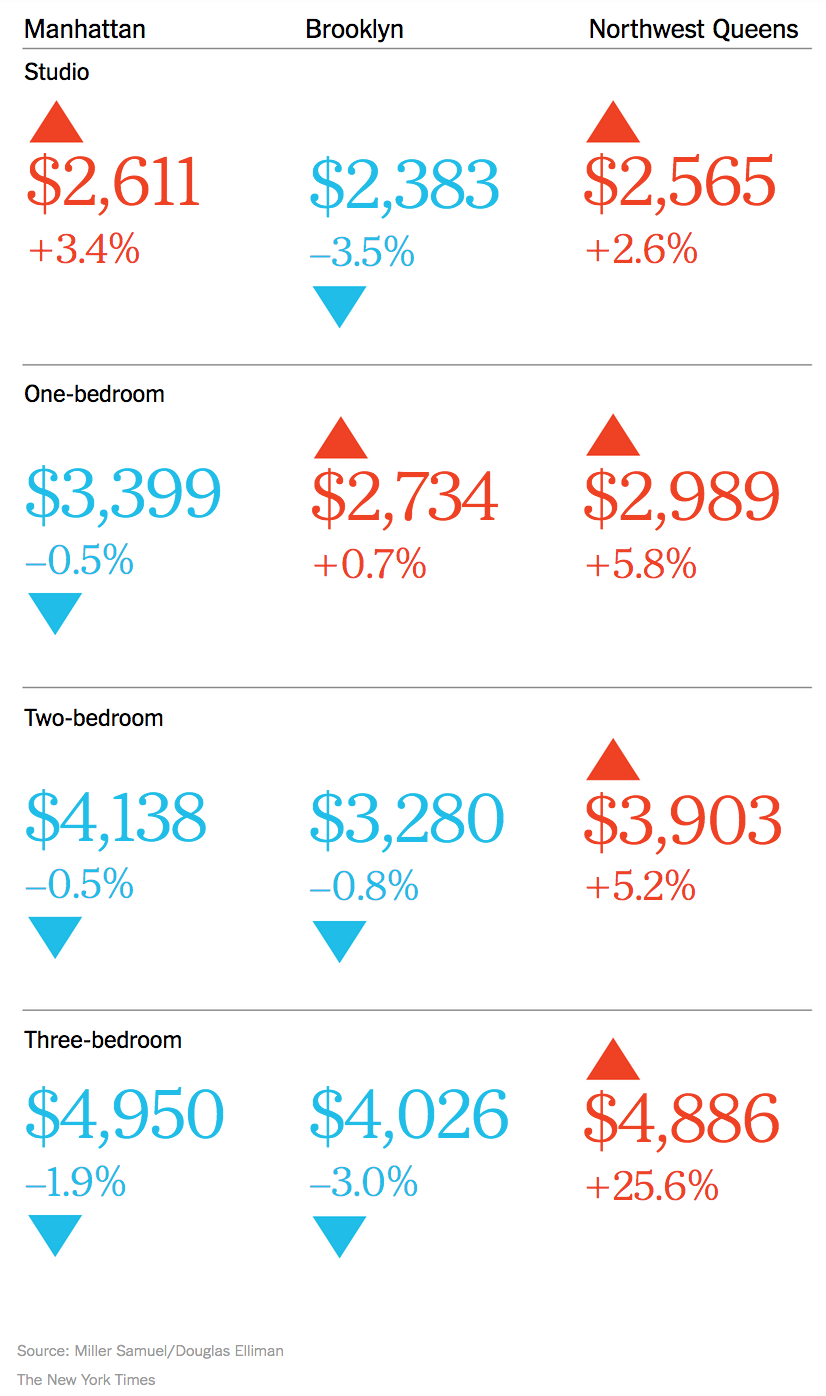
NYT Real Estate Calculator: NYC Rents Go Graphic
read more
October 6, 2016
Bloomberg TV
,
Charts, Maps, Images, Infographics, Video
,
Douglas Elliman
,
Elliman Reports
,
Manhattan
,
Market Reports
,
Media
[In The Media] Bloomberg TV: October 4, 2016
read more
August 16, 2016
Aspen
,
Brokers, Agents, MLS, NAR
,
Charts, Maps, Images, Infographics, Video
,
Douglas Elliman
,
Housing Trends & Cycles
,
Luxury, Super, Ultra, Mega
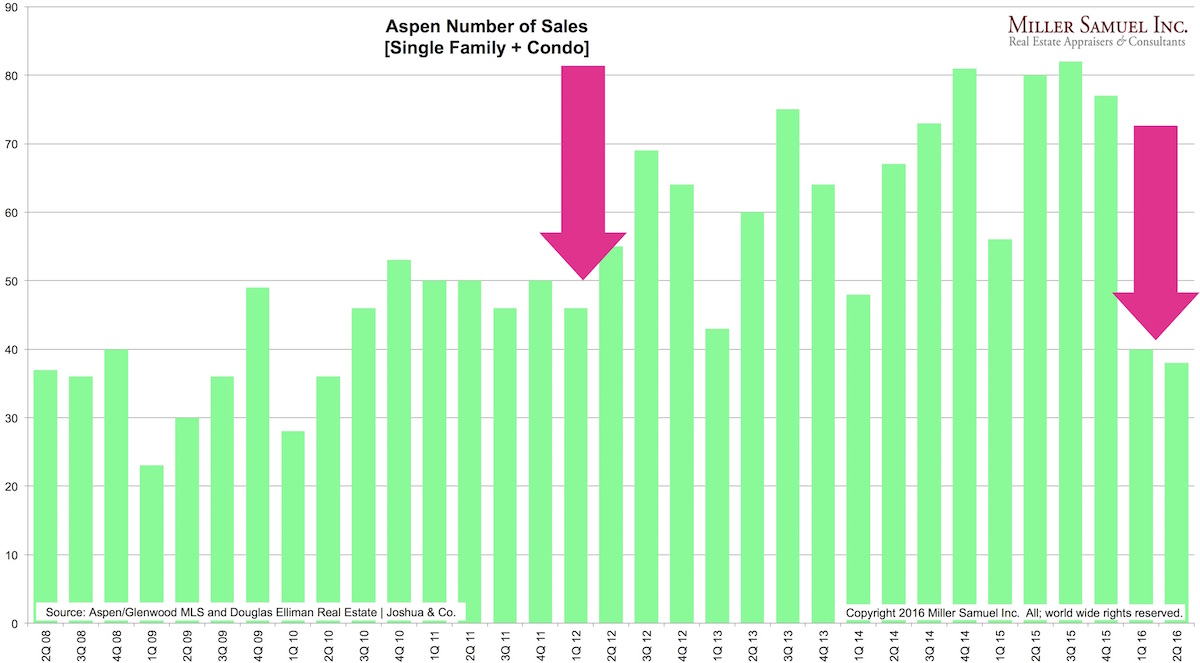
Aspen Sales “Nosedive” as U.S. Luxury Market Returns to Sea Level
read more
February 26, 2016
Boom Bubble Bust
,
Charts, Maps, Images, Infographics, Video
,
Development, Construction, Architecture & Land
,
Douglas Elliman
,
Elliman Reports
,
Fairfield County, CT
,
Housing Trends & Cycles
Greenwich CT Pre-Lehman “Reno, Then Flip” Mentality Is Long Gone
read more
Previous
3
4
5
Next
Load More Posts
Page load link
Go to Top