Matrix Blog

Posts Tagged ‘StreetEasy’

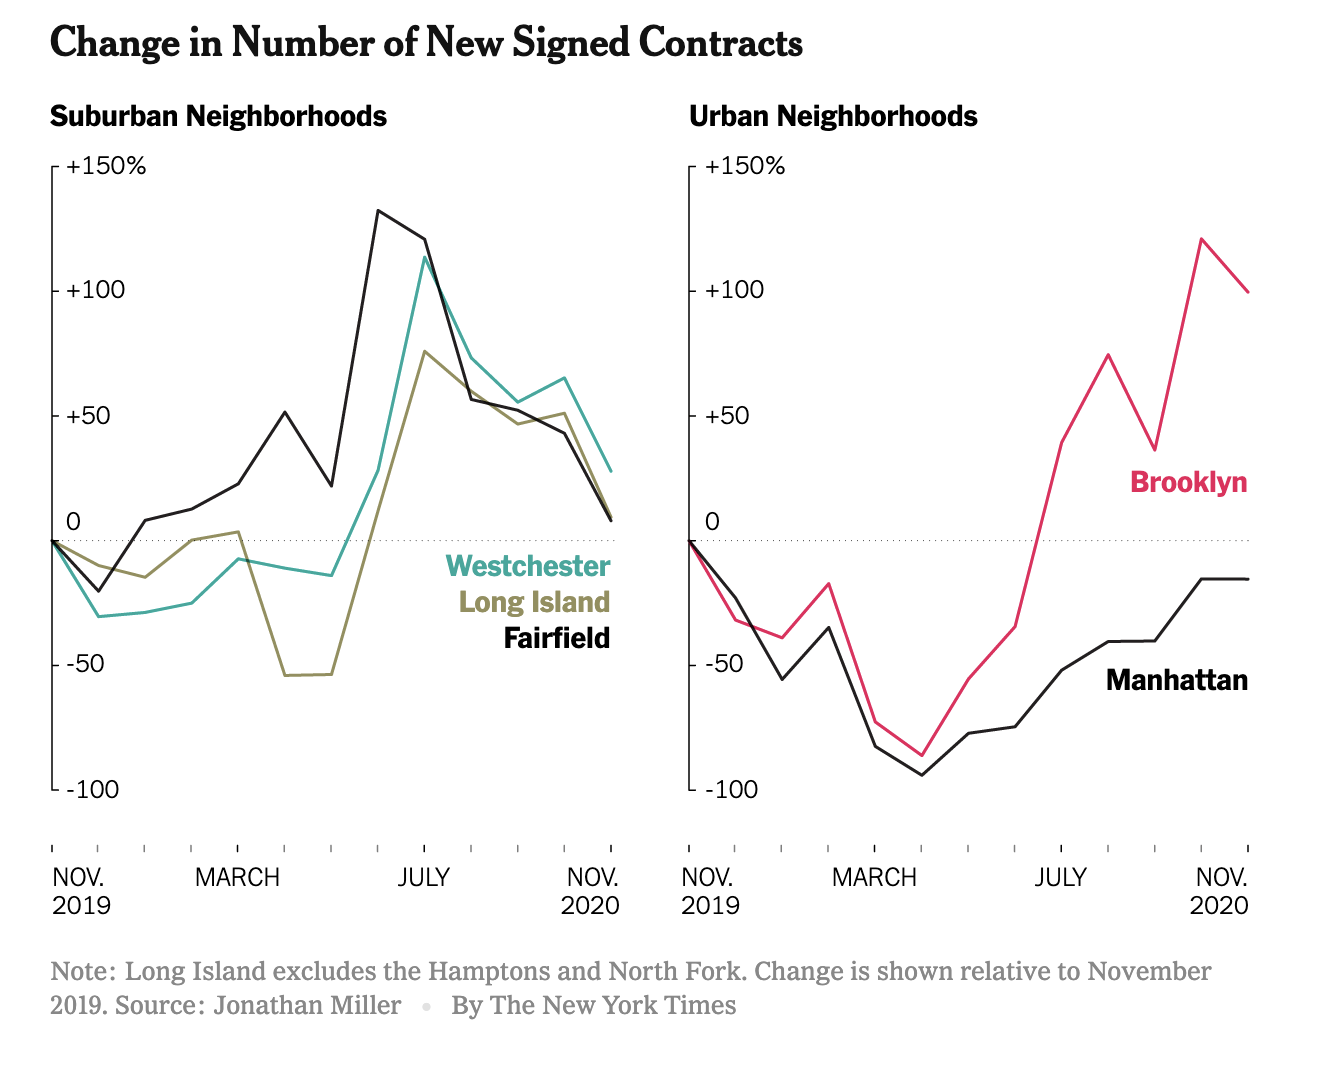
Peak Suburb Has Passed

December 28, 2020 | 2:22 pm | | Explainer |

The New York Times got the market nuances right in their epic end of year The Real Estate Collapse of 2020.

And including epic charts makes it even better.


I noticed that the Streeteasy median rent chart used in the piece shows the same pattern as my recent chart in Bloomberg. That drop in rent is gigantic.


[Source: Bloomberg – click image to open article]

Tags: , , , , , ,


My Forbes Column: Keeping Housing Market Results From The Public Is Never Justified: An Expansive View

June 28, 2020 | 5:00 pm | Explainer |

This piece was taken from my new Forbes column. I’m testing the platform to spread the word and you can help me by going here and then clicking “follow.”


Keeping Housing Market Results From The Public Is Never Justified: An Expansive View

Transparency is always the right strategy

When the Covid-19 crisis began halfway through March, the Manhattan housing market was placed on “pause,” as were many housing markets around the country. New York State “Shelter in Place” rules prevented the in-person showing of a property by a real estate broker. That was the beginning of the problem this crisis posed for the industry that lives and dies on sales and rental transactions. Then a startup agent trade group (NYRAC), made up of some of the most productive agents in the market and includes many of my long-time industry friends, pushed to hide the days on market metric from the public for what turned out to be a self-serving reason. I love what they stand for, but this was a strategic error that I could not support.

While I have been a real estate appraiser and market analyst for 35 years, I dipped my toe into real estate as a sales agent in Chicagoland for six months in the mid-1980s.

Lesson learned

From my experience there it was clear to me that the accuracy of the information our office possessed was critical to all parties for the market to function. I still have my old monthly MLS books and remember logging on to the MLS from one ancient (even then) terminal in the office – talk about delayed market information!

Days on market during Covid-19

The days on market (DOM) metric is significant to sellers because they don’t want their home to be perceived as overpriced if it sits unsold too long. DOM can be measured in several ways, but the one I see used the most is the average number of days between the last price change, if any, and the contract date (or today’s date if it has not sold.) When a potential home buyer looks at a listing on a public-facing web site, they look at DOM as one way to determine whether the listing price is reasonable. The longer a listing sits on the market as compared to other listings, the more likely it is over-priced. Sellers look at DOM too and become concerned when their listing sits too long relative to the competition, typically blaming the agent for not marketing the property enough. However, the asking price is usually set by the seller who is slow to recalibrate their asking price if the market is weakening. I’ve found it takes one to two years for a typical seller to capitulate on price in a downturn and not feel like they left money on the table.

Hiding DOM as a marketing strategy

When the government ordered lockdown hit New York City, and real estate agents were not allowed to provide in-person showings, market activity immediately stalled. NYRAC pressured various platforms to hide DOM information from listings. They still wanted users to be able to drill down and uncover the details, but at first glance, the DOM information was to be hidden.

Streeteasy (owned by Zillow), the de-facto Manhattan multiple listing system in the eyes of the consumer, and the Real Estate Board of New York (REBNY), the leading real estate trade group with their own platform known as RLS, initially balked at the manipulation but eventually caved to NYRAC pressure. NYRAC made a strategic error that further damaged the long-term credibility of the real estate brokerage industry with the consumer. Not all brokers agreed with this strategy either, but this group placed enough pressure on these platforms to make the change happen.

Only sellers matter?

The incentive to “partially” hide DOM comes down to this:

1) Give the sellers a “break” after two years of softening price trends.

2) Address the sellers’ concerns about extended marketing times during the pandemic.

3) But the primary reason is that real estate brokers didn’t want to lose their listings if the sellers removed them from the market and returned to the market later with a new agent.

Why this effort was wrong

NYRAC and several real estate agents said to the effect, “the buyer or seller can still look at the listing history to know how long a listing has been on the market. That data was never removed.”

I always respond with “Then why hide it in the first place?” To brokers in favor of this temporary rule who wonder why I appear to be obsessing about a nuance I say, it is never appropriate to manipulate data, made even worse by the primary motivation behind this action.

Ignoring the buyers

This “solution” ignores the buyer’s position in a sales transaction and yet last time I checked, buyers are on the other side of every sale. Any effort to partially or fully hide DOM results or any other market metric conveys the wrong message and smacks of the old “information gatekeeper” mentality, no matter the state of the market.

Recently, the official word came down that all days between the shutdown and the reopening will count as “one day” for the DOM calculation presented to the public.

Going forward I have the following questions:

  • Are we to anticipate a suspension of DOM anytime there is an unexpected external event that impacts the housing market (9/11, The Lehman Brothers bankruptcy, Super Storm Sandy)?

  • Who makes the call to do this? A trade group, a regulatory body, a for-profit platform?

-Do we think that buyers and sellers of real estate are unaware of the 90+ day COVID-19 market shut down? Will a new listing added today as the market opens with 1 DOM will sell differently than an identical property with a 91 DOM listing that sat through the 90+ day COVID-19 lockdown?

The market doesn’t care what the brokerage community thinks (or what I think). The act of intentionally hiding or partially hiding data from the consumer is never justified in any scenario.

Tags: , , , , ,


Billionaires Row Continues to be Challenged

May 4, 2019 | 11:09 am | Infographics |

It’s been no secret that super luxury Manhattan sales have been the hardest hit segment of the market since 2014. The slowdown is related to the oversupply of new development created from the vast amounts of capital looking for a home since the financial crisis. Perhaps the most famous representation of the super-luxury market has been “Billionaires Row” centered on 57th Street in the heart of Manhattan’s central business district in Midtown Manhattan. The introduction of supertalls to the skyline has provided never before expansive views to the buyers.

I was asked by the New York Post to provide a snapshot of this submarket. Since contract data is not public record and is easily manipulated, I estimated the state of the key buildings as best I could, using ACRIS for closed sales, Streeteasy contract tags, and feedback from market experts in and around the brokerage community. The result was really no surprise to anyone in the real estate business but because it was concentrated in one place, the story went viral. Curbed wrote a good follow-up as well.

Tags: , , , ,


Zillow Acquires StreetEasy, Goes Vertical, Literally

August 19, 2013 | 10:41 am | |

I was reading my twitter feed and it just jumped out at me: Zillow announced their acquisition of StreetEasy for $50M in cash. I also heard it simultaneously on the show Bloomberg Surveillance. Their CEO Spencer Rascoff will be on the show tomorrow morning to talk about the acquisition.

While there will be lots of prognosticating about Zillow‘s entrance into the NYC housing market through a heavily used resource like StreetEasy (Zillow was here already, just not taken very seriously).

I think there’s a bigger story for Zillow. If Zillow leverages the StreetEasy data presentation model, Zillow will be shaking up the housing market real estate information space across the US.

Think highrise urban housing markets – I call them “vertical” markets (not to be confused with “vertical” in marketing parlance).

• All national data aggregators and brokerage companies haven’t yet figured out vertical housing markets yet in terms of their presentation of information.
• MLS systems remain firmly single family orientated and have yet to present data in highrise markets in a visually logical way – ie co-ops and condos. Symbolic of the general primitiveness of MLS systems in handling multi-unit housing, one MLS system in the NYC metro area still tags “co-ops” as “condos.”

Kudos to Streeteasy for shaking up the market from day one. When they launched, StreetEasy became the housing data resource of choice for most in NYC. I met most of the team a while back and I was impressed with how a small group of people could really shake things up in a huge market. While presenting clean data in a very dirty data environment continues to be a challenge, I think their greatest contribution to the housing market has been how they displayed their information – in a way that consumers screamed for.

Tags: ,


[Spring Market] In Like a Lion, Out Like a Lamb

June 11, 2010 | 12:01 am | |

I’m making up for lost time, not having taken art classes in school…

In the New York City metro area, prices were generally stable – the story this spring was really all about transactions. In today’s New York Times, Vivian Toy’s piece: Spring Real Estate Market Roars In but Tiptoes Out Early describes the robust sales activity that occurred in the first three months of the year but peaked by mid-April, two months early. Sales continued to remain elevated through May and June, however. Does this mean that the market is poised to slip?

Who knows?

This article portrays what we observed in our practice and it was corroborated by StreetEasy‘s contract data. This could be explained by the federal tax credit expiration in much of the US housing market, but probably less so in Manhattan due to the high price point:

Housing sales activity rose across the country in March and April, in anticipation of the April 30 deadline for the $8,000 first-time buyers’ tax credit. But economists and brokers say the tax credit was probably a less powerful incentive in Manhattan, where the average sales price for an apartment is $1.4 million.

And price metrics are rising.

Seeing another sign that the market is on the mend, Pamela Liebman, the president of the Corcoran Group, said that the average price on signed contracts at Corcoran had climbed to $1.5 million in May, from $1.31 million in February.

However, it is important not to confuse this increase with rising prices. The high end market simply “woke up” in the beginning of the year and is skewing the overall numbers. We saw this happen to our 1Q 2010 market stats. Plus its a seasonal phenomenon to see the aggregate numbers rise in the spring.

But nationally, housing market indecision is on the rise.


Tags: , ,

Get Weekly Insights and Research

Housing Notes by Jonathan Miller

Receive Jonathan Miller's 'Housing Notes' and get regular market insights, the market report series for Douglas Elliman Real Estate as well as interviews, columns, blog posts and other content.

Follow Jonathan on Twitter

#Housing analyst, #realestate, #appraiser, podcaster/blogger, non-economist, Miller Samuel CEO, family man, maker of snow and lobster fisherman (order varies)
NYC CT Hamptons DC Miami LA Aspen
millersamuel.com/housing-notes
Joined October 2007