Matrix Blog

Posts Tagged ‘New York Observer’

An Honest Appraisal – Some Personal Background Including My Favorite Color and Love of Yo-Yos

July 30, 2015 | 9:59 am | Articles |

A while back, Kim Velsey at New York Observer reached out and thought it would be interesting to do a profile on me. Who wouldn’t like to talk about themselves for hours? What an opportunity! LOL. Uh, Yes?

We met and she proceeded to “drain my soul” as I am fond of saying – by the end of the interview my head was spinning and I wasn’t quite sure what I had said or if I would look foolish (the sign of a good interviewer). I was also getting a little worried when I started hearing through the grapevine who she was reaching out to – in other words, this was an actual, real interview profile thing!

It turned out to be a fun, extensive, and detailed read that captured a very fair and accurate picture of me for which I am very grateful (and relieved).

Jonathan Miller Is the Most Trusted (and Quoted) Man in New York Real Estate An Honest Appraisal by Kim Velsey July 29, 2015

Tags: , , ,


Manhattan Diverged From NYC At US Housing Boom Peak

February 14, 2013 | 10:54 am | | Charts |


[click to expand]

As the above chart illustrates, the aggregate median housing price in New York City, based on co-op, condo and 1-3 family property sales, with and without Manhattan sales go their separate ways circa mid-2006, at the Case-Shiller Home Price Index peak of the national housing market. This also makes the decline in the New York Case Shiller HPI all that more maddening (because it’s not Manhattan, or co-ops or condos or new development and includes Long Island, Fairfield, Westchester, Northern New Jersey and a county in Pennsylvania).

The market share for new development sales in Manhattan peaked in 2Q 06 at 57.9%. The 4Q12 market share was 12.5% but fear not, more new development is coming per The Real Deal.

During the boom through today, the shift in the mix towards Manhattan luxury property, largely from the combination of new development activity as well as vigorous Wall Street and international demand has expanded the difference between Manhattan and the rest of New York City. In other words, the gain in median sales price for NYC was caused by a shift in the mix toward higher end properties.

Tags: , ,


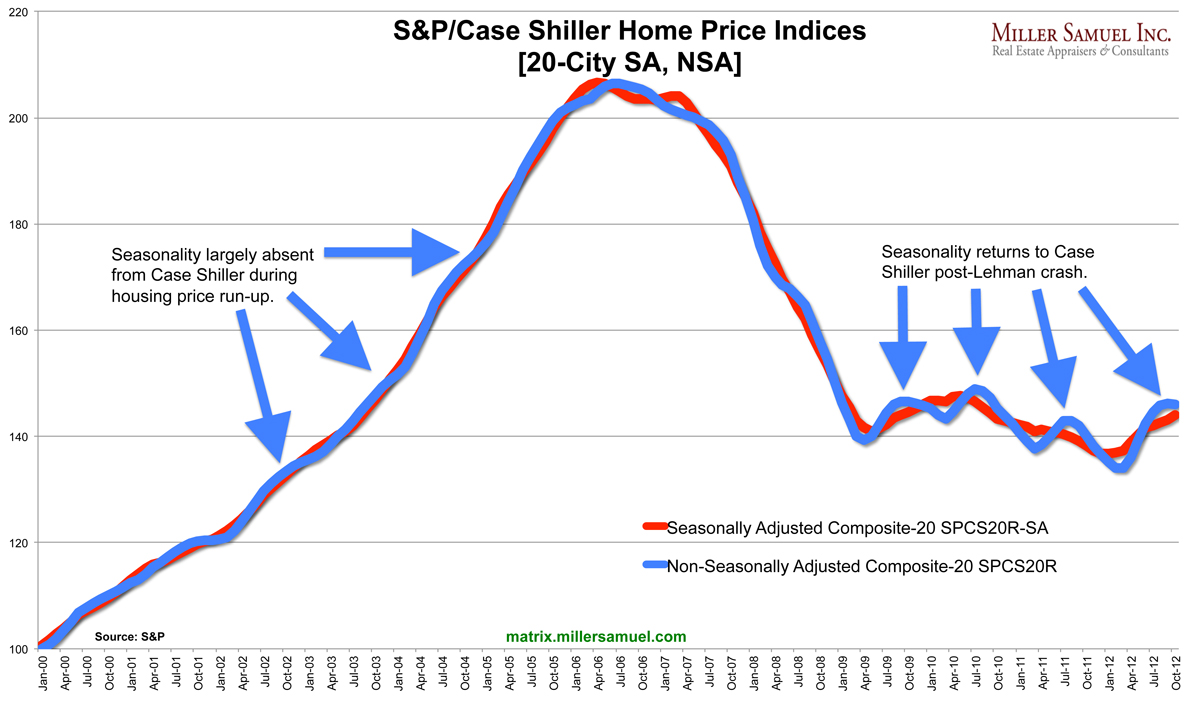
[Case Shiller] Recovery Is Back In Season

December 27, 2012 | 7:00 am | Charts |


[click to expand chart]

Well the frequently maligned but most influential housing metric was published yesterday, the S&P/Case Shiller Home Price Indices and the 20 City index rose 4.3% year-over-year. The only two “regions” to see declines were Chicago and New York.

Baseball Correlation? Chicago and New York are the only 2 cities who also have 2 Major League Baseball teams. No, Los Angeles doesn’t have two MLB teams…the Los Angeles Angels of Anaheim are clearly trying to have it both ways.

But I digress…

With all the talk about “recovery” (aka happy housing news) these days it just dawned on me that since 2000, the Case Shiller HPI only began to show significant seasonality since mid-2009. No one has really talked about this and I’m not sure what it means, but it just jumped out at me today.

Pre-peak housing prices fueled by falling lending standards and the seasons were largely crushed by the locomotive known as the housing boom. Therefore the seasonally adjusted and non-seasonally adjusted price trends were virtually the same during the market’s ascent. I distinctly remember real estate agents commenting during this period that the seasons were going away and housing market patterns were changing permanently.

Post-peak housing prices After the plunge subsided in mid-2009, the market began to ebb and flow with peaks in the spring/summer and troughs in the fall/winter.

Note to self
The next time CSI prices begins to smooth into nothingness, perhaps it’s a housing boom, baby.

Tags: , , ,


[The Housing Helix Podcast] Robert Knakal, Chairman, Founding Partner, Massey Knakal Realty Services

November 20, 2009 | 4:26 pm | Podcasts |


I sit down with Bob Knakal, the founding partner and Chairman of Massey Knakal Realty Services, who sell more commercial properties in New York City than any other firm. In 2009, Real Estate Forum magazine named Mr. Knakal one of the top 10 investment sales brokers in the United States.

He’s also a prolific commentator on the commercial real estate economy. Check out his blog StreetWise which is an initiative of his firm and GlobeSt.com as well as his weekly commentary in the New York Observer’s Commercial Observer. His recent State Shouldn’t Make a Whole New Ball Game of Mitchell-Lama is mandatory reading (no, not because of the Yankees World Series analogy).

I have long admired his market insights and his hair. We have a great conversation.

Check out the podcast

The Housing Helix Podcast Interview List

You can subscribe on iTunes or simply listen to the podcast on my other blog The Housing Helix.


Tags: , , ,


[Interview] Robert Knakal, Chairman, Founding Partner, Massey Knakal Realty Services

November 20, 2009 | 12:01 pm | Podcasts |

Read More

Tags: , , ,


[Central Park v. Detroit] $363,538,692,000 v. $4,500,000

October 26, 2009 | 11:57 pm | |


Source: Google Earth

Back in 2005, I did a fun exercise for New York Magazine – I was asked to value Central Park (just for fun) in about 3 minutes. It was within an article that ranked the reasons to love New York and was item number 3.

The New York Observer recently asked me to update this calculation using the same methodology (in 3 minutes and just for fun) and I came up with $363,538,692,000 which is a far cry from $528,783,552,000. The same disclaimers apply as the original effort, seriously.

To put this in perspective, about 9,000 Detroit properties were auctioned (hat tip WalletPop) with opening bids of $500. Only 20% received bids. The total land area of these properties was equivalent to Central Park. If all 9,000 properties received a bid of $500 (which is probably not far off if you assume the 20% that received bids were over $500 and the rest $0), that represents a total value of $4,500,000.

Thats’s not much of a value and these properties also pull down values around them – plus they are off the tax roll placing more financial burden on existing properties.

Not a good sign
Most of the bidders were investors and vacant land in Detroit equals the entire footprint of Boston.

As much as I love my time spent in Michigan and my relatives there, I believe this is called an economic failure spiral.


Tags: , ,


[86’d] Up A Notch In Power Poll

June 3, 2009 | 11:45 am | Public |

The New York Observer, and it’s heavy coverage of New York City/Hamptons real estate released its annual (and obviously highly scientific research of an empirical topic):

The 100 Most Powerful People in New York Real Estate

After a year of hard work burning the midnight oil seven days a week, I was able to move up one position to 86. Goal met. Life is good.

It’s not clear how a real estate appraiser became one of the most visible real estate icons this side of Dolly Lenz, but when the media-savvy, Web-connected Mr. Miller speaks, New York listens. His market reports are like a quarterly Super Bowl.

Hey, I’m the only appraiser on the list.

Ok, back to work.

Tags:


[Public] Tonight’s Observer Living Real Estate/Tomorrow AM Bloomberg Surveillance

May 14, 2009 | 3:05 pm | | Public |

Fun tonight!

I hear that 1,000+ people are registered to attend the Observer Living event (although I think the room where we are speaking is half that size).

8:00 PM – Panel #3: State of the Residential Market
Moderated by: Tom Acitelli, Location Editor, The New York Observer

Featuring:

  • Ivanka Trump, EVP, The Trump Organization;
  • Dottie Herman, President/CEO Prudential Douglas Elliman;
  • Pam Liebman, CEO/President, Corcoran;
  • Jonathan Miller, CEO/President, Miller Samuel

Topics:

  • Pricing: The $1.8 Million Question
  • Refinancing
  • New Condos vs. Condos vs. Co-ops
  • State o’ Things: Misconceptions and Perceptions
  • Where to Buy in New York

Tomorrow morning at 7am on Bloomberg Radio am 1130 – I’ll be the first guest on Bloomberg Surveillence with Tom Keane and Ken Prewitt to kick off a show on the housing market. I listen to the show via podcast nearly every day – always interesting.


Tags: , , ,


[Why It’s Not Just About Price] The $39 Dollar Suit Story

March 9, 2009 | 11:30 am | |

In late January I was interested in purchasing a suit. A regional department store was having a 50% off sale on men’s clothing so I thought I’d go take a look. I found a suit I liked which retailed for $795 less 50%. Once I had it fitted, I took the suit to the register where it was scanned and I was told the price was $39.

“What?” I was confused.

The store clerk proceed to explain a myriad of 50% off of 40% off of 70% off of 20% of the retail price less an additional 10% and on and on. The employee seemed a little embarrassed but was adamant the price was correct even though it was less than my alterations.

And then I turned and looked around the store. A Saturday afternoon with this kind of discount:

NO ONE WAS IN THE STORE.

If this scenario occurred two years ago, it would have been like a scene from the movie the “300” with carnage and piles of bodies clamoring for the last suit on the rack.

And that’s what is wrong with the economy right now – it’s not all about price. It’s also about confidence.

I asked the clerk to hold the suit while I went and bought 4 more as well as other accessories for similar discounts. I ended up spending what I intended to in the beginning, but got about 20 times the merchandise.

As I walked out of the store, I felt miserable, convinced more than ever the wheels were coming off our economic wagon and that this type of discounting was not free – we would end up paying for it in other ways.

I have been including this experience into (aka weaving them into the fabric of – sorry) most of my speeches as of late because I think it captures the essence of what’s going on at the moment.

But I still like the suits.


Tags:


[When Brooklyn Was The World] 4Q 2008 Brooklyn Market Overview Available For Download

January 14, 2009 | 10:08 pm | | Radio |

The 4Q 2008 Brooklyn Market Overview that I author for Prudential Douglas Elliman was just released.

The President and CEO of Prudential Douglas Elliman, Dottie Herman, is a big believer in publishing market data to create more transparency for consumers in the market her firm serves – Manhattan to Montauk.

Other reports we prepare can be found here.

Customized tables for the 4Q 2008 Brooklyn [data](https://www.millersamuel.com/data) and a series of updated [charts](https://www.millersamuel.com/charts/index.php?Node=1215666045XVpiJ) are available on our corporate site.

A report excerpt

…The median sales price was $490,000, down 7.5% from the prior year quarter result of $530,000 and down 3.9% from the prior quarter result of $510,000. The year over year change in quarter median sales price has declined for 5 consecutive quarters beginning in the fourth quarter of 2007 when the decline was 0.9%. Subsequent quarters resulted in declines in this metric of 1%, 1.9%, 5.6% and 7.5%. In addition, this is the first time the indicator fell below $500,000 since the first quarter of 2006 when the median sales price was $499,500. Average sales price for the quarter was $559,338, down 5.2% from the prior year quarter average sales price of $590,169 and down 2.8% from $575,287 in the prior quarter. Brooklyn showed declines in median sales price more than a year ahead of Manhattan…

The media coverage of the report is available here as they were obtained (in no particular order). In addition, the headlines and respective links to articles listed below are a fun way to see how the media interprets the report content since every outlet was working off the same information.

Print/Web

Brooklyn Apartment, Home Prices Drop 7.5% as Recession Hits [Bloomberg]
Brooklyn Housing Boom: Dude, It’s So Over [New York Observer]
Q4 Brooklyn Reports Show Bloodletting, Except Brownstones [Curbed]
Brooklyn housing market still suffering [Crains]
Brooklyn apartment sales prices fall 7.5 pct -report [Reuters]
Brooklyn Real Estate Begins to Collapse, Too [Gothamist]
Brooklyn apartment sales prices fall 7.5 pct -report [Forbes]
Brooklyn Real-estate Market Reports: More Sobering News [New York Mag]
Elliman: Condos Down, Co-ops Flat, Brownstones Up in 4Q [Brownstoner]
Brownstone Brooklyn prices unscathed in fourth quarter [The Real Deal]
Brooklyn Housing Market Hit [WNYC]
Experts: Real-estate boom about to go bust [The Brooklyn Paper]

Radio

4Q 08 Brooklyn Market recap [WNYC Radio]
Brooklyn Housing Market in 4q 2008 [Bloomberg Radio]


Tags: , , , ,


Editorializing The Real Estate Hype

January 13, 2009 | 2:10 am | |

In the current issue of Crain’s New York Business, there was an editorial on the hyping of real estate. I thought it was pretty good, especially ’cause I was named as the voice of reason.

If the top 10% of transactions (those for more than $3 million) were excluded, Manhattan apartment prices were flat for the past two years, notes Jonathan Miller, the appraiser who is the savviest observer of the local residential market. In fact, Mr. Miller has been pointing out for most of the past year that the activity in the most expensive segment was distorting the average price and that the decline in the number of transactions spelled trouble. He always insisted that Wall Street bonuses drove the market, not international buyers.

The concept for sharp-minded people:

Live by the sword,
die by the sword

My observations of real estate professionals in housing markets as they begin to weaken seems to go like this:

  • Over hype the positive
  • Spin, misdirection
  • Denial
  • Disbelief
  • Passive acceptance
  • Jump on the bandwagon
  • Over hype the negative

Many agents are doing a better job in relating to the current environment, but there are still stragglers.

I had an agent come up to me last week after I spoke at the Inman conference on Friday and asked

why do you paint the market so “negatively”? How can you possibly know what the numbers really are?

Good grief.

I’d like to consider myself a “neutral observer.” I got beat up in 3Q 05 and again in 1Q 08 when we had significant evidence of weaker conditions. The punishment often came from top agents, who perhaps had more to lose? In each case our results were status quo after acceptance of the new market was realized – usually 1-2 quarters later.

Change can be hard to deal with.


Tags: ,


[Solid Puff Piece] Goldman Research Note Clouds Manhattan

January 13, 2009 | 1:43 am | |

On Thursday there was a widely viewed and discussed research letter by Goldman Sachs covering the Manhattan housing market. Lockhart Steele at Curbed first reported it on Thursday, followed by the WSJ on Friday.

I thought Lock broke it down thoroughly — Curbed style — and there was nothing more to it. Later, I got about a bunch of emails asking for my thoughts on the research note so I thought I would take another look (since my work is part of their commentary).

I placed the full text of their research note at the bottom of this post.

Frankly, I thought the Goldman research letter was surprisingly thin, with weak logic and a bit self-serving since Goldman was the first licensee of the S&P/Case-Shiller Home Price Indices.

Some of my observations about their observations:

  • Goldman predicts housing prices will drop a total of 35% to 44% to late 1990’s levels. (Since prices have already fallen 20%, that means we are halfway there.)
  • Goldman uses the phrase “these types of arguments are difficult to quantify and are often heard just prior to a real estate market downturn” twice in this paper. Gotta love boilerplate!
  • Goldman refers to me as an analyst (dammit Jim, I’m an appraiser not an analyst! a la “Bones” on Star Trek) as in “one analyst estimated that the prices of apartments that were under contract but had not yet closed fell by 20% from August to December.”
  • Goldman criticizes the “brokerage reports” for not considering price per square foot since the firms publish mean and median prices for both co-ops and condos on a quarterly basis, but these are difficult to interpret due to significant changes over time in the size and quality of apartments being sold. Of course the report I prepare as well as my competitors’ reports all use price per square foot as a basic price metric. I was the first to do this many years ago for the co-op market.
  • Goldman alludes to one of the research companies cited as having only one year of price per square foot data. Of course Goldman forgot to mention our reports contain price per square foot data going back to 1989 broken out quarterly and annually by number of bedrooms (size) and property type (co-op, condo and 1-5 family).
  • Goldman relies on only matched price observations involving successive transactions in the same condominium for estimating the overall change in prices. This is actually a logical point. Since about 38.3% (in 4Q08) of condo sales were from new developments, using them as a basis of establishing a trend would reflect market conditions 12-18 months ago when the typical contract was signed. Any report or index that does not extract new development from the condo sales data can be as much as 12-18 months behind the market. I have found re-sale activity to be more reliable for establishing condo price trends which is something that can be captured using the CSI repeat sales methodology, despite many reservations that I have.
  • CSI continues to omit co-ops from its product suite, which represents about 75% of the housing stock in Manhattan. Which begs the question: “How do you track a housing market without 75% of the housing stock considered?”
  • Goldman uses the CSI index (which covers all of New York City, not the individual boroughs) yet analyzes income in Manhattan to establish ratios for affordability. This is perplexing to me since prices in the outer boroughs are half their equivalent in Manhattan. With the way this part was written, I get the feeling that using the CSI index was simply easier to plug into their ratios.

In short, I see this research note is more of a “puff piece” using the “faith and credit” of Goldman’s brand to hump the new Case Shiller condo index which was why I didn’t pay much attention to the Goldman report when initially released. I understand it is not a white paper, nor was it meant to be backed up by lots of footnotes and appendices. However, the fact that it was released by the gold standard of (former) investment banks, is a bit disappointing.

Here it the research note text:

We use the recently introduced S&P/Case-Shiller index for condominium prices to assess the valuation of the New York apartment market. Although housing market valuation typically has little predictive value for the near term, it is useful for anticipating longer-term moves, especially when prices are far away from equilibrium.

Indeed, New York apartment prices are very high relative to the observable fundamentals. Using three alternative yardsticks—price/rent, price/income, and affordability —we find that prices would need to decline by 35%-44% to return to the valuation levels seen in the 1995-1999 period, before the start of the recent boom.

The uncertainty is substantial. On the one hand, the picture would worsen further if per-capita incomes in Manhattan returned from their current level of 3 times the national norm toward the pre-1990s average of 2 times the national norm. On the other hand, it would brighten somewhat if jumbo mortgage rates converged toward conforming rates, perhaps because of a broadening of the Fed’s support measures. In addition, societal and demographic changes could also help, though these types of arguments are difficult to quantify and are often heard just prior to a real estate market downturn.

Following a decade-long boom, activity in the New York City apartment market is now slowing sharply. The sales reports for the fourth quarter of 2008 released on Monday by two of the largest New York real estate brokers—the Corcoran Group and Prudential Douglas Elliman—suggest that sales dropped by 25%-30% from the fourth quarter of 2007 (see “Striking Declines Seen in Manhattan Real Estate Market,” New York Times, January 6, 2009, page A20). Although the prices of closed sales were little changed from a year earlier, one analyst estimated that the prices of apartments that were under contract but had not yet closed fell by 20% from August to December. Moreover, it is well known that prices lag sales activity in the housing market, so most observers agree that both contract and closing prices are likely to decline in the near term.

Information on sales and price momentum is very helpful for predicting near-term moves in the real estate market. But in order to gauge the longer-term outlook, it is better to look at fundamental valuation indicators, such as the level of prices relative to rents or incomes, either directly or adjusted by mortgage interest rates. These types of variables don’t have much predictive power over the near term, but they start to become much more powerful at horizons longer than 1-2 years.

Until recently a fundamental analysis of the New York apartment market was hampered by the lack of high-quality price data. The various brokerage firms publish mean and median prices for both co-ops and condos on a quarterly basis, but these are difficult to interpret due to significant changes over time in the size and quality of apartments being sold. In addition, research firm Radar Logic, Inc., publishes a “price per square foot” series for the New York condo market. However, there is only a year’s worth of history, and changes in the average quality of homes sold can still distort the data even though the Radar Logic approach does control for variations in size.

But the data situation has improved dramatically with the recent broadening of the S&P/Case-Shiller (CS) repeat sales home price index to cover five of the nation’s largest condominium markets, including New York. These indexes stretch back to 1995—not as far as we would like but much better than what is available currently—and they adjust for changes in both size and quality of the condos by using only matched price observations involving successive transactions in the same condominium for estimating the overall change in prices.

Admittedly, a repeat sales index does not perfectly adjust for quality changes. In theory, the bias could work in either direction. On the one hand, wear and tear will reduce the value of a given condominium over time if the owner does not look after the property well. On the other hand, upgrades such as new flooring or a nicer kitchen may raise the value. While the CS index seeks to eliminate the influence of these factors by downweighting price change observations that are far out of line with local comparables, this is unlikely to eliminate all sources of bias. Still, we believe that a repeat sales index is far superior to the available alternatives for the purpose of measures changes in underlying real estate prices.

In analyzing the data, it is useful to look first at the raw numbers for New York condo prices. As shown in the table below, nominal prices tripled from 1995 to 2006, went essentially sideways in 2007, and have declined by about 3% in 2008. The stability since 2005 is somewhat at odds with reports from the New York real estate brokers that still show meaningful gains in mean and median prices over this period. However, we suspect that the apparent contrast is resolved by a shift in transactions toward larger and higher-quality apartments over this period, which would increase the mean and median price figures but leave the CS index unaffected.

Index

(Jan 2000=100)

Oct-95 75.3

Oct-96 75.4

Oct-97 80.6

Oct-98 89.2

Oct-99 97.5

Oct-00 111.3

Oct-01 126.7

Oct-02 144.3

Oct-03 161.2

Oct-04 188.8

Oct-05 222.6

Oct-06 227.4

Oct-07 226.7

Oct-08 221.1

Source: Standard and Poor’s.

But are the price gains sustainable? To assess this, we focus on three primary valuation measures:

  1. Price/rent ratio. We divide the CS index by the Bureau of Labor Statistics’ index of owners’ equivalent rent for the New York metropolitan area, and index the resulting ratio to 100 for the average of the 1995-1999 period. We choose this base period because it mostly precedes the recent boom but covers a period when the quality of life in Manhattan had already improved significantly from the 1980s and early 1990s. Hence, a return to the average 1995-1999 valuation level might seem like a fairly neutral assumption.

  2. Price/income ratio. We divide the CS index by the Bureau of Economic Analysis’ measure of personal income per capita, and again index the resulting ratio to 100 for 1995-1999. Although the condo price index covers the entire New York metro area, we use an income series for the County of New York (i.e., Manhattan) rather than the entire metro area. The New York condo market is quite concentrated in Manhattan; this concentration is particularly pronounced in the CS index because it is weighted by value rather than units and therefore typically assigns a much greater weight to condo sales on Fifth Avenue than in Queens. (Note that New York County income is only available through 2006; we somewhat optimistically assume that it has grown at the average national rate since then.)

  3. Affordability. Using a standard mortgage calculator and assuming both a jumbo mortgage and a 30-year maturity, we calculate (an index of) the share of Manhattan per-capita income spent on condo mortgage payments at the current level of the CS index and the current level of jumbo mortgage rates. We again index the resulting ratio to 100 for 1995-1999.

The table below shows what all three of our indicators say about the current valuation level, as of October 2008. We focus on the percentage decline in nominal condo prices that would be required to bring our three valuation measures back to the 1995-1999 average, assuming no changes in other inputs such as rents, incomes, and mortgage rates.

Price/Rent Price/Income Affordability

Required Decline* -44% -37% -35%

*In order to return to 1995-1999 valuation levels.

Source: Our calculations. See text for additional explanations.

Our indicators suggest that New York condo prices would need to fall by between 35% and 44% to return to a neutral valuation level, depending on the valuation measure we choose. Under the (admittedly unrealistic) assumption that prices decline by the same percentage in each market segment, this type of drop would imply that a 1-bedroom condo whose price currently averages roughly $800,000 would decline to $480,000; a 2-bedroom condo would decline from $1.7 million to $1 million; and a 3-bedroom condo would decline from $3 million to $1.8 million. (All these figures are approximate and are loosely based on the brokerage firms’ fourth-quarter reports.)

Since economies typically grow over time, one would normally hesitate to predict that “mean reversion” in a price/income or price/rent ratio should occur entirely via a decline in prices rather than an increase in incomes or rents. In our case, however, the assumption of flat nominal incomes and rents does not seem excessively pessimistic. In fact, it is quite possible that nominal Manhattan incomes will decline for a while. Such a nominal decline would be extremely unusual at the national level but did occur in Manhattan following the 2001 recession, which was much less severe than the downturn we are currently seeing.

In fact, it is instructive to consider the potential implications of a return of relative Manhattan incomes toward the national norm prevailing before the Wall Street boom of the past two decades, either because of pay cuts in the financial industry or because of a possible out-migration of affluent individuals. From 1969 to 1986, Manhattan per-capita income averaged 2 times the national average, with no clear trend. Over the next two decades, however, it grew to 3 times the national average. If incomes fell back to the pre-1986 level of 2 times the national average—and if national per capita income remained unchanged—prices would need to fall as much as 58% to return to the 1995-1999 price/income ratio. (The 58% drop is calculated as the 37% drop shown in the table assuming constant income, plus the 33% drop in per capita incomes, minus a term for negative compounding.)

So is there any hope for the New York apartment market? Apart from a dramatic turnaround in the city’s economic fortunes, the most plausible story is a drop in jumbo mortgage rates. So far, jumbo rates have not benefited much from the recent decline in mortgage rates, but this could change if the Fed (presumably in conjunction with the Treasury) decided in the course of 2009 to broaden its support from the conforming market to the private-label mortgage market. To make an extreme assumption, if the jumbo mortgage rate fell from the current 7% to 5%, this would reduce the “required” price decline from 35% to 19%. Of course, this assumes that affordability is the only measure that matters for home prices and there is no role for the “raw” price/rent or price/income ratio, and that Manhattan incomes stay at 3 times the national average.

In addition, it could be that societal and demographic changes will keep New York apartment valuations above the levels that prevailed in earlier periods. For example, one might argue that the memory of high crime rates was still fresh enough in 1995-1999 to make this period an excessively pessimistic benchmark. If crime stays low during the current economic downturn, perhaps Manhattan real estate will retain its higher valuation in coming years. Alternatively, one might argue that the aging of the baby boomers will continue to support the New York market as “empty nesters” want to live closer to the city’s attractions. These types of arguments are difficult to quantify and are often heard just prior to the start of a real estate downturn, but they do underscore that our analysis of the observable data on prices, rents, incomes, and interest rates only provides a very partial view of the New York apartment market.

Source: Goldman Sachs

Tags: , , , , , , , , ,

Get Weekly Insights and Research

Housing Notes by Jonathan Miller

Receive Jonathan Miller's 'Housing Notes' and get regular market insights, the market report series for Douglas Elliman Real Estate as well as interviews, columns, blog posts and other content.

Follow Jonathan on Twitter

#Housing analyst, #realestate, #appraiser, podcaster/blogger, non-economist, Miller Samuel CEO, family man, maker of snow and lobster fisherman (order varies)
NYC CT Hamptons DC Miami LA Aspen
millersamuel.com/housing-notes
Joined October 2007