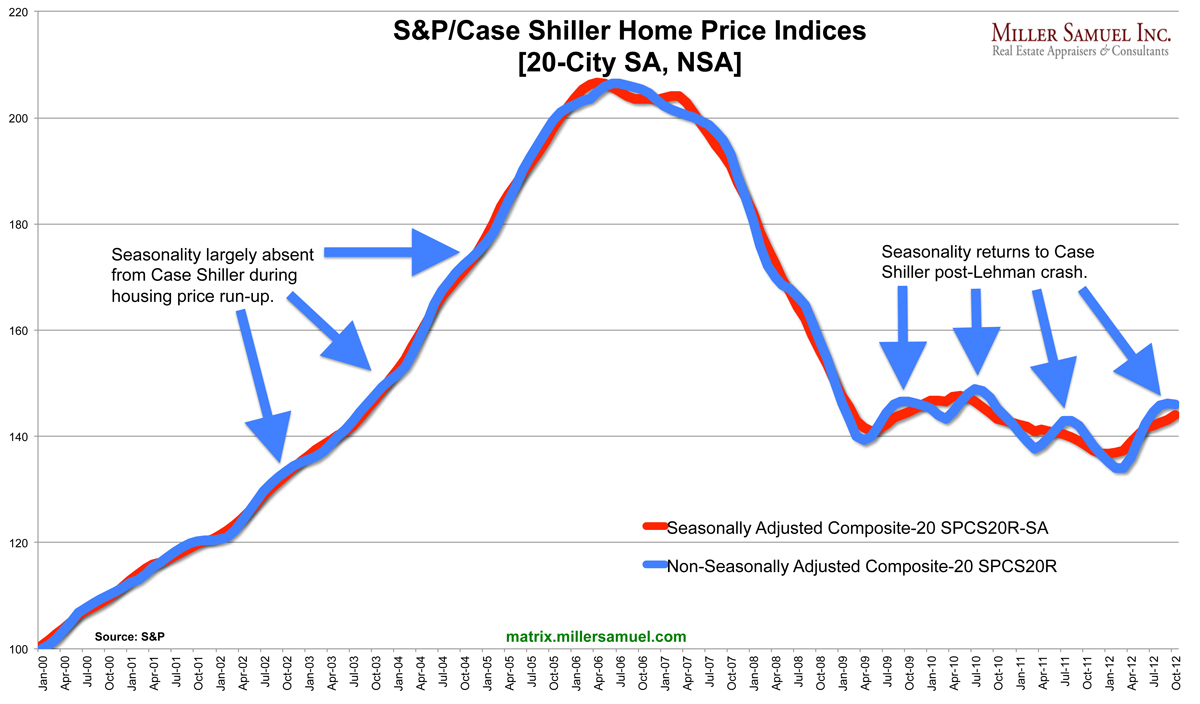
Well the frequently maligned but most influential housing metric was published yesterday, the S&P/Case Shiller Home Price Indices and the 20 City index rose 4.3% year-over-year. The only two “regions” to see declines were Chicago and New York.
Baseball Correlation? Chicago and New York are the only 2 cities who also have 2 Major League Baseball teams. No, Los Angeles doesn’t have two MLB teams…the Los Angeles Angels of Anaheim are clearly trying to have it both ways.
But I digress…
With all the talk about “recovery” (aka happy housing news) these days it just dawned on me that since 2000, the Case Shiller HPI only began to show significant seasonality since mid-2009. No one has really talked about this and I’m not sure what it means, but it just jumped out at me today.
Pre-peak housing prices fueled by falling lending standards and the seasons were largely crushed by the locomotive known as the housing boom. Therefore the seasonally adjusted and non-seasonally adjusted price trends were virtually the same during the market’s ascent. I distinctly remember real estate agents commenting during this period that the seasons were going away and housing market patterns were changing permanently.
Post-peak housing prices After the plunge subsided in mid-2009, the market began to ebb and flow with peaks in the spring/summer and troughs in the fall/winter.
Note to self
The next time CSI prices begins to smooth into nothingness, perhaps it’s a housing boom, baby.


