Matrix Blog

Posts Tagged ‘Lehman’

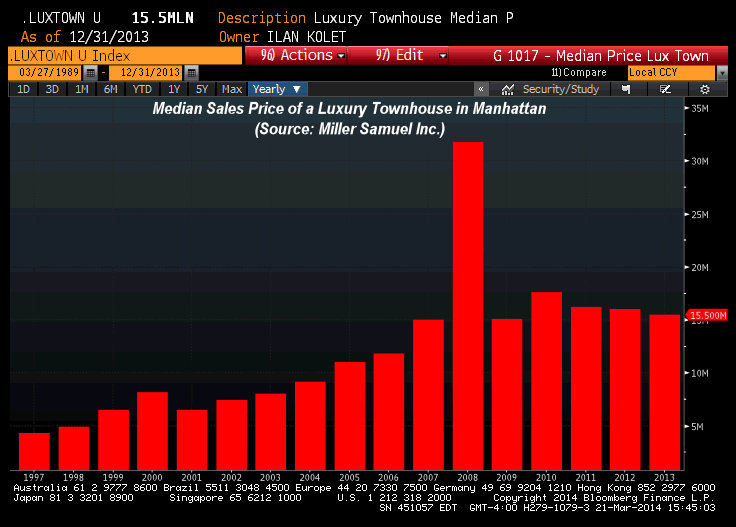
Spot the Manhattan Luxury Townhouse Lehman Effect?

March 23, 2014 | 10:03 am | |

bb3-14luxTH

Ilan Kolet from Bloomberg News whipped up this chart and shared on twitter using our Manhattan luxury townhouse data.

Gotta love the visual – the 2008 Lehman collapse exemplified in the high end townhouse market in the home of Wall Street.

Tags: ,


[Long List of Records] 3Q 2013 Manhattan Sales Report

October 4, 2013 | 10:32 am | | Reports |

We published our report on Manhattan market sales for 3Q 2013 this week.   I’ve been writing this series for Douglas Elliman since 1994.

My Take

  • Inventory continues to challenge the market, falling to the lowest level since we began tracking it more than 13 years ago.
  • Sales surged as fence-sitters rushed in to buy before mortgage rates rose any further, causing the largest market share of co-op sales (62%) in 9-years.
  • Sales rose to second highest level in 24 years, the highest since 2007.
  • While overall median sales price slipped 2%, it was only due to a shift in mix to smaller sales. Both co-op and condo median sales prices increased year-over-year.
  • The 1-bedroom market share of sales reached a 15-year high.
  • The combination of surging sales and falling inventory resulted in fastest absorption rate (market pace) on record at 3.6 months.
  • The market share of new development closings fell to decade low of 6.2% as finished product continues to be scarce, but the rise in new development activity should reverse this trend in 2014.

Here’s an excerpt from the report:

The third quarter was a period of records and near records in the Manhattan residential apartment market. There were 3,837 sales in the third quarter, 30% higher than the prior year quarter and the second highest total in more than 24 years. The sharp gains in the number of sales likely reflects a release of pent-up demand accumulated over the past several years combined with the concern over rising mortgage rates. The highest level of sales reached was 3,939 in the second quarter of 2007, just over a year before the Lehman tipping point and onset of the global credit crunch in late 2008. Listing inventory also reached a new record by falling 21.9% to 4,567, the lowest level reached since this metric was tracked in 2000…


The charts will be updated shortly but the data tables are already updated to include 3Q 2013.

Here is some of the press coverage for the report.


The Elliman Report: 3Q 2013 Manhattan Sales [Miller Samuel]
The Elliman Report: 3Q 2013 Manhattan Sales [Douglas Elliman]

Tags: ,


The Low Appraisal “Hassle” is a Symptom of a Broken Mortgage Process

September 16, 2013 | 3:58 pm | |

Last week we saw a chorus of “appraisers are killing our deals” stories in some major publications:

  • When Appraisal Hassles Tank a Home Sale [WSJ]
  • When Appraisals Come in Low [NYT]
  • Appraisals Scuttle Home Sales Where Prices Rise Fast[IBD]

I’ve long been a critic of my own industry. Like any industry there are terrific appraisers, average appraisers and form-fillers. Post-Lehman there are a LOT more of the latter.

The scenario that prompted these articles and others like them occurs when a sale is properly vetted in the market place and an appraiser enters the transaction and subsequently appraises the property below the sales price. It supposedly is happening in greater frequency now, hence the rise in complaints.

My focus of criticism has largely been centered on appraisal management companies (AMC), who have tried to convert our industry to a commodity like a flood certification or title search rather than a professional service. AMCs serve as a middleman between the bank and an appraiser and they have thrived as a result of financial reform. Most only require an appraiser to be licensed, agree to work for 50 cents on the dollar and turn work around in one fifth the time required for reasonable due diligence. Appraisal quality of bank appraisals has plummeted in this credit crunch era and as a result has prompted growing outrage from all parties in a transaction.

Of course, the market value of the property may not be worth it. But the real estate industry doesn’t trust the appraiser anymore so we point them finger at them automatically.

Yes, it’s a hassle. So let’s decide what the problem really is and fix it.

A long time appraisal colleague and friend of mine once told me before the housing bubble burst:

“Jonathan, you as the appraiser are the last one to walk into the sales transaction. Everyone involved in the sale is smarter than you. The selling agent (paid a commission), the buyers agent (paid a commission), the buyer (emotionally bias), the seller (emotionally bias), the selling attorney (paid a transaction fee), the buyer’s attorney (paid a transaction fee) and the loan officer or mortgage broker (paid a transaction fee) all know more than you do.”

The appraiser in this post-financial reform world doesn’t have a vested interest in the transaction like they did during the housing boom – some could argue they are too detached. The vested interest I speak of occurred during the bubble when mortgage brokers and most banks generally used appraisers who always “made the number.” Incidentally, many of those types of appraisal firms are out of business now.

Let’s clear something up. The interaction an appraiser has with a lender when appraising below the purchase price now is not that much different than during the boom. When an appraiser kills a sale, the appraiser is generally hit with a laundry list of data to review and comments to respond to questions from the AMC, bank or mortgage broker who use the “guilty until proven innocent” approach even though the bank likely won’t rescind the appraisal. The additional time spent by the appraiser is a significant motivator to push the value higher to avoid the hassle if the appraiser happens to be “morally flexible.”

And by the way, sales price does not equal market value.

The sources for most of these low appraisal stories I began this post with come from biased parties so it makes it clear that low appraisals are the problem. In reality, the low appraisal issue is merely the symptom of a broken mortgage lending process. The problem is real and becomes more apparent when a market changes rapidly as it is now. Decimate the quality of valuation experts and you generate results that are less consistent with actual market conditions and therefore more sales are killed than usual. Amazingly the US mortgage lending infrastructure today does not emphasize “local market knowledge” in the appraisers they hire no matter what corporate line you are being fed. This is even more amazing when you consider that most national lenders have only a handful of appraisal staff and tens of thousands of appraisals ordered ever month.

The cynical side of me thinks that rise in low value complaints reflects an over-heated housing market – that the parties are getting swept up in the froth and the neutral appraiser is the voice of reason. The experienced me realizes that financial reform has brought new appraisers into the profession that have no business being here (and pushed many of the good ones out) and that the rise in the frequency of low appraisals has only seen the light of day because housing markets are currently changing rapidly.

Here’s my problem with the mortgage lending industry today as it relates to appraisers:
• Most of the people running bank mortgage functions are the same as during the bubble, only see appraisal as a cost, not as eyes and ears.
• Banks love the current state of appraisals because the values are biased low (banks are risk averse) and they fully control the appraiser.
• Appraisal Management Companies themselves have no real oversight (some are very good, most are terrible).
• Banks no longer emphasize local market knowledge in their appraisers or they pay lip service to it.
• Short term cost savings trumps emphasis on quality and reliability.

Every now and then (like now) everyone seems surprised and feels hassled when appraisal values don’t match market conditions. However the bank appraisal process has largely morphed into an army of robots on an assembly line – either because we are unaware of the problem until it affects us directly or we just want it that way.

Let’s focus on fixing the mortgage lending process or stop complaining about your appraisal.

Tags: , , , ,


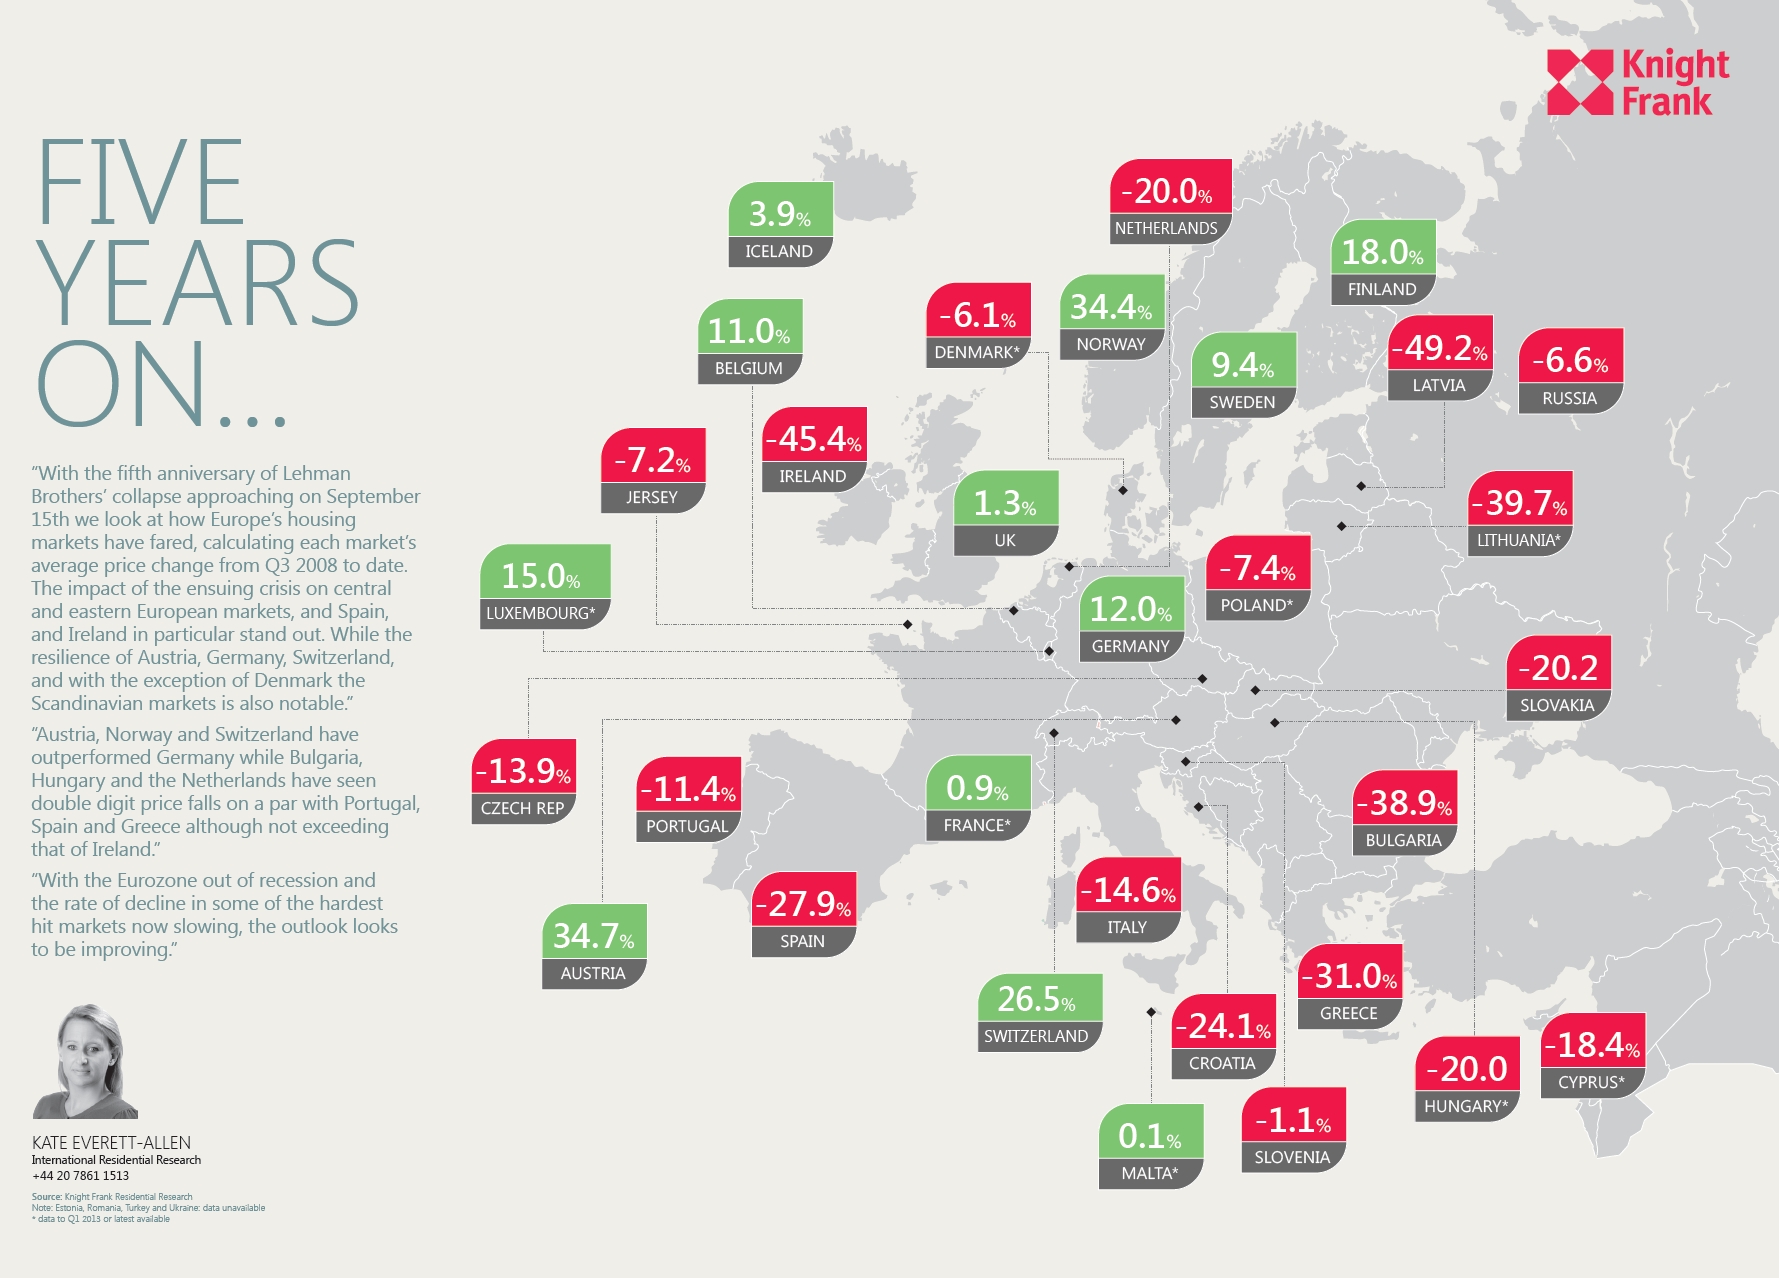
Impact of Lehman Collapse on Housing Prices in Europe

September 13, 2013 | 3:52 pm | |


Source: Knight Frank [click chart to expand]

This chart could also be called “Why International Demand for US housing is Elevated” since many European investors are looking for safe places to park their money.

Tags: ,


[Three Cents Worth #245 NY] Manhattan Puts Best (Square) Foot Forward

September 3, 2013 | 5:22 pm | | Charts |

It’s time to share my Three Cents Worth (3CW) on Curbed NY, at the intersection of neighborhood and real estate in the capital of the world…and I’m here to take measurements.

Check out my 3CW column on @CurbedNY:

After a long weekend and a suggestion from a friend, I thought I’d take a different look at how we got here by measuring the total square footage sold as a market metric. It reveals a somewhat different post-Lehman perspective than would be derived from price. The blue columns represent the total square footage closed during each period that were available immediately following the period. The pink horizontal lines represent average square footage sold per period and were described with a key market attribute during that period…

[click to expand chart]


My latest Three Cents Worth column on Curbed: Manhattan Puts Best (Square) Foot Forward [Curbed]

Three Cents Worth Archive Curbed NY
Three Cents Worth Archive Curbed DC
Three Cents Worth Archive Curbed Miami
Three Cents Worth Archive Curbed Hamptons

Tags: , , ,


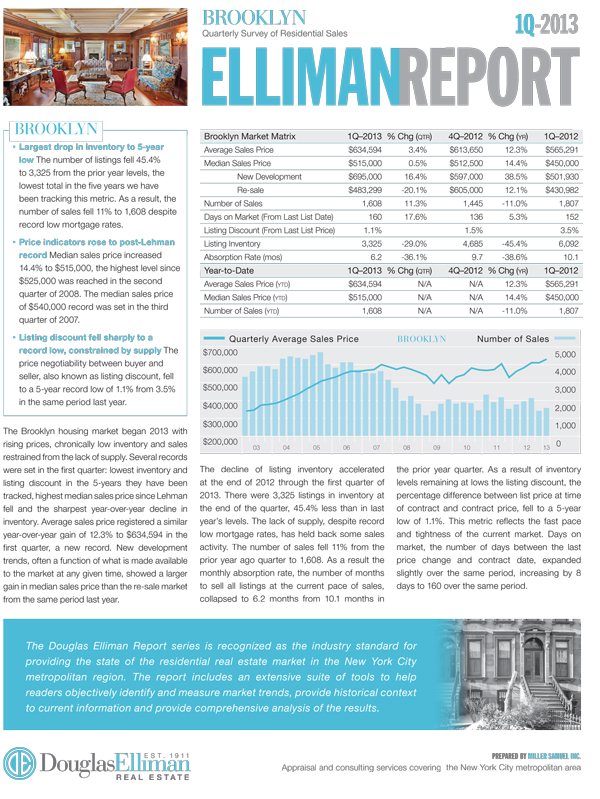
[Tight] 1Q 2013 Brooklyn Report

April 11, 2013 | 2:29 pm | | Reports |

We recently published our report on the Brooklyn sales market. This is part of an evolving market report series I’ve been writing for Douglas Elliman since 1994.

Key Points

  • Lowest inventory levels recorded in 5 years.
  • Sales below year ago levels as lack of inventory impairing sales volume.
  • Prices are up as supply limitations keep pressure on market.
  • More bidding wars.

Here’s an excerpt from the report:

…The Brooklyn housing market began 2013 with rising prices, chronically low inventory and sales restrained from the lack of supply. Several records were set in the first quarter: lowest inventory and listing discount in the 5-years they have been tracked, highest median sales price since Lehman fell and the sharpest year-over-year decline in inventory. Average sales price registered a similar year-over-year gain of 12.3% to $634,594 in the first quarter, a new record. New development trends, often a function of what is made available to the market at any given time, showed a larger gain in median sales price than the re-sale market from the same period last year…

You can build your own custom data tables on the market – now updated with 1Q 13 data. Charts updated with 1Q13 data will be online shortly.


The Elliman Report: 1Q 2013 Brooklyn Sales [Miller Samuel]
The Elliman Report: 1Q 2013 Brooklyn Sales [Douglas Elliman]
Aggregated Custom Market Data Tables [Miller Samuel]

Tags:


Tight Credit Is Causing Housing Prices to Rise

February 6, 2013 | 9:18 am | | Charts |


[click to expand]

I’ll repeat that: Tight Credit Is Causing Housing Prices to Rise.

Yes I know. I’ll explain.

This week the Federal Reserve released it’s January 2013 Senior Loan Officer Opinion Survey on Bank Lending Practices and it continued to show little movement in mortgage underwriting standards but demand was up. The increase in demand has not softened mortgage lending standards. In fact, mortgage standards have remained essentially unchanged since Lehman collapsed in 2008.

On the household side, domestic banks reported that standards for both prime and nontraditional mortgages were essentially unchanged over the past three months. Respondents indicated that demand for prime residential mortgages increased, on net, while demand for nontraditional residential mortgages was unchanged.

Tight lending standards has prevented many sellers from listing their homes because they don’t qualify for the trade up, holding supply off the market. The shortage is manifesting itself by also keeping people unaffected by tight credit from listing until they find a home they wish to purchase. Record low mortgage rates keep the demand pressure on as affordability is at record highs. Rising prices are not really based on anything fundamental like employment and a robust economy.

Tight credit + record low mortgage rates => reduced supply + steady demand => rising prices.

Like I said before…

Tight Credit Is Causing Housing Prices to Rise.

I’ll repeat that….

Tight Credit Is Causing Housing Prices to Rise.


January 2013 Senior Loan Officer Opinion Survey on Bank Lending Practices [Federal Reserve]
Falling Inventory Has Created a Housing “Pre-Covery,” not “Recovery” [Miller Samuel Matrix]

Tags:


[60 Pages of Data Bliss] 2003-2012 Manhattan Decade Report

January 31, 2013 | 7:06 am | | Reports |

We published our Manhattan Decade report, a ten year moving window data compendium of the market from 2003-2012. It’s my favorite report just for the sheer volume of information that doesn’t exist anywhere else. I long ago dubbed it “The Phone Book.” This is part of an evolving market report series I’ve been writing for Douglas Elliman since 1994.

Key Points

MANHATTAN DECADE (Co-ops/Condos) 2003-2012

  • Sales increased year-over-year for the 3rd consecutive year to second highest level in decade (after 2007 peak).
  • Housing prices remain 11-13% below the 2008 peak, housing sales are 21.8% below 2007 peak.
  • Housing prices were mixed but showed stability for 4th consecutive year after the 2008 credit crunch and correction.
  • Listing inventory fell sharply to lowest level in 12 years.
  • Credit remains tight as economy slowly improves.
  • Inventory falling – low to negative equity, no urgency to list.
  • Sales rising as record low mortgage rates create demand.


Here’s an excerpt from the report:

…For the fourth time in 5 years, the number of sales exceeded the 10,000 threshold. The number of sales increased 3.4% to 10,508 from the prior year to the second highest level of the decade despite declining inventory and historically tight credit conditions. For the past three years, sales activity has remained remarkably consistent as the market settled into a stabilized period following the onset of the credit crunch marked by the bankruptcy of Lehman Brothers in the fall of 2008. The peak year for the number of sales in the decade occurred in 2007, reaching 13,430. The 2012 total was 21.8% below the decade peak. However the 2007 level was the top of the housing/credit boom, considered an anomaly rather than a normal period of housing sales…

Later today we’ll have additional information available on the market so you can build your own custom data tables and browse our chart library.


The Elliman Report: 2003-2012 Manhattan Decade Report [Miller Samuel]
The Elliman Report: 2003-2012 Manhattan Decade Report [Douglas Elliman]
Market Chart Library [Miller Samuel]
Aggregated Custom Market Data Tables [Miller Samuel]

Tags: ,


[Three Cents Worth NY #218] Manhattan’s Thanksgiving Listing Spread

November 20, 2012 | 4:39 pm | | Charts |

It’s time to share my Three Cents Worth (3CW) on Curbed NY, at the intersection of neighborhood and real estate in the capital of the world…and I’m here to take measurements.

Read this week’s 3CW column on @CurbedNY:

I started off trending the month-over-month percentage change in doorman (green line) and non-doorman (orange line) listings and they showed a very similar pattern [yawn] so I left the lines alone and looked at the larger pattern of peaks and troughs in listing activity at the end of the year. I’ve been tracking listing trends for more than a decade on a quarterly basis but only on a monthly basis since 2008 so I can’t go back pre-Lehman. I am especially interested in each fall market’s second sales hump (spring is hump number one) of the annual two-hump sales camel that occurs before the Thanksgiving holiday…


[click to expand chart]


Today’s Post: Manhattan’s Thanksgiving Listing Spread [Curbed]
Three Cents Worth Archive Curbed NY
Three Cents Worth Archive Curbed DC
Three Cents Worth Archive Curbed Miami

Tags: , ,


Luxury Real Estate as the New Global Currency

November 18, 2012 | 5:46 pm | | Articles |


[click to read article]

Over the summer Camilla Papale, Douglas Elliman’s CMO asked me if I would present something about the state of luxury real estate for their Elliman Magazine (and iPad app!). The finished result contained 3 parts:

  • I wrote a brief piece about the influx of international demand as high end consumers were seeking a safe haven from the world’s economic problems. I called the piece: “LUXURY REAL ESTATE AS THE WORLD’S NEW CURRENCY” This post’s title was my working title which I also liked.
  • Plus I did a little research on housing prices across the globe using Knight Frank’s resources and
  • I moderated a discussion on the subject with Dottie Herman, President & CEO of Douglas Elliman, Patrick Dring, Head of International Residential at Knight Frank, and Liam Bailey, Head of Residential Research at Knight Frank. They all provided great insights to the subject.

Here’s the full piece in Elliman Magazine . I’ve inserted a portion of the presentation below in 2 parts:

LUXURY REAL ESTATE AS THE WORLD’S NEW CURRENCY

Since the beginning of the global credit crunch in 2008, luxury real estate has morphed into a new world currency that provides investors with both a tangible asset and a cachet that cannot be found within the financial markets. It’s as if these emboldened investors zoomed out of their local Google Earth view to discover the wider global perspective on luxury real estate.

HOW DID WE GET HERE? The US dollar has weakened in the years following the collapse of Lehman Brothers in the onset of the global credit crisis. The S&P downgrade of US debt in August 2011 from its benchmark AAA rating brought a flood of investors into US financial securities. That meant that our currency allowed us to buy less abroad, and the strength of other currencies provided international buyers with large discounts when purchasing property in US dollars. But it went further than that.

THE RISE OF LUXURY REAL ESTATE AS A “SAFE HAVEN.” The volatility of global financial markets and the resulting political fallout shook investor confidence, which in turn spurred a rise in foreign buyers seeking a safe haven to protect their assets. A wave of international buyers from Europe, South America, and Asia entered the US housing market, helping set record prices and revive luxury markets including New York, The Hamptons, and Miami.

SUPPLY-DRIVEN DEMAND. The luxury real estate market has become defined by the supply of available properties. While demand has remained constant and elevated, inventory has become a critical variable, particularly at the very top of the market, where surging international demand for one-of-a-kind properties has surpassed the limited supply. The resultant record-breaking sales of “trophy” properties have enticed more owners of luxury homes to make them available for sale.

THE RISE OF THE “TROPHY PROPERTY.” The trophy property has become a new market category that does not follow the rules and dynamics of the overall marketplace. One stratospheric price record is being set after another, and it is not only the list prices that are defining these record sales; the rarity of location, expanse of the views, quality of amenities, and the sheer size of these unique homes have all played an important part in attracting the interest of foreign buyers.

WHERE DO WE GO FROM HERE? Driven by the global credit crunch and political instability, the two factors that are expected to remain unchanged for the next several years, the US luxury housing market is expected to remain a “safe haven” for foreign investors for quite some time.

A CONVERSATION ABOUT THE COMMERCE OF GLOBAL LUXURY REAL ESTATE

I sat down with Dottie Herman and our friends across the pond, Patrick Dring, Head of International Residential, and Liam Bailey, Head of Residential Research at Knight Frank, to chat about the state of real estate in the prime markets across the globe and the rise of a foreign investment phenomenon.

JONATHAN MILLER: Douglas Elliman has a broad coverage area that includes some of the most affluent housing markets in the US. Are you seeing any short-term issues that may influence luxury investor decisions over the coming year?

DOTTIE HERMAN: At the end of this year, we may see a repeat of the consumer behavior we saw at the end of 2010 when US capital gains tax rates were expected to rise. Ultimately, the rates did not increase, but many consumers in the luxury market took preventative action before the potential tax increase and raced to close their sales by the end of 2010. Despite the ups and downs in the quarters that followed, the luxury housing market was not adversely impacted in the long-term.

JM: Paddy, according to Knight Frank’s Global Briefing blog, housing prices in central London are up sharply, but the pace of growth appears to be slowing, perhaps because of the new stamp duty (a tax on properties priced at £2M–the equivalent of $3.15M–or more). What does this mean for the luxury market?

PADDY DRING: In short, the £5M ($7.85M) market is up year-on-year. The new stamp duty on property sales above £2M seems to be having an impact only on the band just above the new £2M threshold. Foreign demand remains high and, notably, we have sold to over 62 different nationalities within the last 12 months. They are less affected by the changes in stamp duty, since the rates in London are still in line with many other European countries.

JM: Dottie, your firm has sold a large number of luxury properties this year, despite a lukewarm economy and tight credit conditions. Record sales and listing prices are becoming nearly commonplace and a significant portion of this demand for luxury real estate is coming from abroad. Do you see this developing into a long-term trend?

DH: It’s certainly been a year of records and I do think we are embarking on a period where luxury real estate has the potential to outperform the rest of the housing market. Several of the markets that we cover, Manhattan and Miami in particular, have been firmly established as highly sought-after international destinations. As much as we fret about how slowly our economy is recovering, the US has proven itself as a “safe haven” for many international investors who are concerned about the turmoil of the world economy and political stability. Luxury investors from much of Europe, Russia, Asia and South America have been buying here at the highest pace we have seen since the credit crunch began.

JM: Liam, the US is seeing a higher-than-normal influx of real estate demand from foreign investors who seem to be focusing on the upper end of the housing market. These investors are well represented from Europe, Asia and South America. Are you seeing the same phenomenon when it comes to luxury properties in the UK? What are the primary regions where this demand is coming from?

LIAM BAILEY: The focus of demand continues on London and its easily accessible suburbs. London is facing even higher global demand than New York, with the top end strongly led by Russia, Europe, Canada, and the Middle East, and demand in the new development investment market very much led by Asia.

JM: In the US, access to financing is a key challenge to domestic purchasers, including luxury investors. What are some of the key challenges facing your clients who are looking to purchase real estate outside of their own countries?

PD & LB: Financing remains a consideration for many, although mortgages are more available in many of the markets than people are led to believe. Of course, the property needs to be quality and in a core location and have a more conservative loan-to-value ratio, however, many of our clients purchase in cash, so they are more affected by market sentiment and, of course, liquidity if they need to sell unexpectedly in the future. Factors affecting market sentiment include the usual considerations, such as exchange rate, a stable political base, as well as a sound legal system that guarantees clarity of title and tax considerations. The latter of course is affecting not only the cost of acquisition (stamp duty), but also, in some countries, the cost of holding (wealth tax) and ultimately selling (capital gains tax). Access, infrastructure, and climate (if lifestyle-driven) all remain key, as do low crime rates as people become more aware of their privacy and personal safety.

JM: Since the beginning of the credit crunch, you’ve constantly stressed to your clients that the terms of a sale are just as important as the price of a sale, given the challenges of obtaining financing. How do international buyers fi t into this new world defined by tough lending standards?

DH: Despite mortgage lending in the US remaining tight, luxury markets in the areas we cover have improved quickly. I can only imagine how much stronger the US housing market would be if we saw credit ease to historically normal levels. International buyers tend to pay cash or obtain financing from their native countries, which has given them an advantage over many domestic purchasers. Combine the ability to pay in cash with both the weakness of the US dollar against many of their native currencies and a volatile global economy, and you can begin to understand why we are seeing a strong presence of international buyers in our markets. Like our friends at Knight Frank, these luxury investors are interested in our proven core markets that already have a large concentration of luxury properties. Overall, we continue to be excited about our market’s expanding presence in the global luxury housing market—there are many opportunities out there for this new international investor to explore.


Luxury Real Estate as the World’s New Currency [Miller Samuel (pdf)]
Luxury Real Estate as the World’s New Currency [Douglas Elliman]
Elliman iPad App [iTunes]

Tags: , , , , , , , ,


Hamptons High End Market in 4Q: Hedging Against Possible Rise in Capital Gains?

November 6, 2012 | 8:00 am | | Charts |


[click to expand]

This chart is an enlarged version of a chart that appeared within our just released Elliman Report: Hamptons/North Fork Sales. I’ve expanded it because I was struck by the randomness of activity in the $5M and up sector of the market (blue columns). Clearly the pattern follows the market stall after Lehman’s ’08 bankruptcy for a few quarters but otherwise, the sales don’t seem to follow a pattern, seasonal or otherwise.

The two quarters with a spike of 38 sales, 4Q 2010 and 2Q 2012 could be explained perhaps but the reasons aren’t that compelling in comparison to how much they stand out.

4Q 2010 The looming Bush tax cut expiration at the end of 2010 caused many sellers to bring high end properties and they were quickly absorbed.

2Q 2012 The prior quarter seemed to be an elevated spring surge.

4Q 2012 Will the 4th quarter see the same phenomenon as 4Q 2010? The capital gains implications are the same – will the Bush tax cuts be extended? – I’m not sure but our appraisal practice is inundated with valuation assignments of high end properties hedging against the potential end of year rise in capital gains tax.

The aftermath of Hurricane Sandy and the imminent Snor’eastercane may change the 4Q 2012 results.

Tags: ,


[New, Improved, Expanded] 9-2012 Manhattan/Brooklyn Rental Report

October 20, 2012 | 3:00 pm | | Reports |

We created and published a new report on the Manhattan rental market for 9-2012.  This is part of an evolving market report series I’ve been writing for Douglas Elliman since 1994.

New Features

-Includes both Manhattan and Brooklyn (North/Northwest)
-Monthly release.
-Vacancy Rates (Manhattan only)
-Breakdown of the four Manhattan regions by number of bedrooms
-We’ve added a “Super-Luxury” rental category for the top 5% of Manhattan.

-Both reports are a work in progress – we’ll continue to lavish attention on new features over the coming months.

Key Points

-Rental market remains tight as credit keeps some out of purchase market and supply isn’t elastic enough to meet demand.
-Strong employment growth is fueling rental market, which responds more quickly to job gains.

MANHATTAN

  • Prices continued to rise, up 10.2% based on face rent and 8% based on net effective rent year-over-year.
  • Only 2% of listings had a landlord concession, down from 8.6% last year.
  • Vacancy rate fell to 1.85% from 2.62% in year ago quarter, consistent with rising rents. Uptown with lowest rate, West Side with highest rate.
  • New rentals up 54.5% from the prior year suggesting market resistance at time of lease renewal.
  • Listing inventory slipped 2.6% from year ago levels.
  • Doorman prices up as non-doorman prices remained stable.

BROOKLYN
[North, Northwest Regions]

  • Prices slipped 2.1% below year ago levels but remain elevated.
  • New rentals up 6.5% over last year’s levels.
  • Days on market at third fast monthly rate in nearly 5 years.
  • 1-Bedrooms showed largest median sales price gain at 10.5% YOY.

Here’s an excerpt from the report:

…Two significant drivers of rental demand over the past year have been the tight lending conditions and the improving local economy, namely employment levels. Perhaps the most consequential factor to date has been the tight mortgage underwriting standards. Banks remain risk-adverse, and lending standards have yet to ease since the fall of Lehman Brothers. This has held many would-be buyers in the rental market, especially with mortgage rates continuing to fall and reaching record-low levels throughout most of 2012. However, falling mortgage rates have made lenders even more adverse to risk. This lower tenant mobility has tightened the conditions of the rental market, laying the pressure on rents…

You can build your own custom data tables on the Manhattan rental market using quarterly data – our new monthly format will be available online shortly and will be phasing in monthly charts to our rental chart gallery soon.


The Elliman Report: 9-2012 Manhattan Rentals [Miller Samuel]
The Elliman Report: 9-2012 Manhattan Rentals [Prudential Douglas Elliman]

Tags:

Get Weekly Insights and Research

Receive Jonathan Miller's 'Housing Notes' and get regular market insights, the market report series for Douglas Elliman Real Estate as well as interviews, columns, blog posts and other content.

Follow Jonathan on Twitter

#Housing analyst, #realestate, #appraiser, podcaster/blogger, non-economist, Miller Samuel CEO, family man, maker of snow and lobster fisherman (order varies)
NYC CT Hamptons DC Miami LA Aspen
millersamuel.com/housing-notes
Joined October 2007