[Video] Providing the right context for Manhattan and Miami housing markets

April 2, 2016 | 11:48 am | | Favorites |

I really enjoyed my interview over at Yahoo! Finance this week discussing the release of the Elliman Report: Manhattan Sales 1Q 2016. Love their longer interview format.

Note the “two comma” reference taken from the HBO show Silicon Valley:

Miller also rejects the thesis that Manhattan’s two-comma real estate prices were being fueled solely by foreign money and are now jeopardized by global uncertainty and a stronger dollar versus emerging market currencies.

Additional insights on the report shared on the recent edition of Housing Notes. Sign up here.

Tags: ,


Better Than a Sex Scandal: Brooklyn Housing was #3 on the Bloomberg Terminals

October 8, 2015 | 9:53 pm | | Favorites |

BBterminalsbrooklyn10-8-15-600

The Bloomberg News story “Brooklyn Homes Sell at Record Pace in Outer-Borough Surge” was the 3rd most read story on the Bloomberg terminals world wide this afternoon.

Here’s the Douglas Elliman report.

The Brooklyn housing story in fact earned more reads than the Stanford Business School sex scandal, the Bill Gross $200M lawsuit against PIMCO and Deutsche Bank’s $7B loss this quarter.

After all, Brooklyn is now a global brand.

Tags: , , , ,


Brooklyn, Queens Set Records, NYC rents jump, Westchester, Putnam and Dutchess Get Busy

October 8, 2015 | 9:05 pm | | Reports |

wsjbrooklyn3q15-600

We published a slew of research today for Douglas Elliman Real Estate:

Manhattan, Brooklyn & Queens Rentals

Manhattan Rentals – Median rental price increased year-over-year for the 18th consecutive month – Median rental price was third highest on record – Brisk employment growth and strong economic conditions kept upward pressure on rents – Mortgage lending conditions remained tight tipping would-be first-time buyers back into rental market – Strength at lower end of market remained as non-doorman rents rose faster than doorman rents – Luxury median rental price slipped, showing weakest conditions of all price segments – Inventory slipped and marketing time remained low, despite rise in vacancy rate

Brooklyn Rentals – Median rental price set a new record for third consecutive month – Median rental price exceeded the $3,000 threshold for first time – Landlord concessions remained at nominal level as inventory slipped – Rental price indicators moved higher across all size categories – Listing inventory as well as negotiability between landlords/tenants fell – Median Brooklyn rent was $288 less than Manhattan

Queens Rentals – Price indicators showed mixed results, suggesting general stability overall – Studios showed strong price growth as 1-bedrooms and 2-bedrooms were flat – New development market share comprised 30.2% of new rentals – Luxury market median price gain was modest, but exceeded the overall market – Median Queens rent was $362 less than Brooklyn and $650 less than Manhattan

Brooklyn Sales – Brooklyn median and average sales price set a new record – Brooklyn remains the only New York City borough with a median sales price above the pre-financial crisis high – Condo, co-op and 1-3 family properties set new median sales price record – Luxury housing prices followed overall market trend – Sales expanded as listing inventory declined, resulting in brisk market pace – Fastest marketing time in 8 years

Queens Sales – Queens median and average sales price set a new record – Condo median sales price set a record for second consecutive quarter – Co-op price indicators set new record – 1-3 Family price indicators set new record – Luxury price indicators set new record – Inventory declined as sales surged – Marketing time fell as negotiability expanded

Westchester County Sales (expanded) – Record number of sales for the quarter, based in historical back to 1981 – Fastest marketing time and least negotiability in the 5.5 years this metric has been measured – Listing inventory for all property types slipped from year ago levels – Absorption rate was fastest market pace in 15 years – Single family and condo median sales price indicated stability – Single family market share declined even though sales increased – Luxury price indicators slipped, out performed by overall market

Putnam/Dutchess County Sales (new)

Putnam County – Price trend indicators increased on a year over year basis – Listing inventory slipped as the number of sales surged – Based on absorption, the market pace was 17.2% faster than the year ago quarter – Marketing time and listing discount expanded despite faster market pace

Dutchess County – Price indicators suggested general stability – Single family prices edged higher as condo prices declined – The pace of the market slowed as sales declined and inventory expanded

Tags: , , ,


Manhattan Report 3Q15 Just Published

October 1, 2015 | 8:06 am | | Reports |

Manhattan_3Q_2015

The Elliman Report: Manhattan Sales 3Q-2015 we author on behalf of Douglas Elliman Real Estate was published today. It’s part of our report series that has been expanding since 1994.

Here’s a brief summary but I’ll provide a more thorough explanation of the results in tomorrow’s Housing Notes (don’t just stare blankly at the screen, please sign up for my free weekly newsletter here.)

  • Median sales price was second highest on record, highest since 2008
  • PPSF set 26 year record of $1,497 per sqft
  • Year-over-year sales increased for first time in a year as pent-up demand from financial crisis has been fully absorbed
  • Listing inventory growth stalled in 2015 after bottoming at the end of 2013
  • 51% of all sales were cash purchases, up from 43% a year ago
  • 53.9% of all sales were “at or above” list price at time of contract, a seven year record
  • Luxury housing prices did not see the same growth as overall market
  • Days on market was lowest (fastest) in 15 years at an average of 73 days
  • Larger price gains seen in larger apartments such as 2, 3, 4 bedrooms than studios – 1 bedrooms
  • New development market share of closed sales continued to rise

Tags: , ,


[VIDEO] Boomberg TV ‘Market Makers’ 7-27-15

July 27, 2015 | 10:49 pm | | Reports |

Had a nice conversion this morning with Matt Miller and Stephanie Ruhle on Bloomberg TV’s ‘Market Makers.’ Never been on this show before. Wow. Energy+.

Before the show started, we had a active debate on whether ‘American Flyers‘ or ‘Breaking Away‘ was the best bicycling movie. Clearly ‘Breaking Away” was the better of the two HANDS DOWN but I liked the other a lot, especially for someone who likes the whole culture of bike racing. Not sure what bike movies had to do with our ‘state of the Hamptons market’ discussion covering our Hamptons market report for Douglas Elliman, but hey, it was obviously more important to settle the bike movie issue first.

Tags: , , , ,


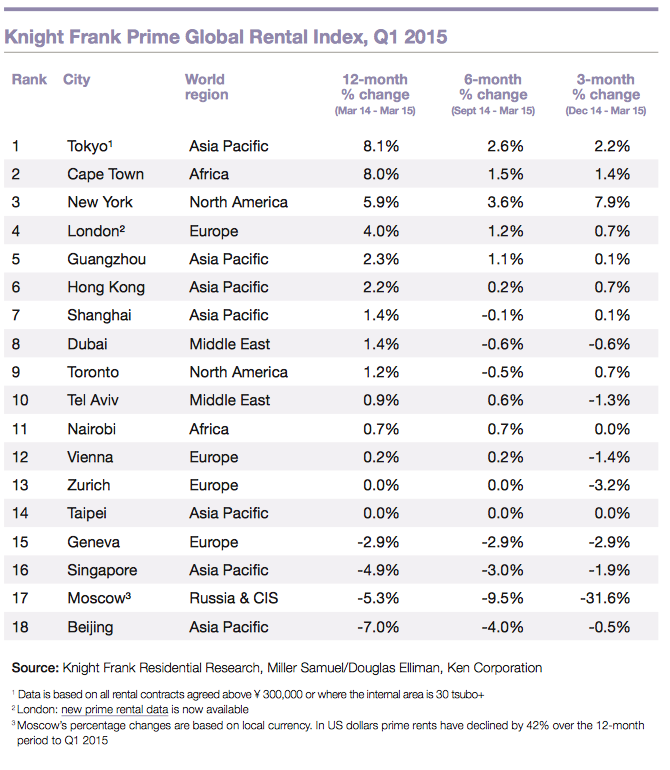
Knight Frank: Moscow Rents Dropped 42% YoY in US Dollars

July 6, 2015 | 2:40 pm | | Reports |

Knight Frank just published their 1Q 2015 Prime Global Rental Index. We provide the U.S. info. Always a fascinating read.

Especially this:

In Moscow, prime rents have historically been US Dollar denominated but the weakness of the Rouble against the US Dollar has led an increasing number of landlords to swap their rents into Roubles. In US Dollar terms prime rents fell 42% on an annual basis but by only 5% in Rouble terms.

Here are the world rankings:

KFPGRI1q15table

Tags: , , , ,


2Q 2015 Manhattan Sales Market Breaks A “Record Number of Records”

July 5, 2015 | 9:38 pm | Reports |

Manhattan_2Q15

Last Thursday, the 2Q 2015 Manhattan Sales Report we prepared for Douglas Elliman (part of the Elliman Report series I’ve been writing for 21 years) was published.

I spoke at length about the report in last Friday’s Housing Note: What Greek Debt Crisis? Manhattan Set A Record Number of Housing Records.

You might considering signing up for it. I clear my mind of all the housing clutter accumulated during the week into a thought piece that tries to make sense of what is going on. It’s got plenty of humor and sarcasm, but most importantly, it has plenty of understandable insights, data and charts.

housingnotes_logo

Sign up here as thousands of others have. It’s free and best of all, you’ll make me happy. Even better, if you like it, share it with others.

But I digress…

There were lots of Manhattan records set in 2Q 2015. Here’s a partial list I created for last Friday’s Housing Note: What Greek Debt Crisis? Manhattan Set A Record Number of Housing Records.

Co-op/Condo
Highest Average Sales Price
Highest Average Sales Price – New Development
Highest Average PPSF – New Development
Highest Median Sales Price – New Development
Highest Average Sales Price – Resales
Largest Average Square Feet – New Development
Highest 2-Bedroom Median Sales Price
Highest Median Sales Price 5th Quintile
Highest Median Sales Price 2nd Quintile
Highest Median Sales Price 1st Quintile

Co-op
Highest Average Sales Price
Highest Median Sales Price
Highest Median Sales Price – Resales
Highest Average PPSF – Downtown
Highest Median Sales Price – 2-Bedroom
Highest Average Sales Price – 2-Bedroom
Highest Average PPSF – 4+ Bedroom
Highest Median Sales Price 5th Quintile
Highest Median Sales Price 4th Quintile
Highest Median Sales Price 3rd Quintile
Highest Median Sales Price 2nd Quintile

Condo
Highest Average Sales Price
Highest Average Sales Price – New Development
Highest Average Sales Price – Resales
Highest Average PPSF – Resales
Highest Median Sales Price – Resales
Highest Median Sales Price – Studio
Highest Median Sales Price 5th Quintile
Highest Median Sales Price 4th Quintile
Highest Median Sales Price 1st Quintile

Loft (Co-op+Condo)
Highest Average PPSF
Highest Average Sales Price – Resales
Highest Average PPSF – Resales

Luxury (Co-op+Condo) – Top 10%
Highest Average Sales Price
Highest Average Sales Price – New Development
Highest Median Sales Price – Co-op
Highest Median Sales Price – Condo
Highest Median Sales Price – Resale

Tags:


3Q14 Manhattan Sales Market: Operating Just Below Record Levels

October 1, 2014 | 6:17 pm | | Reports |

Manhattan_3Q14

Today Douglas Elliman published the Elliman Report on Manhattan Sales that I author. This quarterly report is part of an evolving market report series I’ve been writing for Douglas Elliman since 1994 (20 years!).

Key Points
– Sales fell below last year’s third quarter record but still 29% above decade quarterly average.
– Luxury market price gains outpaced the overall market.
– Inventory is up from last year’s low but still 18% below decade quarterly average.
– New development market share of closed sales was up from year ago level, but expected to rise sharply over next year.
– Highest market share of sales at or above list price in 6 years (49.2%).

Here’s an excerpt from the report:

Manhattan housing prices continued to rise as additional supply remained inadequate to meet demand. Bidding wars and a shift toward larger units applied additional upward pressure to rising price trends. Sharp gains in New York City employment, the continued influx of international investors and low mortgage rates have kept the market tight. A product of five years of pent-up demand and the fear of rising mortgage rates, sales volume fell short of prior year records. Marketing times and negotiability eased, as the market downshifted from last year’s frenetic pace. Luxury market price growth exceeded the overall market, while new development product targeted at the luxury segment continued to enter the market…

The Elliman Report: 3Q14 Manhattan Sales [Miller Samuel]
Miller Samuel Aggregate Database [Miller Samuel]
Market Chart Gallery [Miller Samuel]


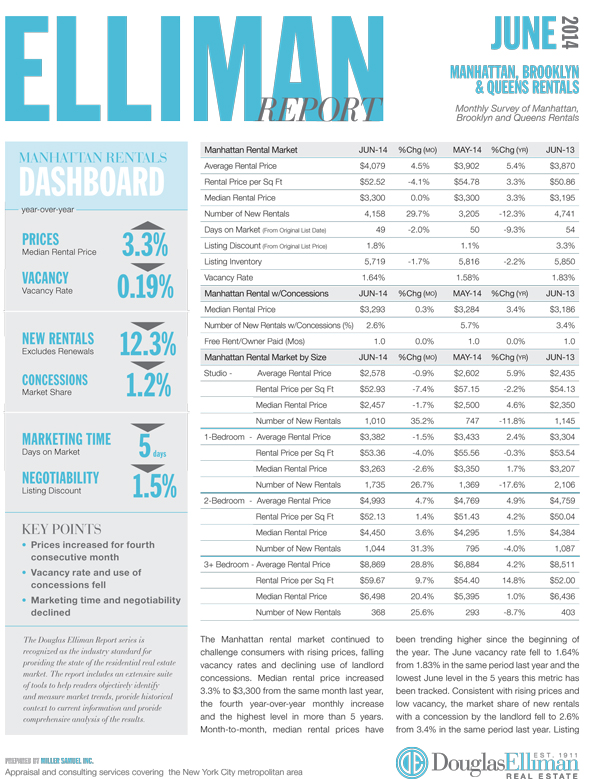
Adding Queens To Our Manhattan/Brooklyn Rental Report

July 14, 2014 | 9:12 am | | Reports |

Rental_0614

We’ve expanded the Elliman rental report to include Queens this month and added additional metrics for Manhattan and Brooklyn.

MANHATTAN
– Prices increased for 4th consecutive month after year end lull.
– Median rent is at highest point in more than 5 years.
– The vacancy rate was lowest June in 5 years.
– Use of concessions continued to fall, now at nominal levels.
– Marketing times and negotiability continued to fall.
– Luxury market outperformed the overall market.

BROOKLYN
[North, Northwest, East Regions]
– Median rental price up year over year for 13 consecutive months.
– Rents hovering near record highs but have remained stable since beginning of year.
– New rentals surged indicating resistance to price increases at time of renewal.
– Nominal use of concessions by landlords.
– Overall market outperformed luxury market, price growth stronger in smaller units.
– Manhattan-Brooklyn rental price gap remained at $500, more than the $210 record low in February but less than half of 2008 level.

QUEENS
[Northwest Region]
– Median rental price year-over-year slipped after 4 consecutive monthly increases.
– Shift in mix to smaller units (60.2% share of 1-bedrooms) pulling down overall prices.
– Nearly half of the rental stock is located in new development buildings.
– Overall market outperformed luxury market, price growth stronger in smaller units.
– Marketing time slipped as listing discount remained nominal.


The Elliman Report [Miller Samuel]
Miller Samuel Aggregate Database [Miller Samuel]
Chart Gallery [Miller Samuel]


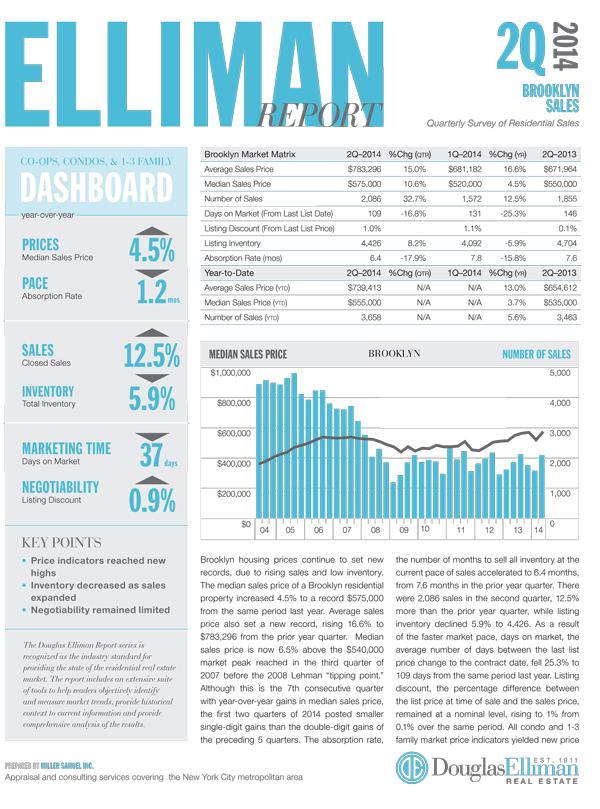
2Q14 Brings Mixed Regional Messages – Brooklyn, Queens and Westchester/Putnam Reports

July 14, 2014 | 8:53 am | | Reports |

If you’ve been:

A. Pouring over state maps of pet ownership
B. Watching the World Cup
C. Watching the Tour de France
D. Fretting about the Russell Stover purchase

Then you may have missed last week’s market report releases for Brooklyn, Queens and Westchester/Putnam Reports. These are part of the report series I’ve been writing for Douglas Elliman since 1994 (20 years!). The reports have a new look – hope you like them.

Click on graphics to open them.

Brooklyn_2Q_2014

BROOKLYN SALES MARKET Brooklyn housing prices continue to set new records, due to rising sales and low inventory. The median sales price of a Brooklyn residential property increased 4.5% to a record $575,000 from the same period last year. Average sales price also set a new record, rising 16.6% to $783,296 from the prior year quarter. Median sales price is now 6.5% above the $540,000 market peak reached in the third quarter of 2007 before the 2008 Lehman “tipping point.” Although this is the 7th consecutive quarter with year-over-year gains in median sales price, the first two quarters of 2014 posted smaller single-digit gains than the double-digit gains of the preceding 5 quarters…

Queens_2Q_2014

QUEENS SALES MARKET The Queens housing market took a breather after 6 consecutive quarters of rising sales. There were 2,404 sales in the second quarter, 3.6% less than the same period last year. Year to date, the number of sales remained 14.2% higher than the same period last year due to the sharp rise in first quarter sales activity. Despite the decline, listing inventory continued to fall for the 13th consecutive quarter. There were 5,892 listings at the end of the second quarter, 5.3% less than the same period last year. As a result of the combination of declining sales and falling inventory, the pace of the market remained stable…

Westchester_2Q_2014

WESTCHESTER/PUTNAM SALES MARKET Westchester single family contract activity was higher than prior year levels as severe winter weather conditions pushed first quarter pending sales into the second quarter. Despite the 16.7% decline in closed home sales, total contracts expanded 3.9% from the prior year quarter and jumped 51.9% from the prior quarter. The rise in contracts from first to second quarter was higher than the 35.5% average increase of the prior 2 years. Listing inventory expanded 7.9% to 3,905 rising from the low water mark set in 2013…


Miller Samuel Aggregate Database [Miller Samuel]
Market Chart Gallery [Miller Samuel]


2Q14 Manhattan Sales Market: More Supply, But Not Even Close to Enough

July 1, 2014 | 5:55 pm | | Charts |

Manhattan_2Q_2014

Today Douglas Elliman published the Elliman Report on Manhattan Sales that I author. This quarterly report is part of an evolving market report series I’ve been writing for Douglas Elliman since 1994 (20 years!).

Incidentally, we are tweaking the visual aspects of this Elliman report series – we do this every few years. We added a dashboard to provide at-a-glance information but expanded and yet consolidated the text to be one comprehensive section. I expanded the size of the charts but kept the matrix tables just about the same. Since this is a labor of love and a work in progress, please feel free to send along suggestions.

Key Points
– Sales increased for the 7th consecutive quarter, but less at a lower rate than the 27.6% average quarterly increase of the prior 4 quarters.
– Median sales price for co-ops increased 9% as consumer sought out greater affordability as condos increased 0.8%.
– Inventory is up from last year’s near record low. The inventory bottom appears to have been reached in 4Q 2013.
– There were 45.9% listings that sold at or above list price, the largest market share in nearly 6 years.
– Luxury price increases out paced the overall market.
– Sellers are being both motivated and enabled to list as a result of rising prices.
– Mortgage lending remains significantly challenging to buyers.

Here’s an excerpt from the report:

Manhattan housing prices continued to press higher, driven by low inventory and seven consecutive quarters of year-over-year sales growth. Mortgage rates have drifted lower, nearly returning to their prior year levels while the local economy has added jobs and international demand for product has been relentless. The luxury market showed the most price gains as more new development product has begun to close…

Here is some context on the lack of inventory [click each chart to expand]:

2q14Manhattan-inventorybyMonth

2q14Manhattan-inventorySPLIT


The Elliman Report: 2Q14 Manhattan Sales [Miller Samuel] Miller Samuel Aggregate Database [Miller Samuel] Market Chart Gallery [Miller Samuel]


May 2014 Report: Manhattan and Brooklyn Rentals Swap Roles

June 12, 2014 | 1:29 pm | | Reports |

Rental_0514 Today Douglas Elliman published the Manhattan/Brooklyn rental report that I author. This monthly report is part of an evolving market report series I’ve been writing for Douglas Elliman since 1994 (20 years!). We discontinued the quarterly rental report series but still present the information in our aggregate database.

MANHATTAN
– Median rental price increased to the highest level in more than 5 years.
– After softening in late 2013 with intensive competition from the sales market, median rental prices have trended higher since the beginning of 2014.
– Although the market share of landlord concessions edged higher over the year ago level last year, they have fallen sharply from 13.1% in January.
– Vacancy rate slipped nominally from same period last year, hovering near multi-year lows.
– New rental activity fell reflecting the increased likelihood that tenants would renew their leases as a result of limited alternatives to increased affordability.

BROOKLYN
[North, Northwest Regions]
– Median rental price increased from the same period last year but has showed some stability since the beginning of the year.
– 2 and 3-bed apartments showed weaker price trends with the addition of new rental housing stock and intense competition from the purchase market.
– There was a sharp drop in new rentals from the same month a year ago as more tenants were resigned to sign their leases at time of renewal.
– Although marketing times expanded slightly, negotiability dropped sharply reflecting the ongoing tight market conditions.

Here’s an excerpt from the report:

MANHATTAN For the third consecutive month, median rental price increased above the prior year level. Median rental price was $3,300, 3.1% above the same period last year and the highest level reached since early 2009. After weakening in the second half of 2013 from intensive competition from the sales market, median rental prices have generally trended higher since the beginning of the year. The remaining rental price indicators were mixed. Average rental price slipped 1.2% to $3,902 and average rental price per square foot increased 7.1% respectively from the same month last year…

BROOKLYN Median rental price increased 8.6% to $2,800 from the same month last year, yet remained essentially unchanged from the prior month. Since the beginning of the year, median rental price has showed some stability on a month-over-month basis…

The Elliman Report: 5-2014 Manhattan/Brooklyn Rentals [Miller Samuel]
The Elliman Report: 5-2014 Manhattan/Brooklyn Rentals [Douglas Elliman]
Miller Samuel Aggregate Database [Miller Samuel]
Chart Gallery (Brooklyn Monthly) [Miller Samuel]
Chart Gallery (Manhattan Monthly) [Miller Samuel]
Chart Gallery (Manhattan Quarterly) [Miller Samuel]

Tags: , ,

Get Weekly Insights and Research

Receive Jonathan Miller's 'Housing Notes' and get regular market insights, the market report series for Douglas Elliman Real Estate as well as interviews, columns, blog posts and other content.

Follow Jonathan on Twitter

#Housing analyst, #realestate, #appraiser, podcaster/blogger, non-economist, Miller Samuel CEO, family man, maker of snow and lobster fisherman (order varies)
NYC CT Hamptons DC Miami LA Aspen
millersamuel.com/housing-notes
Joined October 2007