Skip to content
Services
Appraisals
Consulting
Resources
Market Reports
Charts
Matrix Blog
Articles & Research
Press
About
get in touch
Charts
› New York City
November 15, 2017
Bloomberg News
,
Charts, Maps, Images, Infographics, Video
,
CNBC
,
Housing Trends & Cycles
,
Luxury, Super, Ultra, Mega
,
Manhattan
,
PBS Nightly Business Report
One57 Flip Analysis From Manhattan’s Peak New Development
read more
October 5, 2017
Bloomberg TV
,
Charts, Maps, Images, Infographics, Video
,
Historical, Landmark, Milestone
,
Luxury, Super, Ultra, Mega
,
Manhattan
,
Media
On Bloomberg TV: What’d You Miss? 10-5-2017
read more
September 18, 2017
Analysis & Research
,
Charts, Maps, Images, Infographics, Video
,
Douglas Elliman
,
Greenwich
,
Hamptons/North Fork
,
Housing Trends & Cycles
,
Los Angeles
,
Manhattan
,
Miami (Beach + Mainland)
Real Estate ChartArt in Elliman Magazine’s Fall 2017 Issue
read more
September 11, 2017
Bloomberg Radio
,
Bloomberg TV
,
Historical, Landmark, Milestone
,
Manhattan
,
Media
The NYC Downtown Resurgence After 9/11
read more
June 15, 2017
Analysis & Research
,
Development, Construction, Architecture & Land
,
Luxury, Super, Ultra, Mega
,
Manhattan
,
Media
[Forbes] Penthouse Juxtaposition – What Developer Wants v. What Market Supports
read more
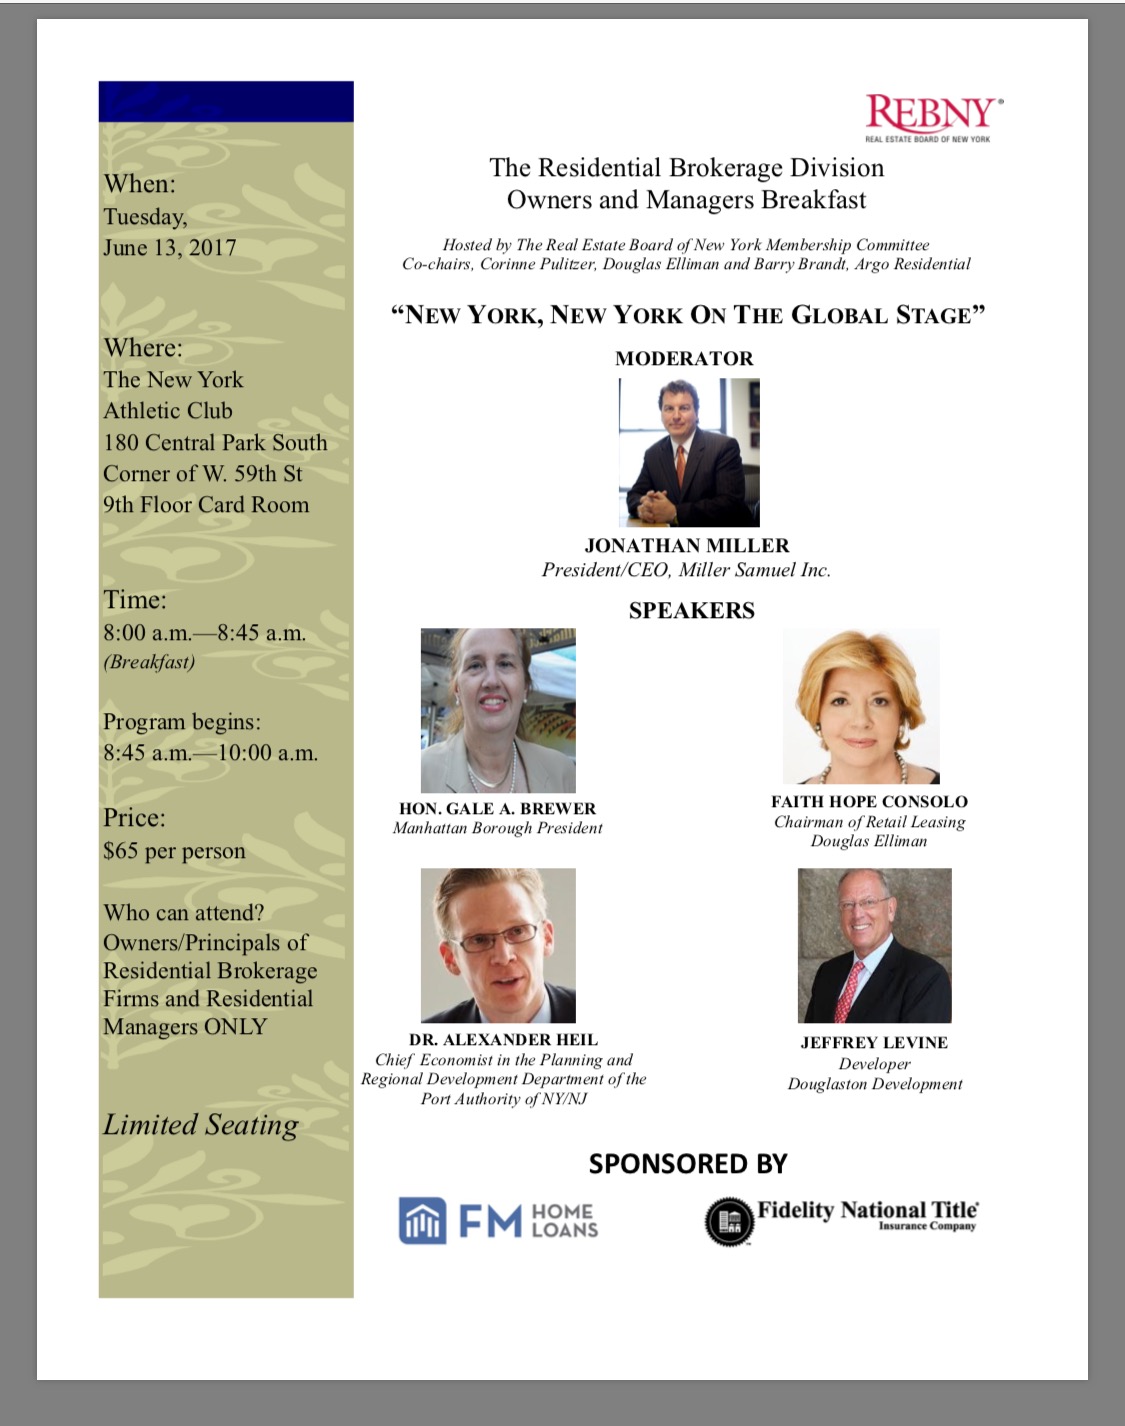
May 28, 2017
International
,
Manhattan
,
Public Speaking
,
REBNY
Moderating REBNY Panel: New York, New York On The Global Stage
read more
April 7, 2017
Charts, Maps, Images, Infographics, Video
,
Dutchess County, NY
,
Manhattan
,
New York Times
,
Putnam County
,
Suburban, Urban, Commuting
,
Westchester County, NY
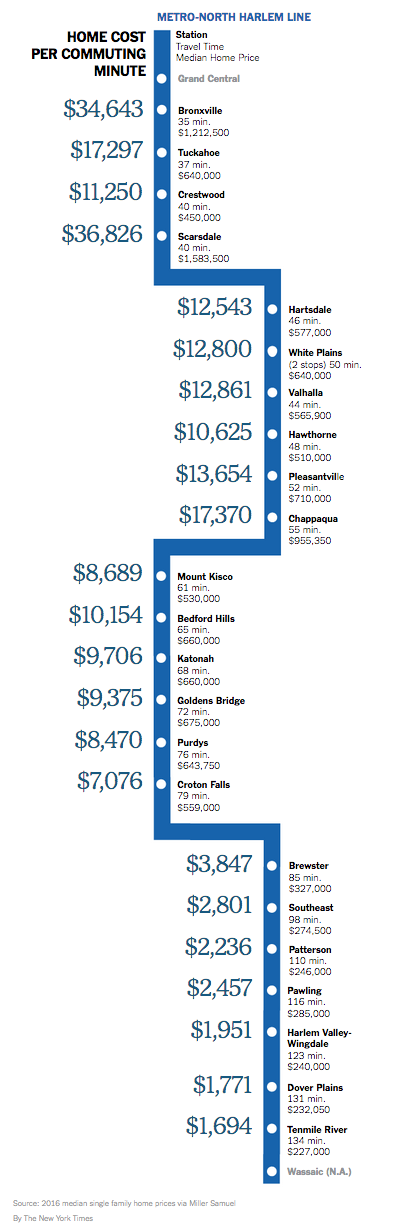
Westchester to Manhattan Commute Time by Housing Cost
read more
March 26, 2017
Analysis & Research
,
Manhattan
Agricultural Land versus Manhattan Parking Per Acre
read more
March 4, 2017
Housing Indices & Portals
,
Luxury, Super, Ultra, Mega
,
Manhattan
,
Rentals, Investing
,
Sales
Our Manhattan Luxury Housing Price Indices on Bloomberg Terminals
read more
February 15, 2017
Celebrity, Pop Culture
,
Development, Construction, Architecture & Land
,
Housing Trends & Cycles
,
Manhattan
,
Mansion Global
,
Public Speaking
Mansion Global’s State of the Real Estate Market Event
read more
January 23, 2017
Development, Construction, Architecture & Land
,
Government, Politics, Regulations & Policy
,
Law, Ethics & Fraud
,
Miami (Beach + Mainland)
,
New York City
“Kleptocracy Initiative” to Stop Money Laundering in Real Estate up for Renewal
read more
January 21, 2017
Charts, Maps, Images, Infographics, Video
,
Elliman Reports
,
Housing Trends & Cycles
,
Manhattan
,
New York Times
,
Statistics, Metrics & Data
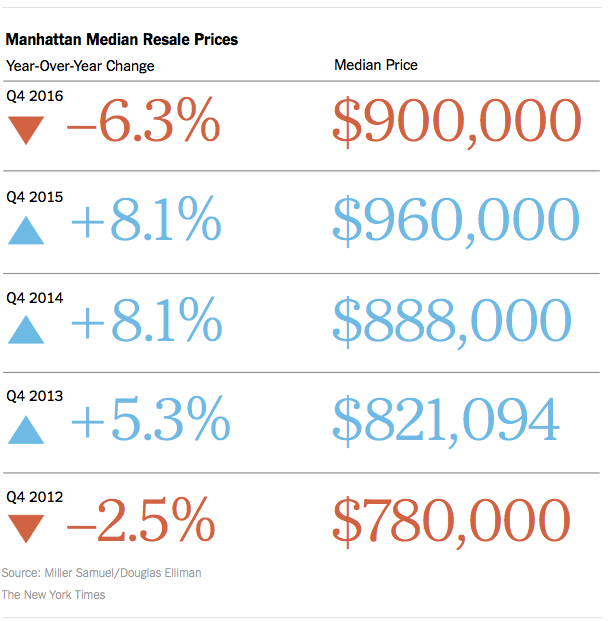
NYT Calculator Chart: The Resale Pendulum Swings Toward Middle
read more
Previous
5
6
7
Next
Load More Posts
Page load link
Go to Top