Skip to content
Services
Appraisals
Consulting
Resources
Market Reports
Charts
Matrix Blog
Articles & Research
Press
About
get in touch
Charts
› Charts, Maps, Images, Infographics, Video
September 13, 2014
Charts, Maps, Images, Infographics, Video
,
Housing Trends & Cycles
,
Manhattan
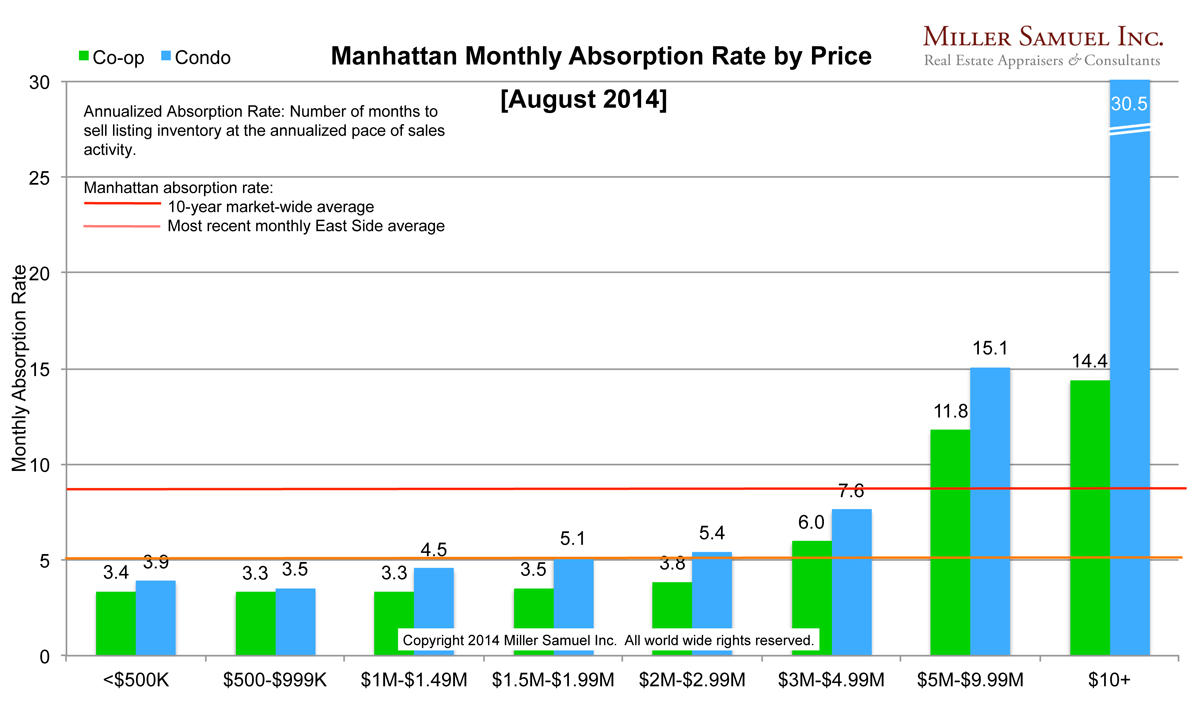
[Manhattan Absorption] August 2014 The $3M-$5M Market Slows Down
read more
August 31, 2014
Blogging Off The Matrix
,
Bloomberg View
,
Charts, Maps, Images, Infographics, Video
,
Housing Trends & Cycles
Bloomberg View Column: Understanding Housing’s Dog Days
read more
August 31, 2014
Charts, Maps, Images, Infographics, Video
,
Curbed
,
Manhattan
,
Statistics, Metrics & Data
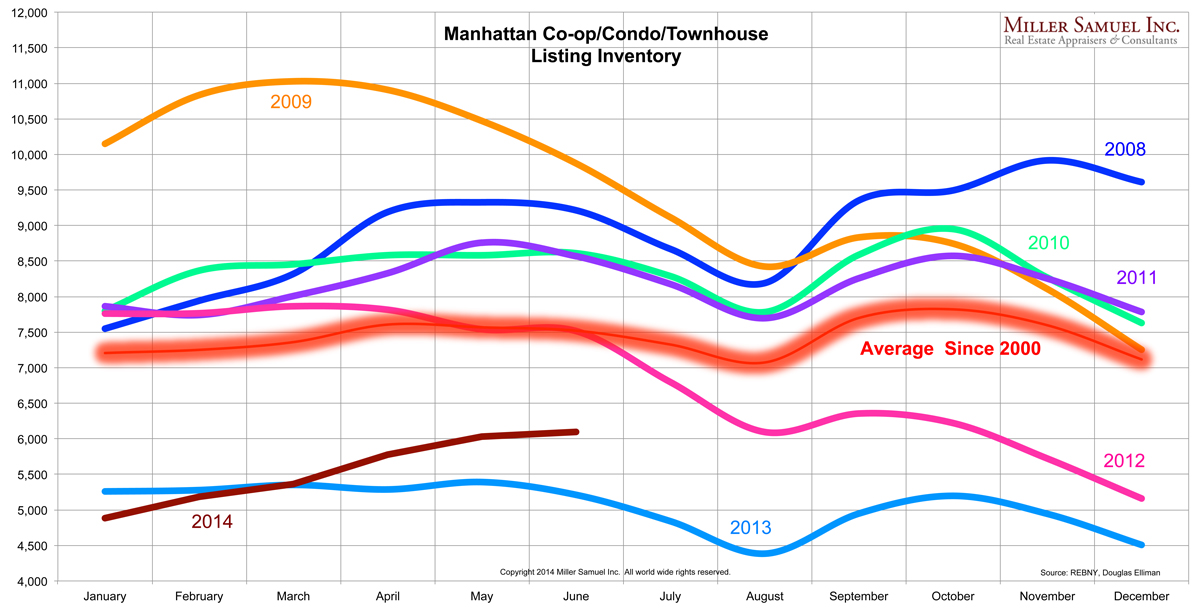
[Three Cents Worth #269 NY] Charting A Decade of Manhattan Inventory
read more
August 31, 2014
Affordability, Affordable Housing
,
Charts, Maps, Images, Infographics, Video
,
Curbed
,
Development, Construction, Architecture & Land
,
Government, Politics, Regulations & Policy
,
Housing Trends & Cycles
,
Manhattan
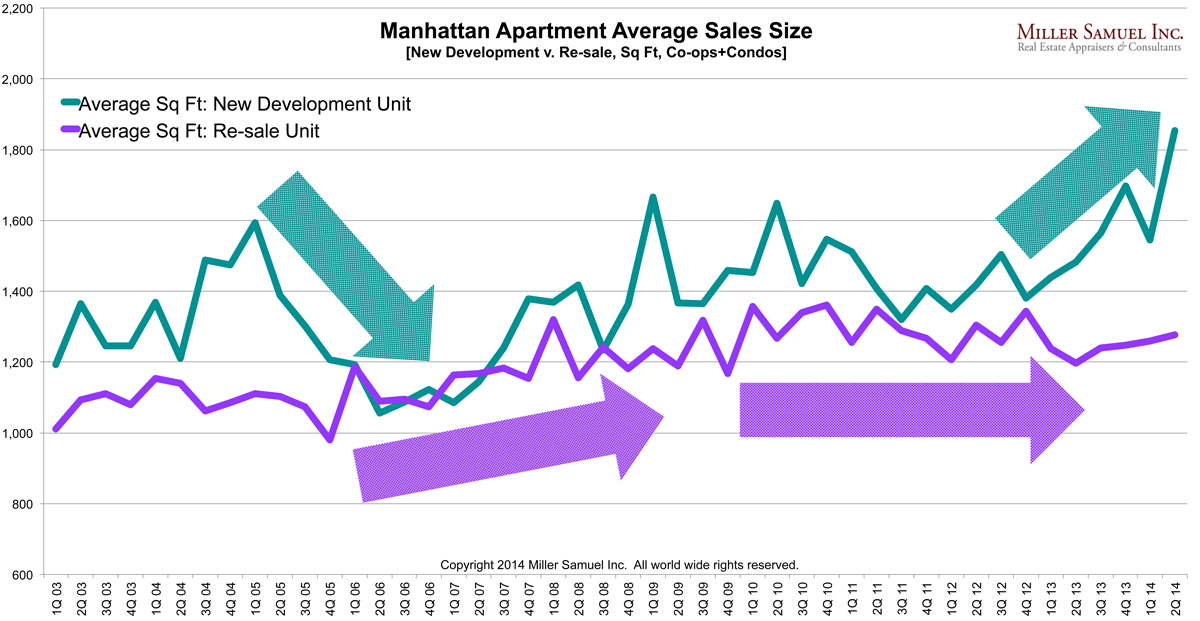
[Three Cents Worth #268 NY] Units In New Developments Grow Larger
read more
August 5, 2014
Blogging Off The Matrix
,
Brooklyn
,
Charts, Maps, Images, Infographics, Video
,
Curbed
,
Housing Trends & Cycles
,
Luxury, Super, Ultra, Mega
,
Manhattan
,
New York City
,
Queens
,
Records, Thresholds and Outliers
[Three Cents Worth #267 NY] NYC Sets New Record Average Sales Price
read more
July 14, 2014
Charts, Maps, Images, Infographics, Video
,
Manhattan
Manhattan Inventory: This is what I mean by rising, but not enough
read more
July 1, 2014
Charts, Maps, Images, Infographics, Video
,
Development, Construction, Architecture & Land
,
Housing Trends & Cycles
,
Manhattan
Rocket Ship: Manhattan New versus Existing Average Sales Price
read more
June 24, 2014
Analysis & Research
,
Charts, Maps, Images, Infographics, Video
,
Housing Indices & Portals
,
Housing Trends & Cycles
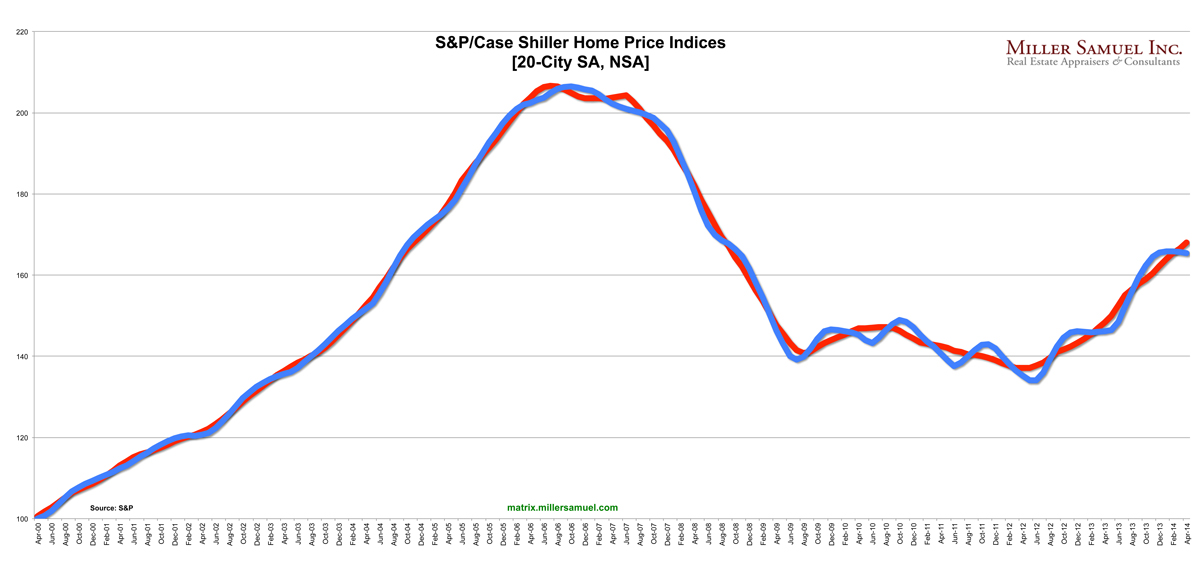
Time-Shifted Case Shiller: Dallas, Denver Crushing it, Polar Vortex a Non-Issue ‘Cause It’s Still December
read more
June 23, 2014
Charts, Maps, Images, Infographics, Video
,
Housing Trends & Cycles
NAR May 2014 Existing Home Sales: ‘Heat-up’
read more
June 23, 2014
Affordability, Affordable Housing
,
Charts, Maps, Images, Infographics, Video
,
Credit, Finance, Mortgage, Rates
,
Economy
,
Wall Street Journal
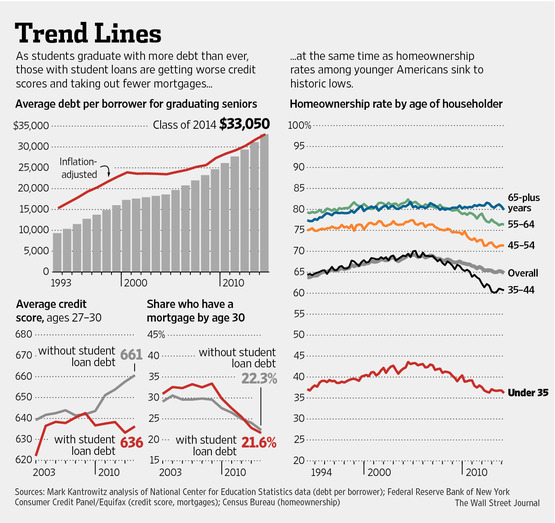
Terrific Chart on Homeownership by Age
read more
June 20, 2014
Charts, Maps, Images, Infographics, Video
,
Development, Construction, Architecture & Land
,
Douglas Elliman
,
Housing Trends & Cycles
,
Luxury, Super, Ultra, Mega
,
Manhattan
,
Sales
Manhattan New Development: Small Share, But Rising Sharply
read more
June 16, 2014
Affordability, Affordable Housing
,
Boom Bubble Bust
,
Charts, Maps, Images, Infographics, Video
,
Economy
,
Federal Reserve, New York
Housing is a Drag: US Student Debt Bubble Made Worse by the Baby Boomer Nanny State
read more
Previous
9
10
11
Next
Load More Posts
Page load link
Go to Top