Matrix Blog

Posts Tagged ‘Seasonality’

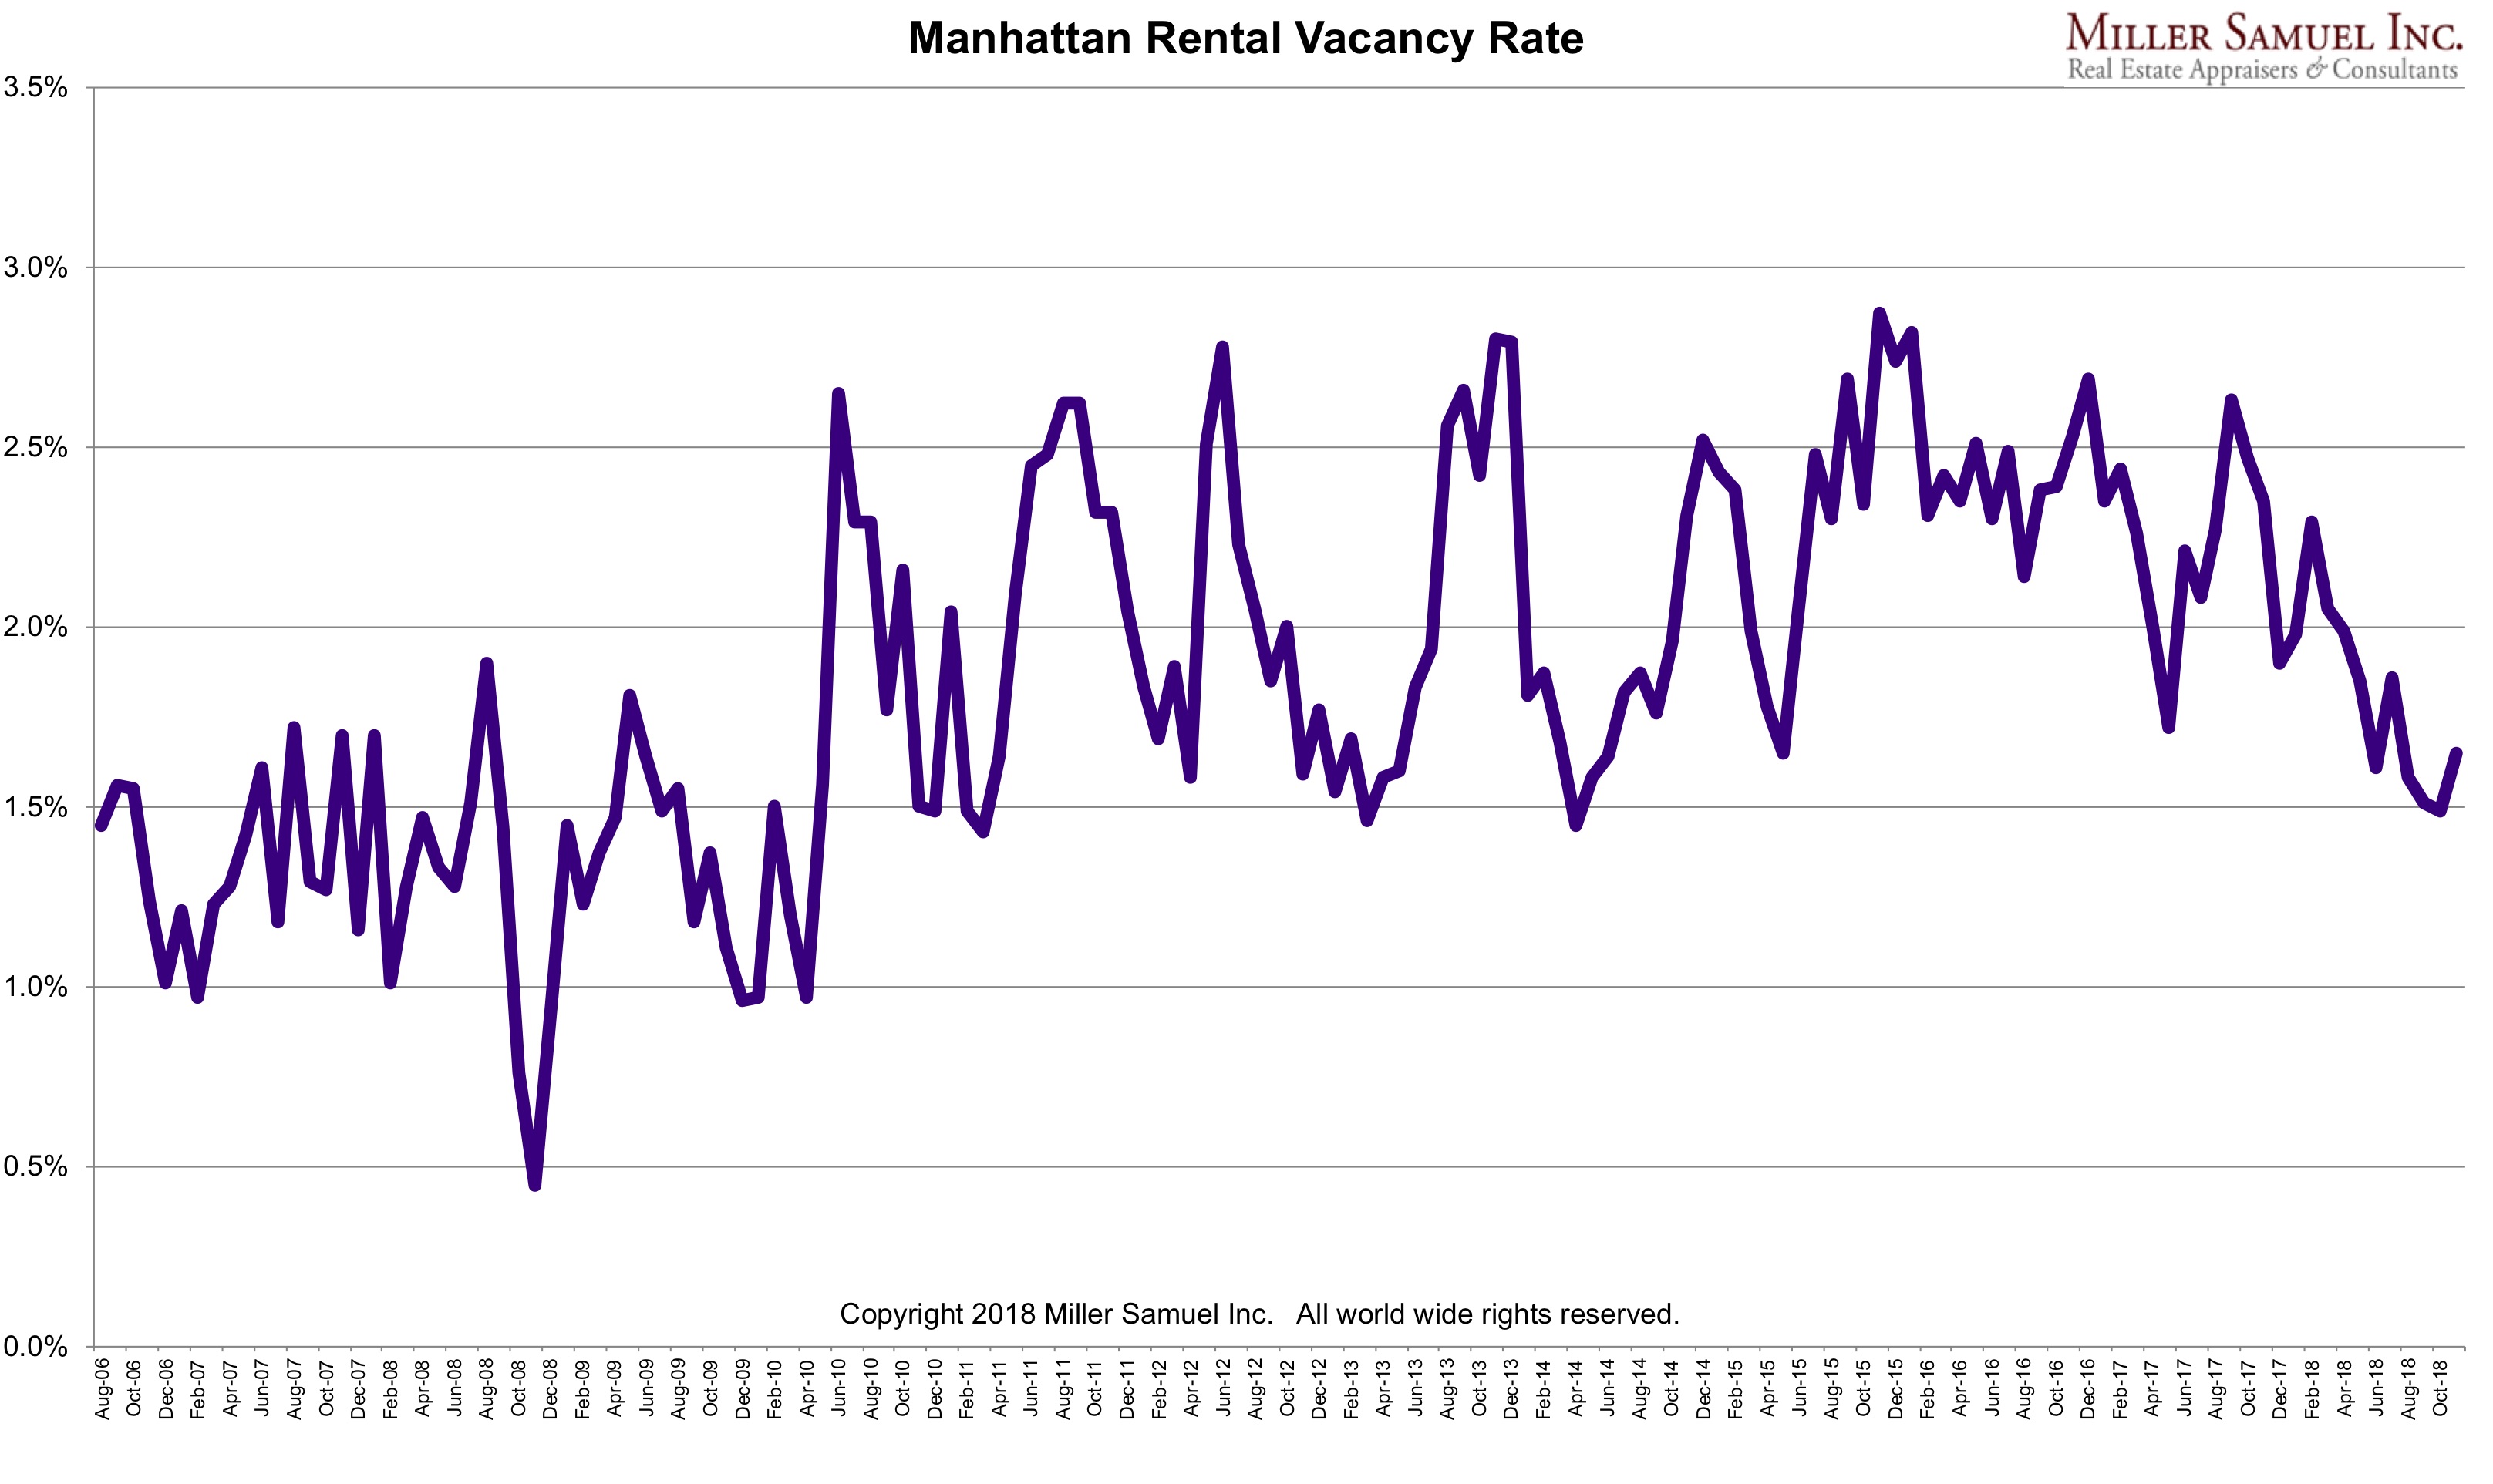
Manhattan Residential Vacancy Rate Isn’t Seasonal?

December 13, 2018 | 1:01 am | Charts |

Since housing market trends are all about seasonality, I thought it was interesting that the Manhattan residential vacancy rate seems devoid of such patterns.

What am I missing here?

Tags: , ,


Tracking the Flock of (Ultrawealthy) Seagulls

March 6, 2016 | 10:02 am | |

There has been voluminous discussion in recent years about following and marketing to the high end of the demographic scale, especial the real estate market. It’s been the focus of much of the new housing development action of the past five years, especially in big U.S. coastal cities. The high end development market has been widely chronicled here and within my weekly Housing Notes newsletter.

For buyers in the super luxury housing market, owning multiple homes is less about a primary residence with a second home and more about owning “stops on the big circuit.”

And as the rich own a greater share of real estate, major cities like New York, Los Angeles and London are going through a kind of “resortification,” familiar to posh beach towns or ski resorts, as their populations become more seasonal.

For Manhattan, these birds are rare in February and squawking on all treetops (bad pun for super tall condo penthouses) at full capacity in June.

nytcityhopping

And no, I never liked that band.

Tags: , , , , , , ,


[Three Cents Worth #289 NY] Proof: Summer Is the Hardest Time to Rent in New York City

June 25, 2015 | 11:07 pm | |

It’s time to share my Three Cents Worth (3CW) on Curbed NY, at the intersection of neighborhood and real estate in the capital of the world…and I’m here to take measurements.

Check out my 3CW column on @CurbedNY:

This week I thought I’d dig out some of the residual stuff from last week’s rental report to explore the vacancy hyperbole. As far as I know, firms that present the vacancy rate (including mine) use a sampling of buildings from different neighborhoods/regions of Manhattan where building rental status is continually updated. The bottom line—and a reality check—is that the vacancy rate has always been low. It’s remained below 5 percent since at least World War II. (At least that’s what I’ve read; I only started writing for Curbed circa 2004.)…

3cwNY2015-6-17

[click to expand charts]


My latest Three Cents Worth column: Three Cents Worth: Proof: Summer Is the Hardest Time to Rent in New York City [Curbed]

Three Cents Worth Archive Curbed NY

Three Cents Worth Archive Curbed DC

Three Cents Worth Archive Curbed Miami

Three Cents Worth Archive Curbed Hamptons

Three Cents Worth Archive Curbed LA

Three Cents Worth Archive Curbed Ski

Tags: , , , ,


Bloomberg View Column: Housing Market Blows Hot and Cold

February 8, 2015 | 5:32 pm | | Charts |

BVlogo

Read my latest Bloomberg View column Housing Market Blows Hot and Cold.

2015-05BVchart

Please join the conversation over at Bloomberg View. Here’s an excerpt…

The northern third of the U.S. is locked in a straitjacket of snow, ice and bleak weather better suited to staying at home than going out and hunting for a new one. I can almost hear it now: Remember how awful last year’s polar vortex was for the fledgling housing-market recovery?…

[read more]


My Bloomberg View Column Directory

My Bloomberg View RSS feed.

Tags: , ,


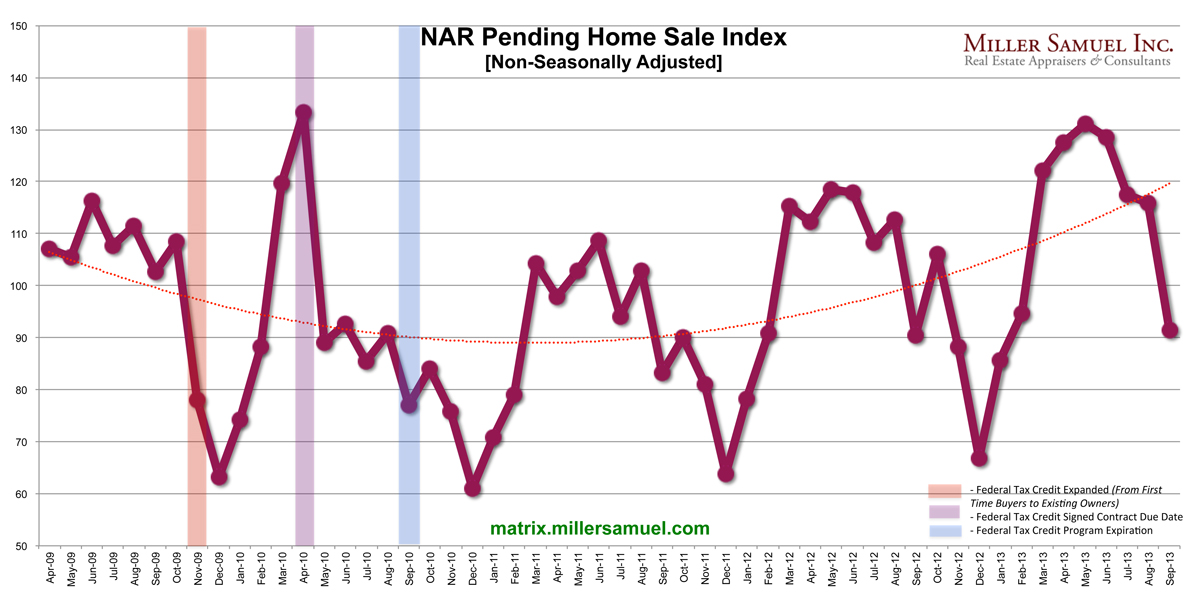
NAR Pending Home Sale Index Sort of Goes Negative

October 28, 2013 | 7:31 pm | | Charts |


[click to expand]

According the National Association of Realtors, their Pending Home Sales Index fell 5.6% from August to September 2013 (seasonally adjusted), the largest monthly drop since May 2010 after the artificial prop of the 2009-2010 federal homebuyers tax credit expiration caused contracts to drop by nearly 1/3 from bloated levels.

Removing seasonality from the results makes the year-over-year adjustment show nominally 1.1% higher contract volume from September 2013 than in 2012 rather than a 1.2% decline. Still, the results were weak.

Why did pending sales post weaker results?

  • Don’t blame the partial government shutdown – that came later.
  • After the May 2013 Fed surprise announcement, fence sitters surged to the market to lock in before mortgage rates rose further, bloating contract volume over the summer (and why month-over-month seasonal adjustments to this data are so very misleading).
  • The surge in summer sales “poached” from future organic volume that we would have seen in September so we were already expecting a slow down in volume. Didn’t we learn in 2010 what happens when unusual circumstances press volume sharply higher only to see volume fall sharply when that circumstance disappears?

Weaker conditions prevail, but its really not as bad a report result as being discussed – namely because the seasonal adjustments paint a weaker picture than what actually happened, and we expected a decline in activity because the prior several months were artificially pushed higher with so many more buyers rushing to the market to beat rising rates (or the perception of rising rates).

Tags: , , , , ,


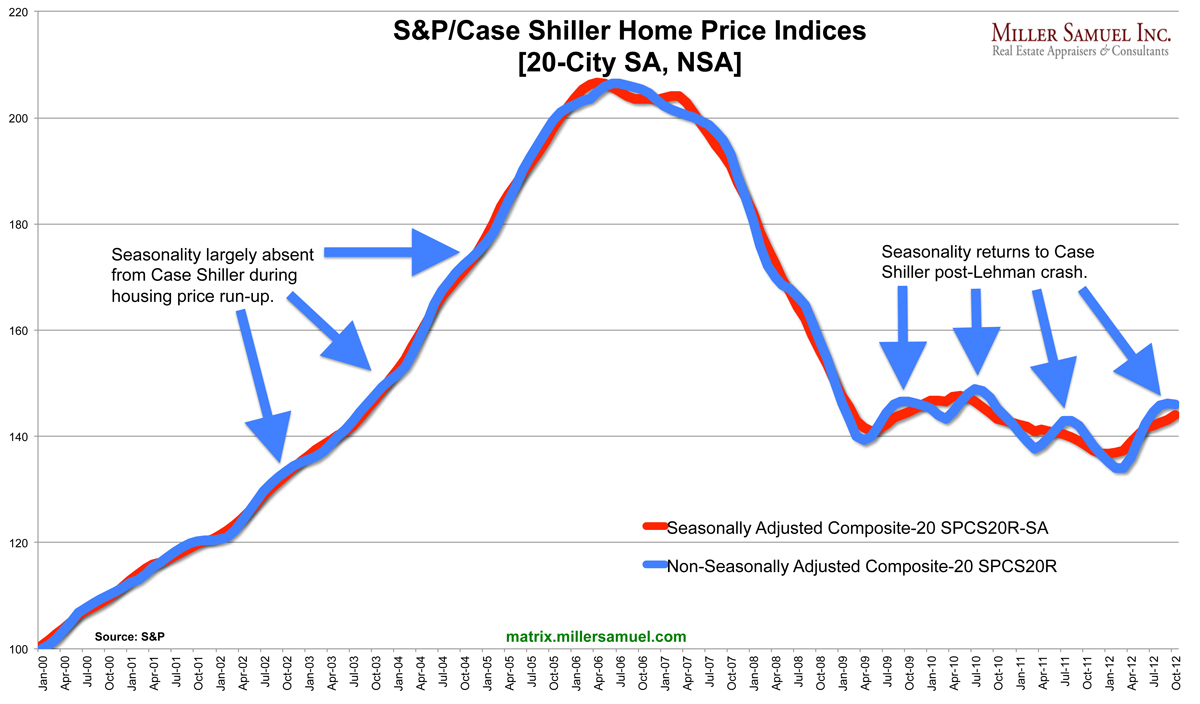
[Case Shiller] Recovery Is Back In Season

December 27, 2012 | 7:00 am | Charts |


[click to expand chart]

Well the frequently maligned but most influential housing metric was published yesterday, the S&P/Case Shiller Home Price Indices and the 20 City index rose 4.3% year-over-year. The only two “regions” to see declines were Chicago and New York.

Baseball Correlation? Chicago and New York are the only 2 cities who also have 2 Major League Baseball teams. No, Los Angeles doesn’t have two MLB teams…the Los Angeles Angels of Anaheim are clearly trying to have it both ways.

But I digress…

With all the talk about “recovery” (aka happy housing news) these days it just dawned on me that since 2000, the Case Shiller HPI only began to show significant seasonality since mid-2009. No one has really talked about this and I’m not sure what it means, but it just jumped out at me today.

Pre-peak housing prices fueled by falling lending standards and the seasons were largely crushed by the locomotive known as the housing boom. Therefore the seasonally adjusted and non-seasonally adjusted price trends were virtually the same during the market’s ascent. I distinctly remember real estate agents commenting during this period that the seasons were going away and housing market patterns were changing permanently.

Post-peak housing prices After the plunge subsided in mid-2009, the market began to ebb and flow with peaks in the spring/summer and troughs in the fall/winter.

Note to self
The next time CSI prices begins to smooth into nothingness, perhaps it’s a housing boom, baby.

Tags: , , ,


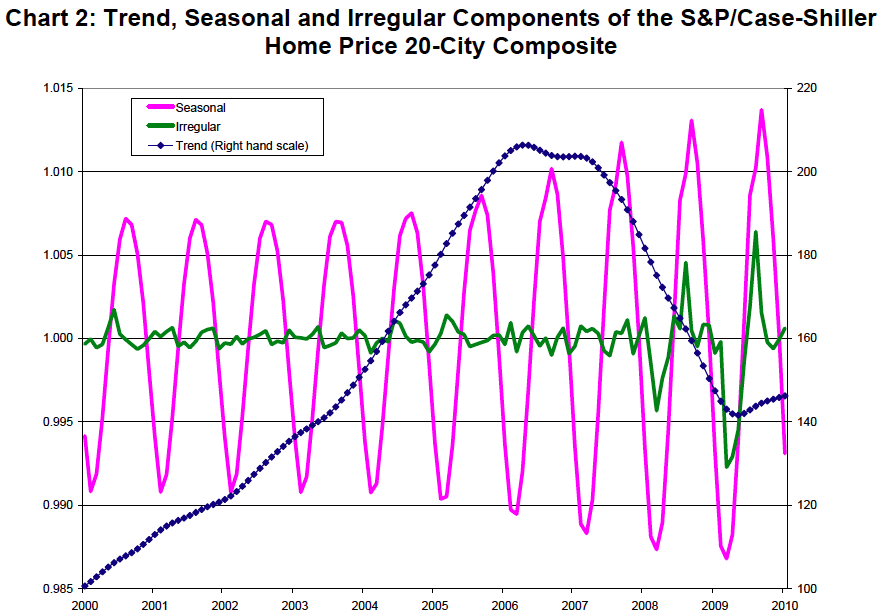
[Seasonality Adjustments] are Confusing and Perhaps, Misleading

April 26, 2010 | 7:30 am |

CSIseasonalchart4-2010
[click to open announcement]

A few years ago, I was thinking about running another set of our market numbers for the NYC metro area as seasonally adjusted since that was prevalent in housing indexes such as NAR, Case Shiller, New Home Sales. However, when I spoke to several economists on how to set out to actually do this, I found there was no real standard and methodologies used were rarely disclosed. I opted not to pursue a conversion.

3-22-14jengaimage

NAR takes their monthly numbers, annualize them and then adjust for seasonality. Seems like stacking Jenga wood blocks. The smaller the base piece, the more volatile the blocks are at the top of the stack.

It felt like the reliability of the data could be diluted as a result. One of the things that happened in the NYC metro market in 2009 – seasonality ran amok post-financial crisis. Contract peak moved forward 90 days for the first time in the 25 years I’ve been tracking the market, from May-June to August-September which will then screw up year over year comparisons.

Apparently that was the feeling of S&P/Case Shiller because the wild swings in housing markets of the past several years skewed seasonality and was confusing the message.

Announcement: S&P/Case-Shiller Home Price Indices and Seasonal Adjustment

I applaud them for making a change which will result in a greater clarity of their trend analysis. Remember, the CSI index wasn’t designed for its popular use as the standard for tracking the US housing market. It was designed to be an index for investors to trade housing related financial instruments. Investors (and consumers) always need greater clarity and its great that they took action.

In some recent reports the two series have given conflicting signals, with the seasonally-adjusted series rising month-over-month and the unadjusted series declining. After reviewing the data, the S&P/Case-Shiller Home Price Index Committee believes that, for the present, the unadjusted series is a more reliable indicator and, thus, reports should focus on the year-over-year changes where seasonal shifts are not a factor. Additionally, if monthly changes are considered, the unadjusted series should be used.

Raw is better. I’m sure there are great applications of seasonality, but let’s keep the black box out of the housing market analysis.


Tags: , ,

Get Weekly Insights and Research

Housing Notes by Jonathan Miller

Receive Jonathan Miller's 'Housing Notes' and get regular market insights, the market report series for Douglas Elliman Real Estate as well as interviews, columns, blog posts and other content.

Follow Jonathan on Twitter

#Housing analyst, #realestate, #appraiser, podcaster/blogger, non-economist, Miller Samuel CEO, family man, maker of snow and lobster fisherman (order varies)
NYC CT Hamptons DC Miami LA Aspen
millersamuel.com/housing-notes
Joined October 2007