Matrix Blog

Posts Tagged ‘Commerce Dept’

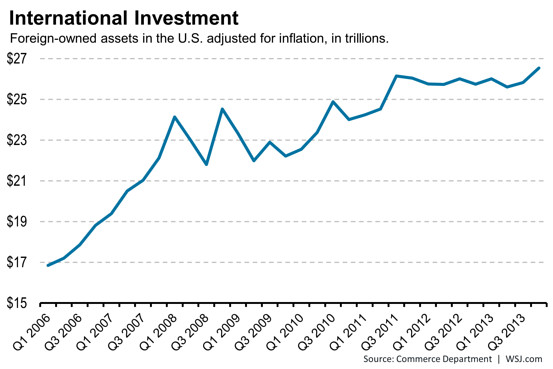
New Record of Foreign-owned Assets in the United States

March 27, 2014 | 4:06 pm | |

3-14commerceForeignInvestors

According to the WSJ Real Time Economics Blog there are the record investment gains. This is good news/bad news…and:

has worried some economists, because it makes the U.S. more vulnerable to major shifts in the global economy. But it also could show strengthening confidence in the American economy.

These gains are largely due to the rising US stock prices rather than more investment. However in the housing sector, I do think rising property values are attracting even more new capital for investment – whether for new development or unit purchases. We can see this in markets like New York City and Miami. Foreign investors seem to be chasing safety and a long term equity play.

Tags: , , ,


[WSJ] Good Overview on 2014 US Housing Expectations – Jed Kolko, Trulia

February 26, 2014 | 12:32 pm | |

Jed Kolko does a nice job summarizing what the general housing market may look like in 2014 after the new home sales report came out today.

My big takeaway was that any housing market improvement will be more affected by local job and income growth rather than the “rebound effect.” This phenomena occurred in markets that were hit hardest by the downturn, yet saw the largest price increases.

I’ve added “rebound effect” to my 2014 phrase list, right after “polar vortex.”

Tags: , , , , , , ,


Housing Starts Drop: Whether the Weather or New Trend?

February 20, 2014 | 12:21 pm | TV, Videos |

Yesterday I did a quick interview for CNBC at 30 Rock (right next to the new Tonight Show/Jimmy Fallon set which was all abuzz). We were talking about housing starts before they were released. While predicting this stuff is a fool’s errand, I think the bigger question was whether the recent weakening of housing metrics was a new trend or a pause caused by the harsh weather creating havoc across the US.

NAHBconf2-14

The NAHB homebuilder sentiment index (1 family) posted its largest one month drop in history – severe weather, cost of labor, materials and land with given as reasons but those really aren’t new issues other than the severe weather.

While weather played a role and probably amounts to more of a short term blip, I think the larger concern is the outlook over the next 6 months with reduced affordability (higher rates but still historically low) and the bottoming of existing home inventory in 2013 providing additional listing competition in some markets.

December housing starts
• 999k annualized and seasonally adjusted rate in December, declining 9.8% but exceeding forecasts. More weakness in multi-family starts than 1-family • +18.3% 2013 over 2012

Why I thought January Housing Starts would fall (luckily I was right with the announcement of a record 16% drop) • Same factors in place as last month: Weather, Labor and Material Costs and Land Costs. • Record m-o-m drop in NAFB confidence – looking out over the coming months – suggests a larger impact by weather. • Mortgage rates slipped from last month but still nearly a point higher than a year ago, expectation of flat or edging higher in 2014. • Implementation of Dodd-Frank Qualified Mortgage (QM) may also drag viewing traffic. • Permits already fell over last 2 months which suggests lower starts (contracts versus closed sales analogy).

Actual January housing starts release after my interview
880K annualized rate in January, dropping 16% from December 2013. • January 2014 y-o-y dropped 2%. • Permits fell for 3rd consecutive month, down 5.4% from prior month (seasonally adjusted).

STILL – the question REALLY is whether the recent construction slowdown is the beginning of a trend or a temporary set back that will clear over the next few months as the weather improves and the economy shows some improvement. Right now it feels more like the market is losing momentum and the weather is only making it worse.

Tags: , , , , , ,


[Commerce Dept] US Housing Starts May 2010

June 17, 2010 | 7:30 am |


[click to expand]

May housing starts, seasonally adjusted, fell sharply with the expiration of the tax credit – signed contract by April 30. No surprises here. I suspect we’ll see similar levels for a few months. The tax credit likely “poached” sales from future months rather than jump start the housing market.

Privately-owned housing starts in May were at a seasonally adjusted annual rate of 593,000. This is 10.0 percent (±10.3%) below the revised April estimate of 659,000, but is 7.8 percent (±9.7%) above the May 2009 rate of 550,000. Single-family housing starts in May were at a rate of 468,000; this is 17.2 percent (±7.9%) below the revised April figure of 565,000. The May rate for units in buildings with five units or more was 112,000.

I’ve long marveled at the stats in this report (sarcasm) – notice the margin of error in the above paragraph. Still, it’s the standard reporting method for new housing starts.

The chart above is intended to provide perspective to any month over month gains. The peak for housing starts was January 2006 at $2.3M annual starts, 3.8 times the seasonally adjusted annualized rate.

NEW RESIDENTIAL CONSTRUCTION IN MAY 2010 [U.S. Department of Commerce]


Tags: ,


[College Degree Sprawl] San Francisco and NYC are Bastions of Smart People

June 2, 2010 | 1:00 am | |

Source: Extraordinary Observations [click to expand]

In a newly discovered blog, Extraordinary Observations by Rob Pitingolo (ht: WSJ/Real Time Economics), I found a refreshing look at a key economic resource: “people” in his post “Where the Smart People Live”.

One of the trends I had observed during the housing boom was a move toward new urbanism. Re-purposed (my favorite new word) commercial buildings in urban centers to residential units and public spaces. It began to feel like urban areas were getting the better of the suburbs and perhaps, in theory, the more upgraded urban markets attracted talent from markets that didn’t adapt to the trend.

Rob’s analysis looked at city and urban density patterns and even “degree sprawl.” Really clever.

It’s becoming increasingly accepted that there is real economic value to bringing a lot of smart and entrepreneurial people together in the same place. This can be tough to measure, unfortunately. Perhaps best proxy we have available is educational attainment – usually measured as the number of people in a particular place with bachelor’s degrees or higher, as reported by the Census Bureau.

Where the Smart People Live [Extraordinary Observations]


Tags: ,


[Not Really Counted] 1.7M Units In Shadow Housing Inventory

December 22, 2009 | 1:04 am | |


[click to open full report]

One of the by-products of the credit crunch has been the rise in shadow inventory. Within my own market stats, I consider shadow inventory all units that are complete or under construction but not yet offered for sale as condos (sometimes as cond-ops or co-ops). In many cases the developer was unable to sell the initial block of units offered and is therefore unable to release the units behind them.

The development stalls because the lender behind the developer usually prevents the units to be converted to rentals because the value of the project would fall considerably as a rental on their balance sheet, causing stress to their capitalization ratio.

The lender’s reluctance to make such a decision is referred to as:

  • pretend and extend
  • pray and delay
  • kick the can down the road
  • a rolling loan gathers no loss

First American CoreLogic tracks shadow inventory. They define shadow inventory as real estate owned (REO) by banks and mortgage companies, as a result of foreclosures and other actions, such as deeds in lieu, as well as real estate that is at least 90 days delinquent. They put the amount of shadow inventory at $1.7M in 3Q 09, up 54.5% from $1.1M a year ago.

Visible inventory, like the amount estimated NAR and Census every month, is estimated at $3.8M, down 19.1% from $4.7M last year.

The total unsold inventory (which combines the visible and pending supply) was 5.5 million units in September 2009, down from 5.7 million a year ago. The total months’ supply was 11.1 months, down from 12.7 a year earlier. This indicates that while the visible months’ supply has decreased and is beginning to approach more normal levels, adding in the pending supply reveals there is still quite a bit of inventory that will impact the housing market for the next few years, especially in the context of the current increase in home sales, which is in part due to artificially low interest rates and the homebuyer tax credit.

In other words, even with the surge in activity over the past several months, total inventory hasn’t changed all that much (I agree with Bob).

Tags: , , , , ,


[New Home Sales] Inventory Falls As Sales Flatten

September 26, 2009 | 12:37 pm |

Here’s a take on the Commerce Department’s New Residential Sales Report released on Friday.

Sales of new one-family houses in August 2009 were at a seasonally adjusted annual rate of 429,000, according to estimates released jointly today by the U.S. Census Bureau and the Department of Housing and Urban Development. This is 0.7 percent (±16.2%) above the revised July rate of 426,000, but is 3.4 percent (±13.3%) below the August 2008 estimate of 444,000.

(gotta love the +/- percentages)

The LA Times provides some additional perspective:

August’s sales pace was 4.3% below the same month a year earlier. Last year ended with 485,000 new homes sold, the worst year for new-home sales since 1982 and the third-worst year since the federal government began tracking the data in 1963. New-home sales peaked in 2005 at 1.23 million units.

Builders also have scaled back construction dramatically, cutting the inventory of new homes to a 7.3-month supply, down 34% from 11.1 months a year earlier. The reduction marks a return to a more normal market: a roughly six-month supply is the historical norm.

As does MarketWatch:

Despite a record drop in prices, sales of new homes flattened out in August after four months of strong increases, the Commerce Department estimated Friday. Sales of new homes rose a statistically insignificant 0.7% in August to a seasonally adjusted annual rate of 429,000 from a downwardly revised 426,000 in July, which was previously reported as 433,000. Sales were down 3.4% from a year earlier, but were up 30% from the low in January. Through the first eight months of 2009, sales were down 28% compared with the same period a year ago.

Bottom line is that new construction is competing with rising foreclosures and faces significant challenges with financing availability. New home sales data doesn’t include contract rescissions either so I have always felt it is very inconsistent (a lot more positive) than national home builders actual numbers.


Tags: ,


[New Home Sales] Up 9.6% – New Is Better Too?

August 27, 2009 | 1:40 pm | |

Here’s the meat from the commerce department’s July new residential sales report released yesterday.

Sales of new one-family houses in July 2009 were at a seasonally adjusted annual rate of 433,000, according to estimates released jointly today by the U.S. Census Bureau and the Department of Housing and Urban Development. This is 9.6 percent (±13.4%)* above the revised June rate of 395,000, but is 13.4 percent (±12.9%) below the July 2008 estimate of 500,000. The median sales price of new houses sold in July 2009 was $210,100; the average sales price was $269,200. The seasonally adjusted estimate of new houses for sale at the end of July was 271,000. This represents a supply of 7.5 months at the current sales rate.

Inventory has fallen to 7.5 months from 12.4 months earlier this year because builders simply aren’t building. The general thinking is that the tax credit and low rates have helped move properties more than they would have otherwise. However, distressed property sales are now competing with new construction and credit remains tight.

The number of new properties available for sale is the lowest it has been since 1993.

Sales picked up in three out of the nation’s four geographic areas, with a sizeable gain of 16.2 percent in the South, the nation’s largest-selling region, which includes the Washington area. Sales fell only in the Midwest, by 7.6 percent.


Tags: , ,


[HuffPost] Current Wave of Housing Euphoria May Extend Downturn

July 30, 2009 | 3:02 pm | | Columns |

Here is my latest handiwork for the Huffington Post.

Current Wave of Housing Euphoria May Extend Downturn

The article is below in full if you don’t want to click on the link:

Current Wave of Housing Euphoria May Extend Downturn
Jonathan Miller 7-30-09


The spring housing market is behind us and we are now fully ensconced in summer, able to sit at the beach, sip our drink and watch the waves roll in.

Waves of housing statistics that is.

Seemingly everyone from the consumer to the POTUS has been waiting for a rogue wave that will finally bring some good news on housing. In fact most of us are aching from bad news overload and desperately want good news or at least a temporary reprieve from the bad.

Like the closing scene from the 1973 movie Papillion where Steve McQueen’s character–when trying to escape from the island–determined that every seventh wave was big enough to enable him to float past the rip currents that surrounded the island.

The monthly gauntlet of key housing market reports from the past week show a rising tide of better-than-we-have-heard-in-three-years-news on the state of US housing market.

Here’s a recap:

July 22, 2009 Federal Housing Finance Agency news release headline: “U.S. Monthly House Price Index Estimates 0.9 Percent Price Increase from April to May.” This report reflects sales with conforming mortgages through Fannie Mae and Freddie Mac at or below $417,000 plus the high priced housing markets such as the New York City area that have a $729,750 mortgage cap. Housing markets that rely on conforming mortgages are expected to recover first because the that mortgage market has been the target of recent federal stimulus and bailouts. However the month over month price increase of 0.9% touted in the report headline is the first such increase since February. Although 5 of the 9 regions show a month over month increase in prices only 1 of those 5 regions had an increase in the prior month. In other words, this trend is not very compelling.

July 23, 2009 National Association of Realtors Existing Home Sales report headline: “Existing-Home Sales Up Again” The number of re-sale increased 3.6% in June from May, the third month over month increase in activity. The number of sales was only 0.2% below the level of last year’s activity in the same month. This was largely due the 31% market share of foreclosures, assumed to be purchased by speculators plus the impact of the federal tax credit for first time buyers which expires at the end of November. However, this seasonally adjusted sales 3-peat was also seen at the end of 2006 and the beginning of 2007 before sales activity fell sharply. In other words, this trend is not very compelling.

July 27, 2009 Commerce Department New Home Sale Index headline: “New Residential Sales in June 2009.” This is the report that got everyone excited because of the 11% increase in new home sales month over month and the largest such increase in 8 years. Floyd Norris of the New York Times points out that if you look at the actual number of sales in June, it was the second lowest month of sales on record since the metric was tracked in 1963. In other words, this trend is not very compelling.

July 28, 2009 S&P/Case-Shiller Index “Home Price Declines Continue to Abate.” The 20-City Composite has shown a lower annual rate of decline for 4 consecutive months and 13 of the 20 metro areas posted month over month increases but this is before seasonality is adjusted for. In other words, we expect prices to rise in the spring if they are going to rise at any point during the year. If seasonality is factored in, month over month gains evaporate. In the New York City region, the 20-city composite index doesn’t cover co-ops, condos, foreclosures and new development, more than half the sales activity. In other words, this trend is not very compelling especially after considering that along with the most recent month in the report, the index has declined year over year for 29 straight months.

In a stroke of irony, big media, which was on the receiving end of the real estate industry’s “blaming the media” ire for the past three years–as responsible for making the downturn worse–has taken the positive outlook and run with it. Nearly every major news outlet has begun to report each of these reports by cherry-picking and overweighting the positive elements results in a downright giddy tone. Over the past week, the general sentiment in news coverage is clearly moving towards the positive but mainly confined to the headlines.


As a reporter once told me (and I am paraphrasing) “Negative news only sells for so long – consumers eventually stop reading it as they become become numb to it.”
Perhaps this is best exemplified by yesterday’s kind of thin New York Times page 1 story on housing:

“3-Year Descent in Home Prices Appears At End.”

This was the headline that put me off a bit since the article itself wasn’t very committal to the notion that the housing market has bottomed. Perhaps this is why the web version of the article was titled with a more sedate headline that was more in sync with my view:

“Recovery Signs in Housing Market Stir Some Hope.”

Step back for a second and ask why would the housing market start to improve now to lead the economy?

If more people are losing their jobs and credit remains tight, how can we expect the number of sales and housing prices to over come this. Unemployment is still rising and is expected to continue rising through next year even though the recession could be over right now or close to it. Housing inventory is still high and the number of sales, exclusive of distressed asset sales is still low. Speculators may be on their way to becoming a force again in the market. Mortgage rates are expected to trend higher over the next few years with all the new debt taken on by the federal government. Credit is still very tight, and while there has been some discussion of loosening in mortgage underwriting, banks still aren’t enthusiastic about lending. There appears to be some easing on conforming mortgage underwriting but a chokehold remains on jumbo and new development financing.

Here’s the problem.

Sellers tend to “chase” the market when it is falling, unable to respond to the decline in values as quickly as the market does. If sellers take this positive news too seriously and don’t focus on the realities of their local markets, they may end up being over confident when negotiating a sale, losing the buyer and falling even further behind the market than they would have otherwise, eventually selling for less.

Luxury condo developers and especially the lenders behind them, many of whom are facing stalled projects, could experience a sense of renewed optimism from the recent depiction of the housing market, causing them to miss the market, eventually realizing a larger loss.

So let’s be clear. While I am hopeful that we will see a housing recovery at some point in the future, I’d rather it be real.

In the meantime, I’ll sit at the beach and count the waves.


Tags: , , , , , , , ,


[Repetition Watch] New Home Sales Up

July 27, 2009 | 12:36 pm | |

US Census Bureau and HUD released their June 2009 New Residential Sales (New Home Sales) today and the news is generally positive, exceeding expectations but upon further analysis, doesn’t mean much yet and also confirms how weak the upper end is:

Number of sales

Sales of new one-family houses in June 2009 were at a seasonally adjusted annual rate of 384,000, according to estimates released jointly today by the U.S. Census Bureau and the Department of Housing and Urban Development. This is 11.0 percent (±13.2%)* above the revised May rate of 346,000, but is 21.3 percent (±11.4%) below the June 2008 estimate of 488,000.

Prices

The median sales price of new houses sold in June 2009 was $206,200; the average sales price was $276,900. The seasonally adjusted estimate of new houses for sale at the end of June was 281,000. This represents a supply of 8.8 months at the current sales rate.

Inventory is down 4.1% from last month and 35.6% from June 2008.

The high end market share is getting hammered though.

In June 2008, 4.4% of new home sales were higher than $750,000 In June 2009, 2.8% of new home sales were higher than $750,000

The 2009 figure is much weaker than that considering overall new sales have fallen 21.3% over the same period possibly bringing many of the 2008 $750,000+ sales below the $750,000 threshold.

It’s all about new construction and jumbo credit.

UPDATE: Floyd Norris says this is the worst new home sale results by far since the metric was first tracked in 1963.


Tags: ,


[Vortex] Straight from MacCrate: When Will Real Estate Prices Stabilize in the New York Metropolitan Area?

May 17, 2009 | 10:14 pm | |

Guest Appraiser Columnist:
Jim MacCrate, MAI, CRE, ASA
MacCrate Associates
Appraisal & Valuation Issues Blog

Jim has worn many hats including a Director at PricewaterhouseCoopers in New York City and Chief Appraiser at European American Bank. He is a prolific writer on valuation issues and teaches a number of the real estate appraisal classes through the Appraisal Institute and New York University. I have had the pleasure of taking a number of courses taught by Jim.
…Jonathan Miller

Many so called real estate experts have been predicting the bottom to the real estate market will occur in late 2009 or early 2010. No one can predict with any degree of accuracy the future, much less the bottom of the real estate market in any metropolitan area. It is important for real estate professionals to remember that real estate markets vary by location. Some markets will do well while others are doing poorly. For example, the Detroit real estate market was depressed long before the recession was declared official by the federal government and the beginning of the decline in the New York real estate market. The real estate market in the New York metropolitan area has been driven low interest rates and by the growth of the financial, insurance, and real estate sectors of the economy which began in earnest in first quarter of 2004 as indicated in the following chart:

Total employment is now falling with the FIRE and construction sectors of economy taking a big hit in employment beginning with the collapse of Lehman Brothers. Real estate salespeople, brokers, and appraisers must stop listening to the noise from Washington, D.C., politicians, and others who have mislead us in the past. What we are witnessing, the economists and politicians have witnessed this before during the late 1920’s, the late 1950’s and early 1970’s. In order to properly value real estate, one must cut out all the outside noise and analyze carefully what the local real estate market data is telling you.

On a Macro Basis the Indicators are all Negative

The recent indicators reported by the government suggest that the economy is improving because the rate of unemployment is declining, consumer confidence is improving, the rate of decline in manufacturing is subsiding, etc. All of the above and other statistics still suggests that economy is not improving and real estate values will not begin to rebound until the economy turns over and employment begins to increase with an increasing payroll income and wealth. That is not bound to happen for awhile.

In the New York Metropolitan area, the leading indicators for increasing real property values are all declining, including the following:

  • Population is stabilized or falling
  • Number of households has stabilized or is declining
  • Total employment is declining
  • Total payroll/income is declining
  • Consumer confidence is negative
  • Businesses are still contracting including manufacturing, retail and the financial services sectors of the economy.

The results of the 2010 Census should be interesting nationwide. Listen to what the leading indicators are telling you about the macro market.

Now, on a Micro Basis

Real estate is fixed and immobile. The value of real property is driven by local indicators which impact the demand for real estate in a specific location. All the macro indicators referred to above are also negative in the New York Metropolitan area. In order to determine if the real estate market is rebounding versus stabilizing at a much lower level of activity and prices, the following factors should be analyzed carefully in addition to the factors that generate demand:

  • Sale price trends
  • Increase/decrease in the number of sales
  • Increase/decrease in the number of listings for sale
  • Increase/decrease in the number of days on market
  • Increase/decrease in sales concessions
  • Response to for sale or for lease advertisements
  • Increase/decrease in the number of foreclosures
  • Increase/decrease in the number of loan defaults.

These trends are extremely important to watch, but the trends will not reverse until consumer confidence is positive and total payroll/income, employment and the number of households is increasing. It must be remembered that real estate prices remained depressed for several years after the recessions of the 1970’s and 1980’s. Why should this time be any different, and, in fact, it is already worse in many markets.


Tags: , , , , , ,


[Pretty Vacant] Shoots of Green Are Blossoming In The Metaphor Business

April 13, 2009 | 12:57 am | |

The weather is improving and I’m feeling the “this time of year optimism” where we get out of our log cabins after a long cold winter and admire the greenery around us.

The first thing you notice is that 1 in 9 houses in the US are currently pretty vacant:

According to an article today in USAToday, census numbers show:

  • More than 14 million housing units are vacant. That number does not include an estimated 4.8 million seasonal or vacation homes, most of which are occupied part of the year. The combined vacancy rate of almost 15% is higher than during previous recessions: 11% in 1991 and 9.4% in 1984.
  • About 3% of owned homes are vacant. In normal times, “maybe 1% should be vacant,” Myers says.
  • More than 9% of homes built since 2000 are vacant compared with about 2% for older homes.
  • Homes priced at $500,000 or more are just as likely to be empty as homes that cost less than $100,000.

But the spring metaphor favorite is Shoots of Green or simply Green Shoots.

Here are some warnings about its use:

Caroline Baum at Bloomberg, one of my favorite economic columnists said in her Wall Street Swaps Zegna for Denim, Tool Belts piece:

Like crocuses poking their heads through the soil, straining toward the sun, the U.S. economy is sending out the slenderest of shoots.

Justin Lahart at WSJ, in his Fed Chairman Chauncey Gardiner: You Must Believe In Spring

The combination of signs that the economy may have begun to recover and the arrival of spring has led to the overuse of a metaphor that could use a little pruning. We’re talking about those “green shoots” (sometimes “shoots of green”) that keep showing up in policymakers’ speeches, economists’ notes and, unfortunately, reporters’ stories.

But more mundane, weed-like uses on the presentation of economic news are more like these (no offense meant to the authors):

Manufacturing, Retail Reports May Disappoint:

As economy-watchers everywhere continue their desperate search for green shoots — little signs that the recession won’t last too much longer — this week could bring some sobering news.

The shoots of recovery look pale green at best:

We have former Tory Chancellor Norman Lamont to thank for the term “green shoots” to describe the first signs of a post-recession return to growth. In the depths of the last downturn, in December 1991, he told a Tory party conference: “The green shoots of economic recovery are appearing once again” – only to be greeted with ridicule and contempt.

Dallas Fed chief points to ‘green shoots’: A few signs of life are sprouting in the U.S. economy, but it’s too soon to say whether these “green shoots” will lead to a sustained recovery, said Richard W. Fisher, president and chief executive of the Federal Reserve Bank of Dallas.

Green shoots and tea leaves

One is that even in the Great Depression, things didn’t head down all the time. The chart above, from Eichengreen and O’Rourke, shows world industrial production in months from the previous peak, in the Depression and in the current crisis. Notice that there were several upturns along the way; each of those could have been — and was! — heralded as the beginning of recovery.

I’m thinking a Green Jacket is even better than a Green Shoot – or shooting on the Green is better than being green with a regular jacket on.

Shoot!


Tags: ,

Get Weekly Insights and Research

Housing Notes by Jonathan Miller

Receive Jonathan Miller's 'Housing Notes' and get regular market insights, the market report series for Douglas Elliman Real Estate as well as interviews, columns, blog posts and other content.

Follow Jonathan on Twitter

#Housing analyst, #realestate, #appraiser, podcaster/blogger, non-economist, Miller Samuel CEO, family man, maker of snow and lobster fisherman (order varies)
NYC CT Hamptons DC Miami LA Aspen
millersamuel.com/housing-notes
Joined October 2007