Agricultural Land versus Manhattan Parking Per Acre

March 26, 2017 | 8:19 pm | Infographics |

Well here’s a first for me.

Our Manhattan parking stats were compared with the average value per acre of agricultural land in FarmLife magazine.

In 25 years, the cost of an acre of agriculture farmland rose 309% while a Manhattan parking space rose 855% over the same period. Cost? $7,700 per acre for California agricultural land versus $55.5 million per acre for a Manhattan parking spot.

Gotta love this comparison.


UPDATE A colleague pointed out that we don’t know how large the average farmland was or whether it had reasonable access to water and electricity. I pointed out that Manhattan parking spaces don’t have electric and water service and seem to be about 100 feet from the elevator. LOL.

Tags: , ,


“Kleptocracy Initiative” to Stop Money Laundering in Real Estate up for Renewal

January 23, 2017 | 9:03 am | Infographics |

Almost two years ago the real estate new development world was rocked by the New York Times epic page one story by Louise Story and Stephanie Saul about foreign investment in U.S. real estate. The vehicle for “Towers of Secrecy” purchases was the ubiquitous LLC shell corporation. While I’m no advocate of illegal activity for the sake of preserving the health of a real estate market, I was very skeptical and outspoken about the challenge of measuring the impact of this new rule. Especially since the new development market had already started to show signs of over supply by mid 2014 in both Manhattan above $3M and Miami above $1M. It also seemed to single out wealthy buyers who did not want to get a mortgage. How could the effectiveness of this six month rule be measured reliably enough to be extended or made permanent when the market was already falling?

Since these series of articles came out, I have learned a lot more about the scale of kleptocracy around the world and more appreciative of what the rule attempted to accomplish.

MHjmkleptocracycallout

Fast forward to 2017 and the super lux (≥$5M) new development condo market cooled sharply. The rule has been extended but is now up for renewal in a month. It is not clear whether the new administration will renew it. Nicholas Nehamas of the Miami Herald penned are great recap of the rule status. To make it even better, he included a YouTube video of bulldozers playing chicken in the piece.

I have to say I admire the messaging that came out of Homeland Security to justify the rule’s impact. Whether or not the following is an exageration, the mere existance of the rule is probably an effective deterent.

“We don’t come across [money laundering in real estate] once every 10 or 12 cases,” said John Tobon, U.S. Homeland Security Investigations Deputy Special Agent in Charge for South Florida. “We come across real estate being purchased with illicit funds once every other case.”

Here are the areas current covered by the Treasury rule.

MHfingencoverage

Using the parameters of the rule, the Miami Herald asked that I analyze sales in the five boroughs of NYC since enactment.  I stuck with condos and 1-3 families since co-ops tend not be a preferred property type of foreign buyers. I found that sales dropped 6% year over year for the aggregate of Manhattan sales over $3M and the outer borough sales of $1.5M. This included legacy contracts that closed during the rule enactment period but went to contract before it started. Those sales likely softened the actual decline in sales.

MHsalessinceFinGen

While it appears reasonable that the rule had some drag on demand, a possible repeal in February won’t likely have much of an impact on the oversupply that currently exists.

Tags: , , , ,


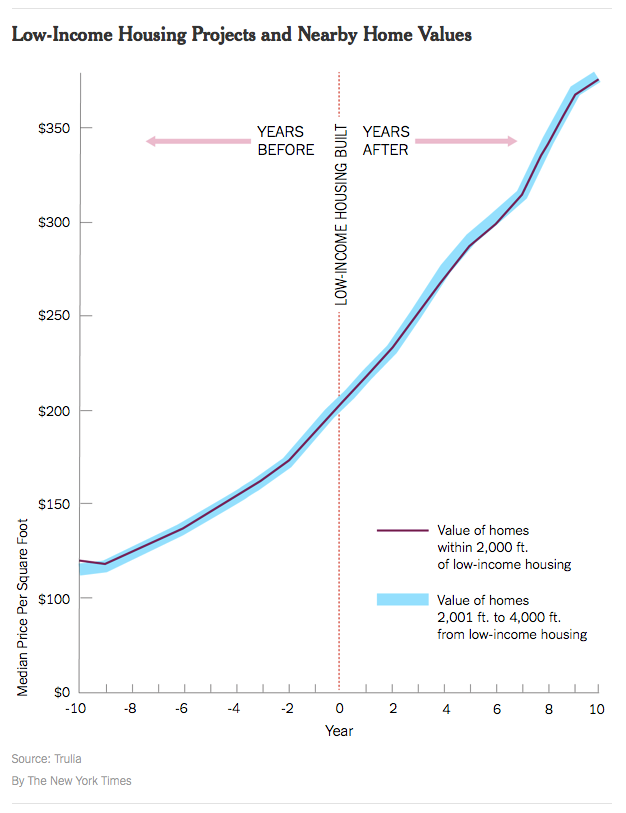
YIMBY: Low-Income Housing

November 25, 2016 | 2:02 pm | | Infographics |

lowincomevvaluetrulianyt

The YIMBY (Yes-In-My-Backyard) movement is fairly new.

In the United States, early leaders of the YIMBY movement include Sonja Trauss in San Francisco and Nikolai Fedak in New York. The first ever Yes In My Backyard conference was held in Boulder, Colorado, in June 2016.

Nikolai has done an amazing job at chronicling the explosion of new development in NYC over the past several years with his must read web site New York YIMBY.

One of the misconceptions with the NIMBY movement which is largely the opposite of YIMBY is the idea/rule of thumb that low-income housing always drags down property values of nearby properties. In an era challenged by the lack of any type of affordable housing, this makes a bad situation worse.

According to this recent research by Trulia (FYI – I was part of their industry advisory board from 2006-2014), and notably in aggregate form, the impact seems to be non-existent in the majority of the markets covered. One can’t conclude there is no impact as a general rule but it does show that should not be the default assumption.

The above infographic is from this Weekend’s New York Times’ real estate section column called ‘Calculator’ – Low-Income Housing: Why Not in My Neighborhood?. The methodology used in the Trulia research was the following:

To measure this, Trulia compared the median price per square foot of nearby homes (within 2,000 feet of low-income housing) with that of homes farther away (2,001 to 4,000 feet) over 20 years, starting 10 years before the low-income housing was built and ending 10 years after.

Tags: , , , ,


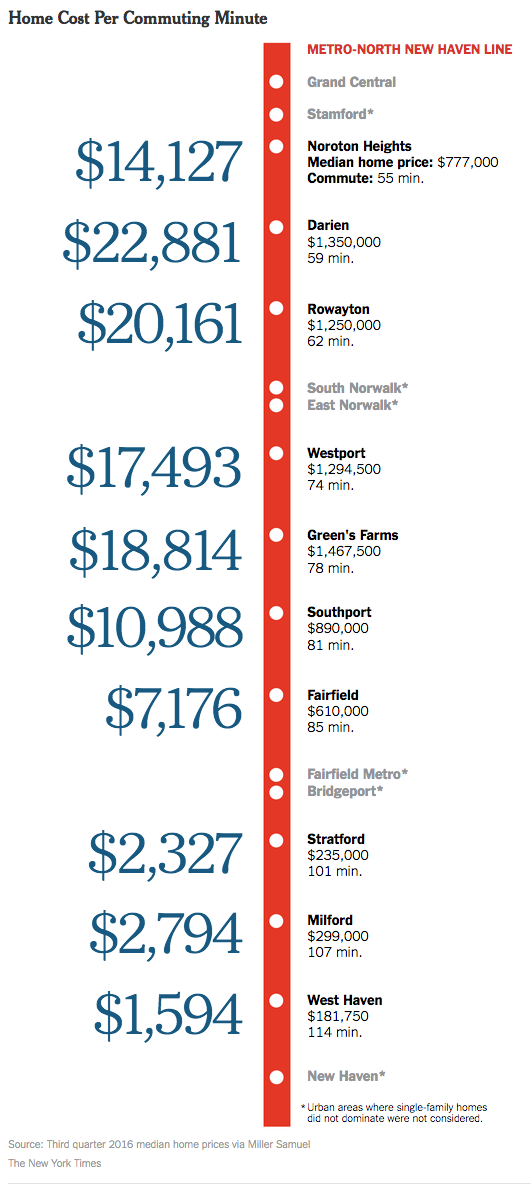
The Relationship Between Commute Time and Housing Prices

October 28, 2016 | 3:48 pm | | Infographics |

Back in the mid 1990s after my wife and I moved to Fairfield County, Connecticut from Manhattan, I noticed the decline in housing prices further from the first express stop in Stamford, CT.

I worked on an updated version of the concept for this weekend’s New York Times Real Estate section: What’s Your Commute Time Worth? They did an amazing job on the graphic.

nytimesmetro-northcommute3q16

Tags: , , , , ,


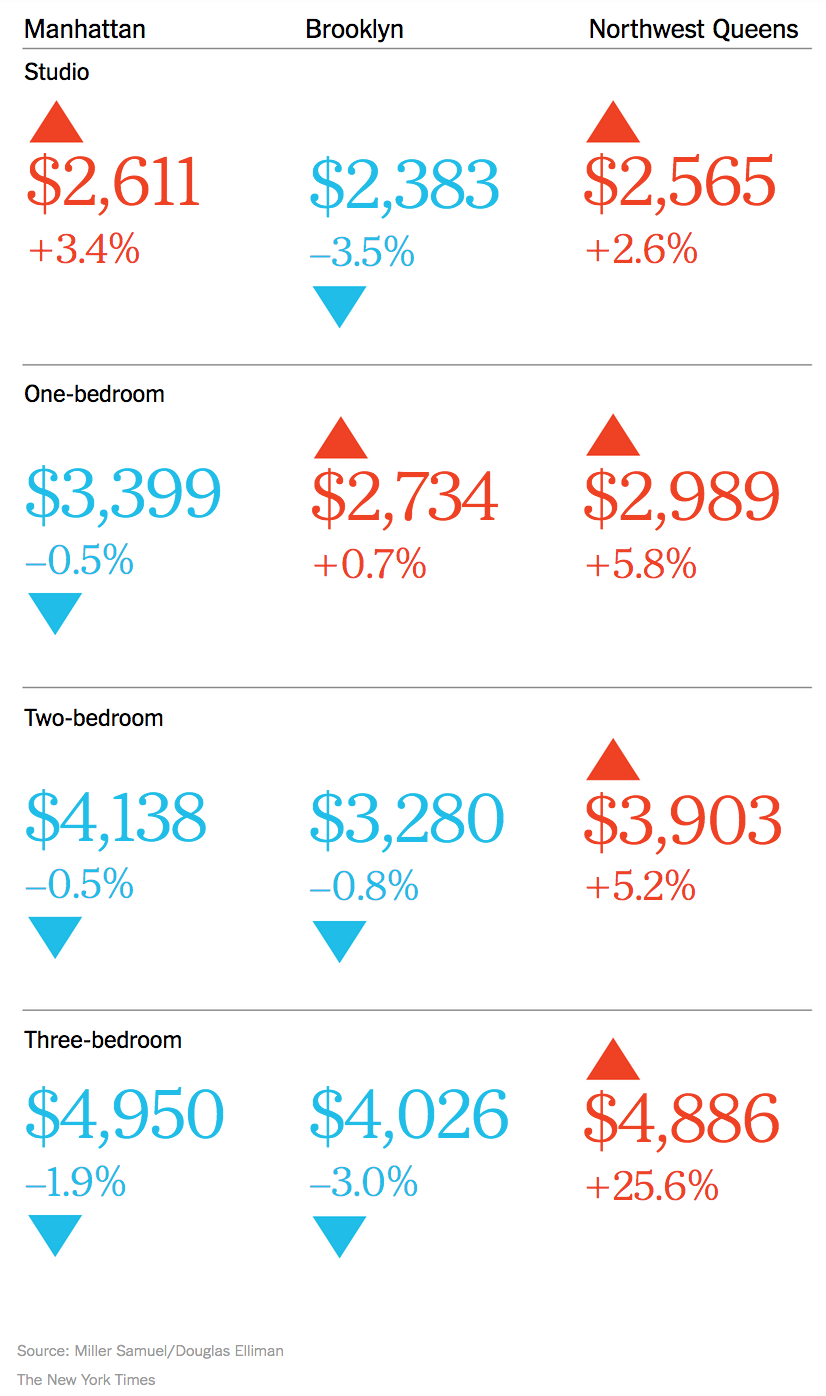
NYT Real Estate Calculator: NYC Rents Go Graphic

October 9, 2016 | 8:49 am | | Infographics |

I’m liking the new goodies in the New York Times real estate section, especially this week, and not because the most recent market report on the Manhattan, Brooklyn and Queens rental market for Douglas Elliman was featured.  No, really.

See for yourself.


nytcalculator10-9-2016rents

Tags: ,


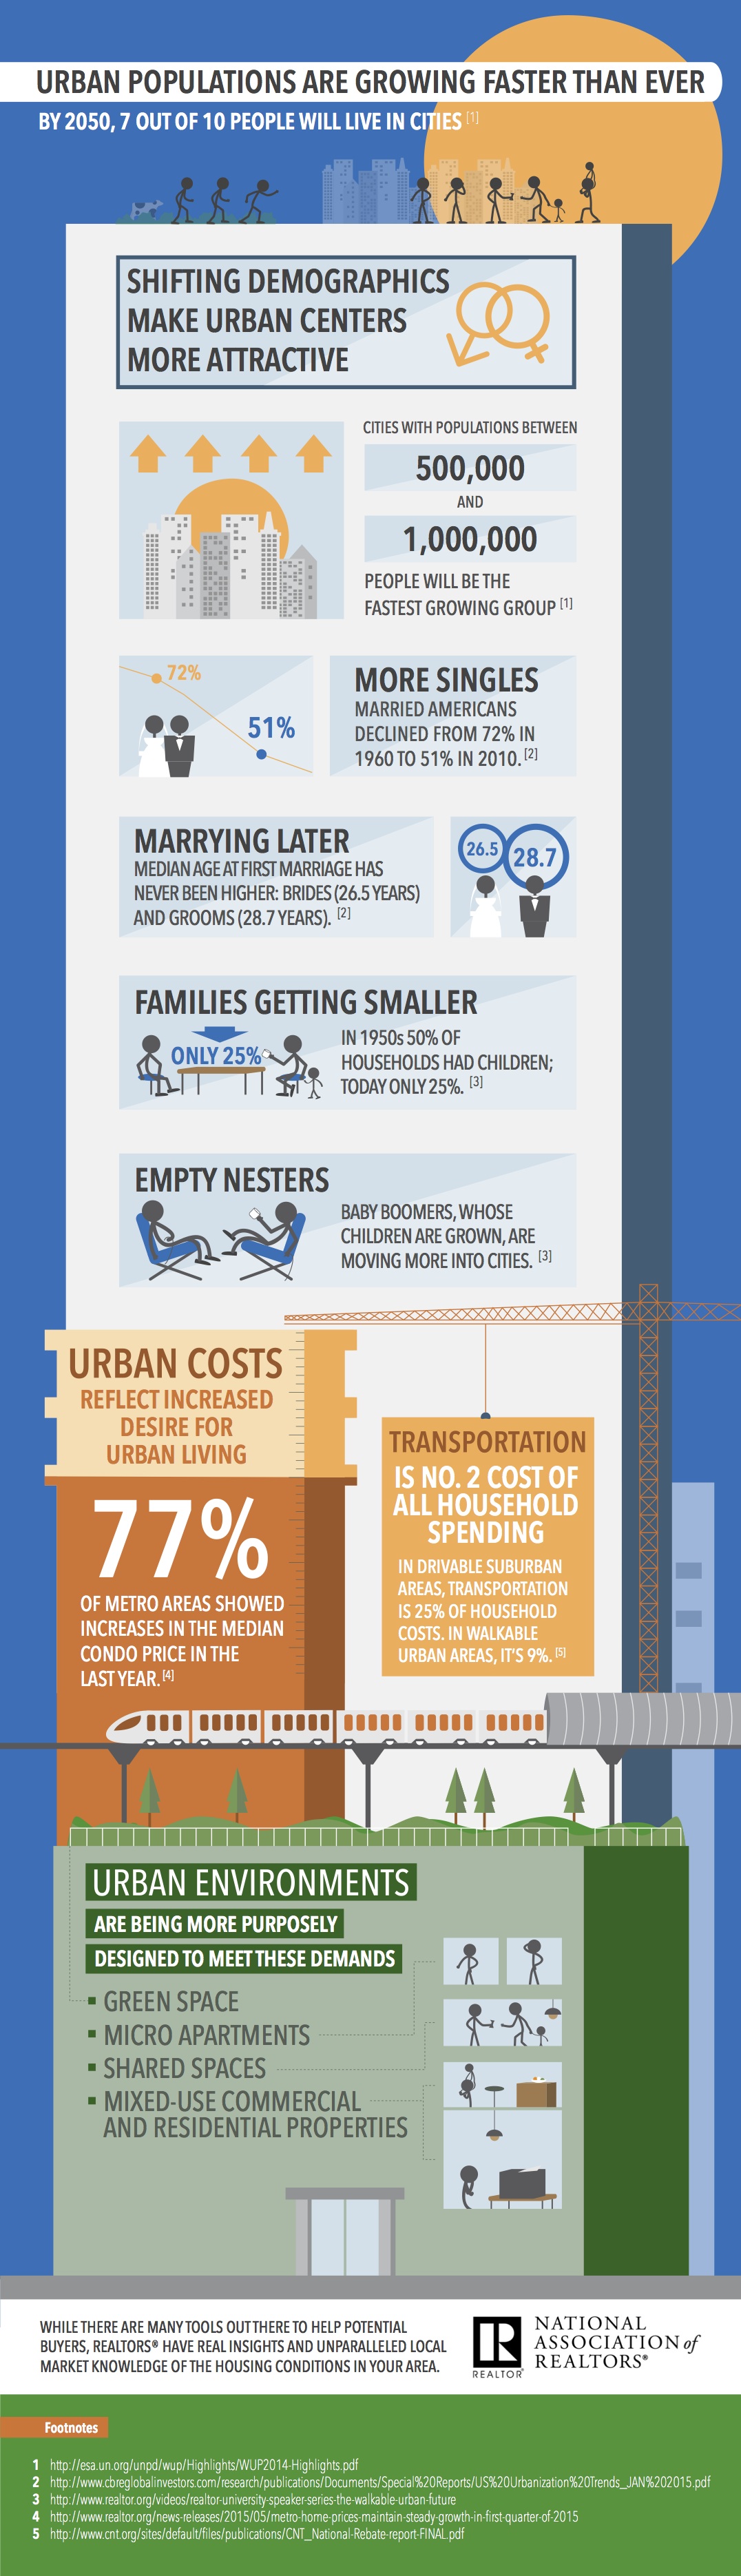
[Infographic] NAR gets into the Urbanization Conversation

September 1, 2015 | 10:12 am | | Infographics |

The National Association of Realtors, who is generally viewed as emphasizing suburban single family housing markets, may be plotting a new course. NAR will be sharing more releases on the topic of urbanization in the coming months. They look to be taking the same path as Realtor.com, the online entity who licenses their name from the NAR mothership. Realtor.com has cleaned up their act and has been much more focused on city life after their recent purchase by News Corp (through Realtor.com’s parent company Move), trying to become relevant again by emulating Zillow and Trulia. And of course, the consumer wins.

It’s a good thing too since urbanization is one of the most important housing trends (affordability aside) facing the housing market going forward.

Here’s an interesting infographic released by NAR today:

NARurbanismInfographic

Tags: , , , , , ,


Infographic: 25 Year Demise of the Bank Appraisal Industry and the Rise of AMCs

May 31, 2015 | 8:05 pm | Infographics |

appraisalslipperyslopebanner
[click to expand]

I thought I’d build a visual representation of the decline of the appraisal industry – sort a flow chart, but really an excuse to use different colored shapes and sizes. This is a work in progress so please feel free to let me know what I’ve missed, which presumably is an infinite amount of detail.

Open the timeline as pdf.

UPDATE – Fixed a few typos and grammar weirdness in graphic.

Tags: , , , , ,


Bloomberg View Column: What Does It Mean When a House Sells for $50 Million?

September 17, 2014 | 2:58 pm | | Articles |

BVlogo

Read my latest Bloomberg View column What Does It Mean When a House Sells for $50 Million?. Please join the conversation over at Bloomberg View. Here’s an excerpt…

One of the byproducts of the global financial crisis has been the creation of a new class of housing and buyers. Some of the strongest evidence is the rise in the number of residences sold for more than $50 million. A buyer recently paid a record $71.3 million for a Manhattan co-op, breaking the $70 million record set only a few months earlier. These sales seem modest compared with a $147 million sale in East Hampton, New York, and a $120 million sale in Greenwich, Connecticut, the two highest U.S. residential transactions in 2014. There have been six sales of more than $100 million in the past four years, with more likely to come…

[read more]

BV9-17-14$50Mtable
[click to expand]


My Bloomberg View Column Directory

My Bloomberg View RSS feed.


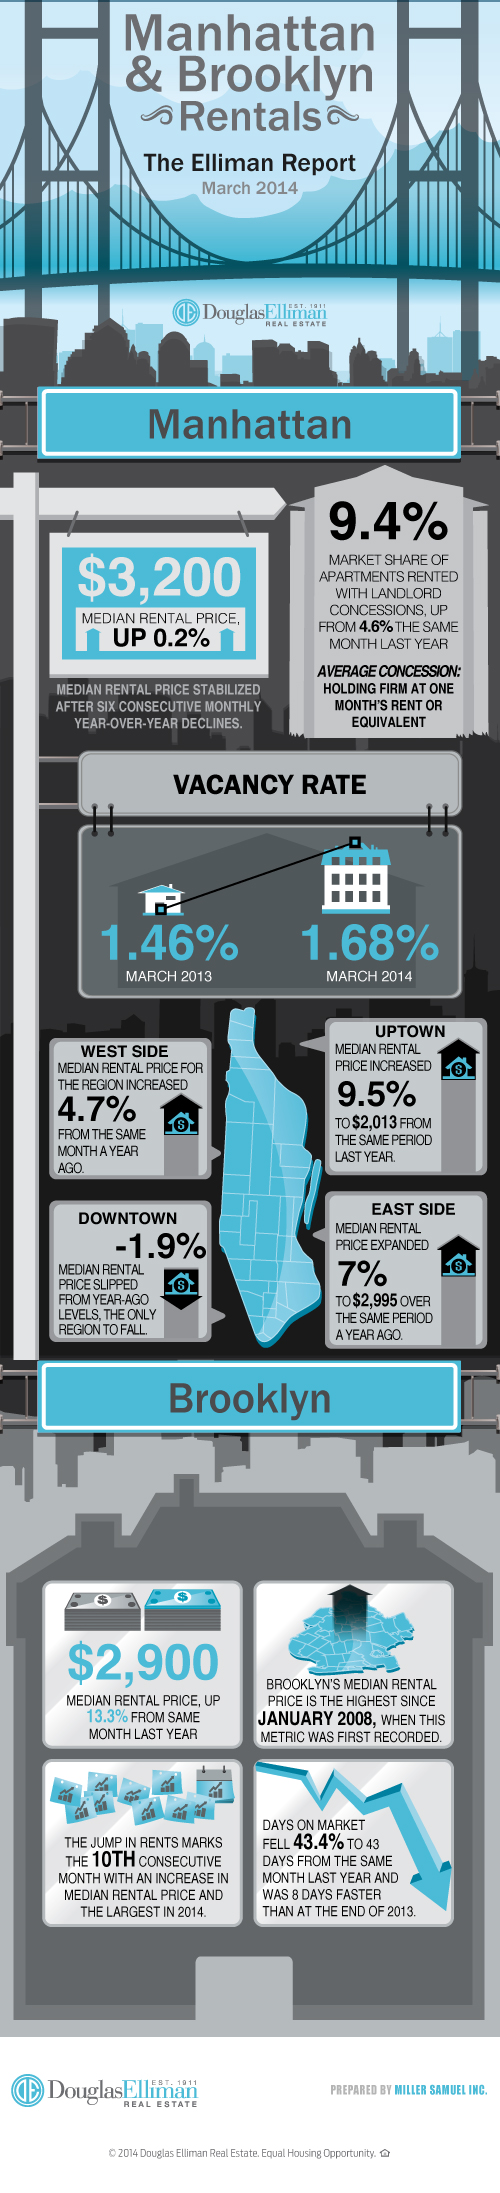
[Infographic] Manhattan and Brooklyn Rents Continue to Rise

May 17, 2014 | 8:55 pm | | Infographics |

Here’s the latest infographic from Douglas Elliman covering the Manhattan & Brooklyn rental market reports for April 2014.

April2014 Manhattan Brooklyn Rentals


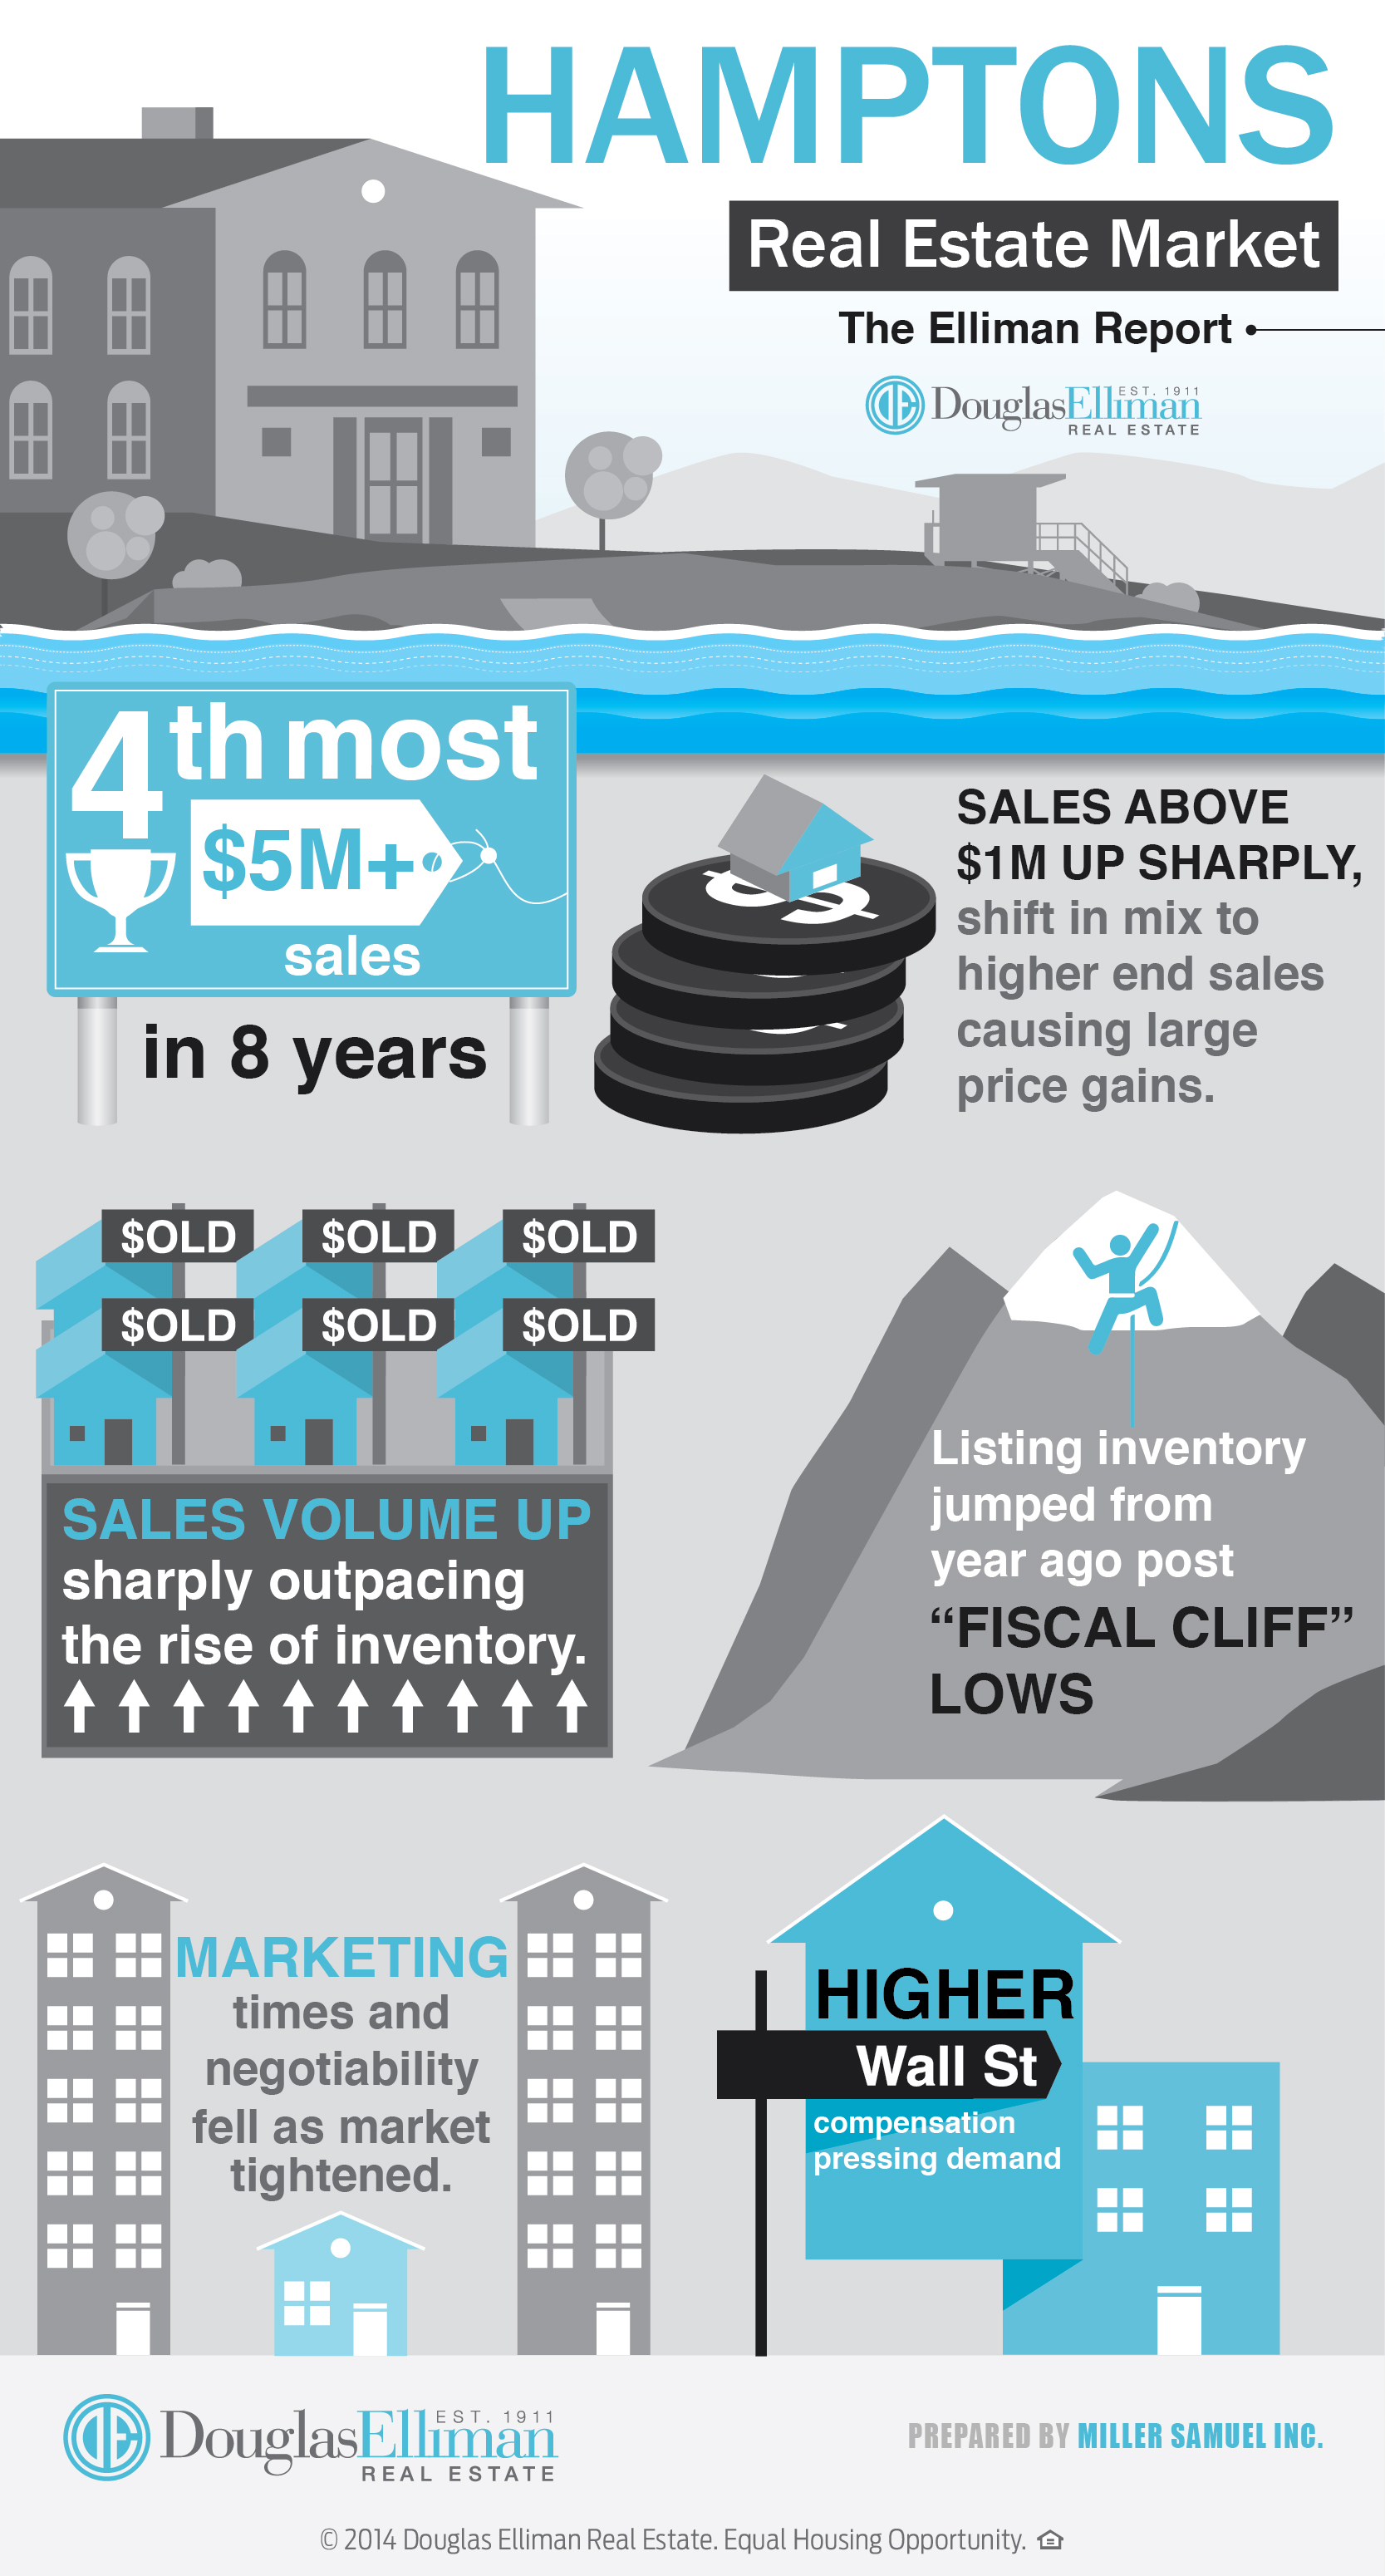
[Infographic] 1Q14 Hamptons Snaps Back from Fiscal Cliff Lull

April 24, 2014 | 12:34 pm | | Infographics |

Douglas Elliman created another infographic for the Elliman Report series. This time it covers the 1Q14 Hamptons Sales Report that we author.

1q14infographicelliman-hamptons


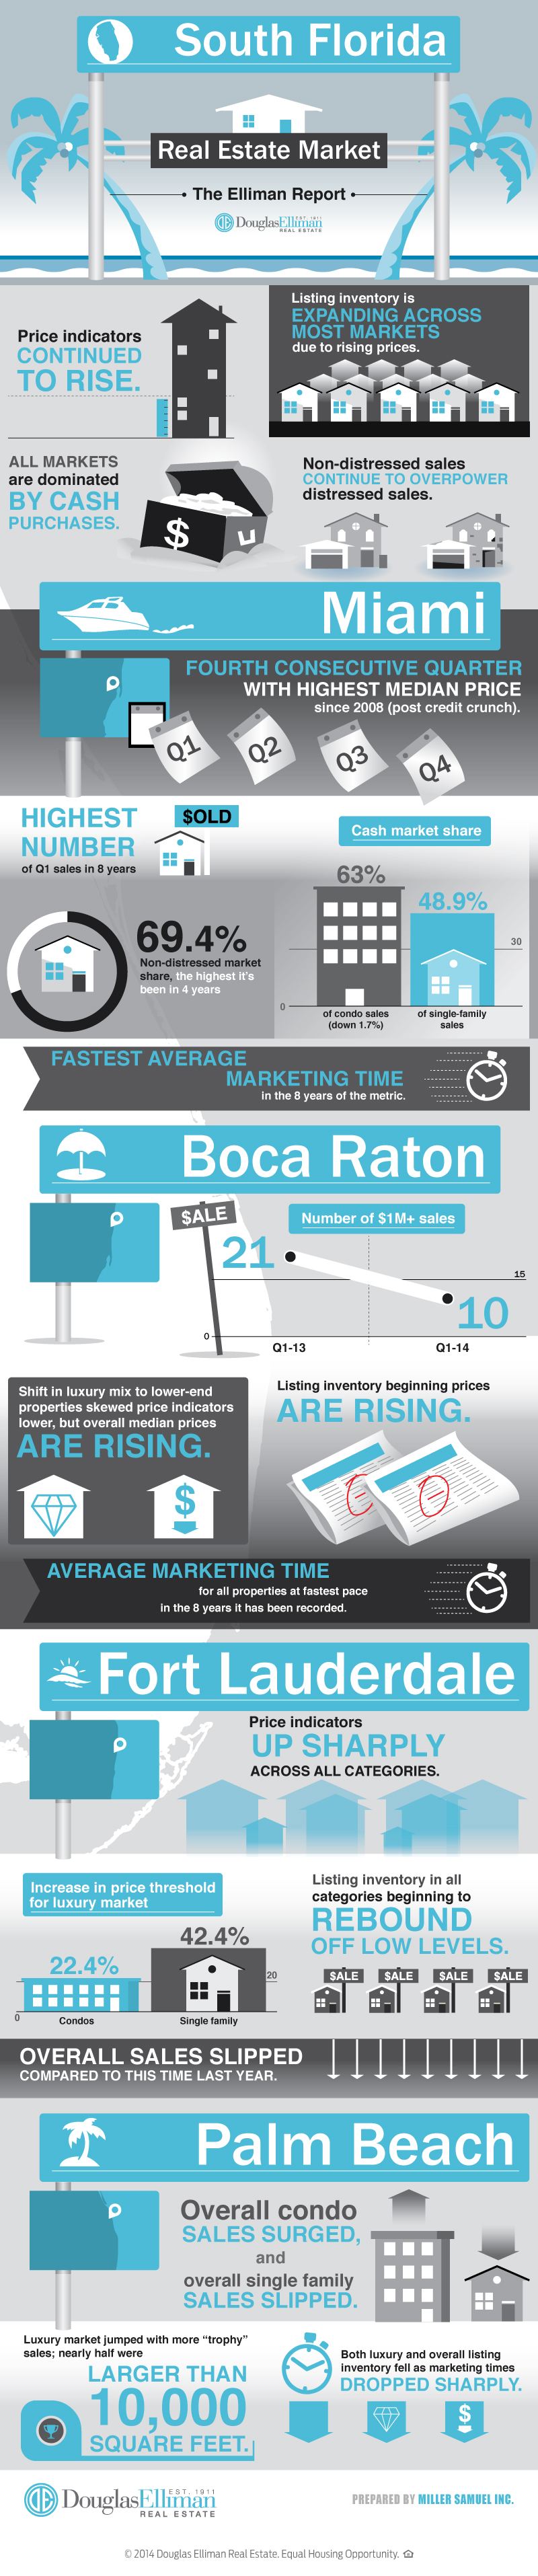
[Infographic] Getting Graphic in South Florida in 1Q 2014

April 18, 2014 | 4:30 pm | | Infographics |

Here’s a jumbo infographic from Douglas Elliman covering the findings of the four market reports in South Florida we prepare for them. Thank goodness Matrix can handle super tall images.

1q14infographicelliman-florida


[Infographic] Looking at the Manhattan and Brooklyn Rental Markets 3-2014

April 10, 2014 | 12:00 pm | | Infographics |

Entering the world of infographics, here are some highlights from our just released Elliman Report: Manhattan & Brooklyn Rentals 3-2014

ManhattanBrooklyn3-14INFOGRAPHIC

Get Weekly Insights and Research

Housing Notes by Jonathan Miller

Receive Jonathan Miller's 'Housing Notes' and get regular market insights, the market report series for Douglas Elliman Real Estate as well as interviews, columns, blog posts and other content.

Follow Jonathan on Twitter

#Housing analyst, #realestate, #appraiser, podcaster/blogger, non-economist, Miller Samuel CEO, family man, maker of snow and lobster fisherman (order varies)
NYC CT Hamptons DC Miami LA Aspen
millersamuel.com/housing-notes
Joined October 2007