Matrix Blog

Furman Center

Bloomberg View Column: Rent Control’s Winners and Losers

October 21, 2014 | 3:31 pm | | Charts |

BVlogo

Read my latest Bloomberg View column Rent Control’s Winners and Losers. Please join the conversation over at Bloomberg View. Here’s an excerpt…

Any renter in New York City has probably has felt the pain of coming up with the monthly payment. There are plenty of reasons for the city’s steep rents…

..So what would happen if rent control and its cousin, rent stabilization, disappeared overnight?

[read more]


My Bloomberg View Column Directory

My Bloomberg View RSS feed.

Tags: , , , , ,


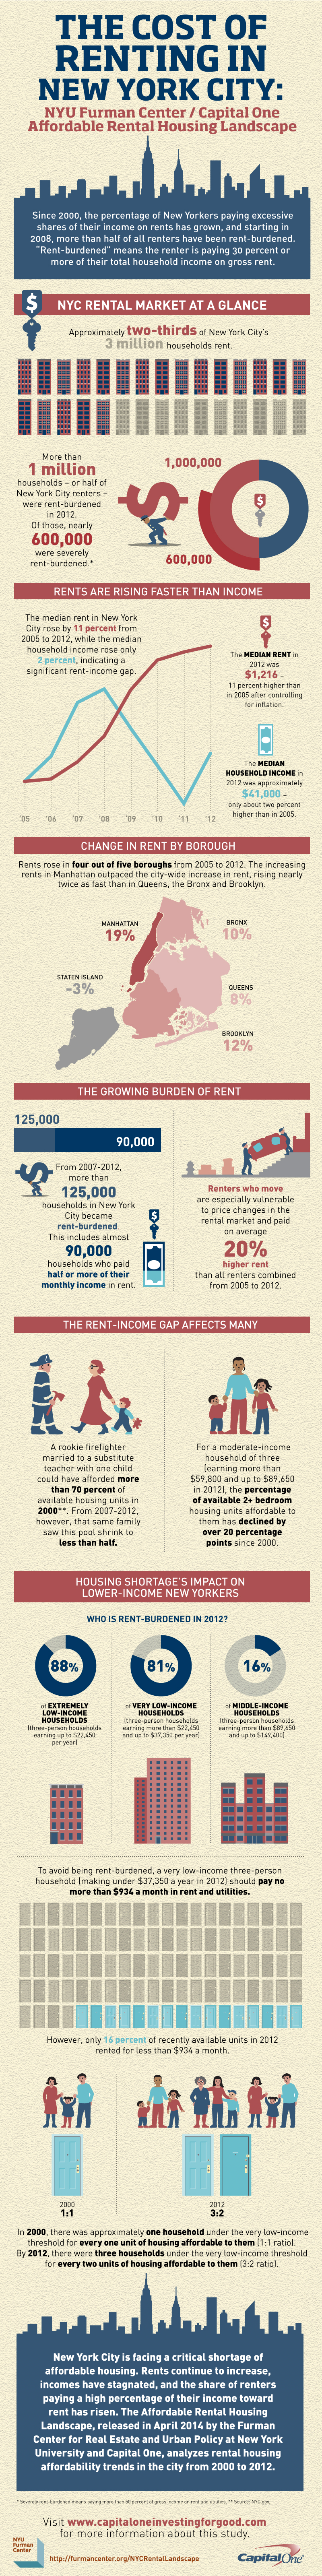
[Infographic] NYU Furman on Cost of Renting in NYC

April 25, 2014 | 9:28 am | |

The NYU Furman Center goes infographic on us with an illustrated story of the falling affordability of NYC rentals – 2/3 of the city is rental.

2014nycrentingNYUFurman

Tags: , , , ,


Valuing A Fireplace

February 3, 2013 | 10:00 am | |

A few weeks ago I provided some logic to Jhoanna Robledo at New York Magazine about valuing a fireplace. She’s just as interested in quantifying amenities as I am and has written some fun pieces on valuing various amenities using my logic. Floor level. Outdoor space. Light and Views.

She distilled down the ±90 minutes of discussion on the hot topic…and remember when it comes to valuation logic, one size doesn’t fit all. My approach came from 26 years of valuing thousands of co-ops, condos and townhouses in NYC but the same logic could very well apply to other markets.

In a study of Manhattan sales that appraiser Jonathan Miller made with researchers from NYU’s Furman Center for Real Estate and Urban Policy, apartments with fireplaces cost an average of about 10 percent more than those without. (The difference was 11.4 percent in condos, 9.7 in co-ops.) But the fireplace is “part of a suite of amenities” not easily parsed from other prewar features like high ceilings. Miller estimates that the fireplace itself adds 2 to 5 percent to the price. That’s a fairly wide range, depending majorly on placement: A mantel in the center of the living room is worth a lot more than if it’s in a back bedroom. And if the fireplace doesn’t work, or the flue needs more than a cosmetic touch-up? That cuts the value by half.

Think yule log.

Tags: ,


[The Housing Helix Podcast] Mark Willis, Research Fellow, NYU Furman Center

June 15, 2010 | 12:05 am | | Podcasts |

I have a conversation with Mark Willis, a Resident Research Fellow at the Furman Center for Real Estate & Urban Policy at New York University.

He is the co-author of Improving U.S. Housing Finance through Reform of Fannie Mae and Freddie Mac: Assessing the Options along with Ingrid Gould Ellen and John Napier Tye.  This white paper was completed as part of the What Works Collaborative, a foundation-supported partnership that conducts timely research and analysis to help federal, state and local housing policy-makers frame and implement evidence-based housing and urban policy agendas.

The paper is essential reading as we go through a period of financial reform.  The report is described as a timely assessment of alternative proposals for the future of Fannie Mae and Freddie Mac, ranging from nationalization to dissolution.  The paper explains the role Fannie and Freddie have played, explores the goals a healthy secondary market for both single- and multifamily housing should serve, and develops a framework to help understand and evaluate the various proposals for reform.

Check out the podcast.

The Housing Helix Podcast Interview List

You can subscribe on iTunes or simply listen to the podcast on my other blog The Housing Helix.


Tags: , , ,


[Interview] Mark Willis, Research Fellow, NYU Furman Center

June 15, 2010 | 12:01 am | | Podcasts |

Read More

Tags:


[Furman Center] Improving U.S. Housing Finance through Reform of Fannie Mae and Freddie Mac

June 7, 2010 | 11:11 pm | |

[click to open paper]

The NYU Furman Center for Real Estate released a white paper: Improving U.S. Housing Finance through Reform of Fannie Mae and Freddie Mac: Assessing the Options by Ingrid Gould Ellen, John Napier Tye and Mark A. Willis that lays out possible paths to take. They also lay out the functions they serve and were intended to serve.

Wow.

A great primer on Fannie and Freddie.

After facing insolvency one year ago, Fannie Mae and Freddie Mac were placed in government conservatorship in September 2008. The Obama Administration’s recently released report on financial regulatory reform calls for a “wide-ranging process” to explore options for the future of the GSEs. The Furman Center, in cooperation with the What Works Collaborative, has conducted research to better understand six primary options for the future of the enterprises, ranging from nationalization to dissolution. This white paper provides an overview of the U.S. housing finance system and the basic operations of Fannie Mae and Freddie Mac before conservatorship. It then discusses the basic goals of a healthy secondary market for both the single- and multifamily market, and offers a framework to help to describe and understand the different proposals for reform. Finally, it looks in detail at some of the specific proposals now emerging for reform of the housing finance system. As the federal government contemplates the future of these two entities, we hope that this paper offers a useful framework to evaluate the alternative proposals.

The GSEs were fundamentally flawed institutions because they were accountable to two parties: shareholders and taxpayers – shareholders as privatized institutions and taxpayers because of the assumed federal backstop. Both parties ended up being crushed by bias favoring shareholders and scramble for market share during the housing boom.

They serve an essential function of creating liquidity for lenders by freeing up their capital to lend more through buying mortgage securities, stabilizing mortgage rates and establishing standardization for the secondary mortgage market. But they are hemorrhaging now with no concrete solution in sight.

There are a lot of good ideas in the paper (I’ve read it twice, and will look at a few more times).

Not to go all regulatory crazy here, but I like the concept of regulating underwriting:

The industry needs to be regulated as to its underwriting standards, the quality of the underwriting process, operational risk, the level of capital/reserves, and even the quality of its servicing of the mortgage loans and the rating of its securities.37 The ability to regulate these entities effectively would be facilitated by requiring, for example, that all securitizers be licensed or chartered. Such a regulatory system/environment would help guard against the proliferation of toxic products, poor quality controls, and unfair and deceptive marketing practices, and thereby prevent the kind of race to the bottom that we have just witnessed, in which safer products are driven out of the market place.

It’s going to be a work in progress, I’m afraid.


Tags: , , ,


[Vortex] DUMBO: A Tale of Two Views

April 23, 2010 | 10:46 am | |

Guest Columnist:
Anonymous DUMBO Resident

Periodically I receive insight from people that have spent a lot of time analyzing specific market trends or attributes. In this case, here’s a fascinating analysis about the views in DUMBO by one of its residents. – Jonathan Miller


A Tale of Two Views
April 2010
Anonymous

Introduction
DUMBO. Down Under The Manhattan Bridge Overpass – arguably one of the most hyped neighborhoods of the aughts. I thought I would take a stab at analyzing some of the real estate in the area. It’s always interesting when market reports and news stories quote a price per square foot or median price for an entire neighborhood. I believe that these numbers are not very useful because even within a neighborhood as small as DUMBO, there are still micro markets that exist based on apartment features. Though DUMBO is a cultural and business center, is safe, family friendly, and has access to shops/restaurants/parks/transportation, the main attraction to real estate in the area is for the world class views. There are really two markets cohabitating in the DUBMO market – one for apartments with “wow factor” views, and one for apartments that do not contain them. The existence of two separate markets will be empirically proved and explored in this paper.

The goals for this analysis are 4 fold:
1) Visually display the existence of the two separate markets in DUMBO
2) Quantify $/PSF value for apartments with “wow factor” views vs those that don’t
3) Assess the effectiveness of an actual DUMBO appraisal
4) Discuss the pricing of apartments currently on the market

Data and Definitions
The area is actually incredibly small with only a few buildings and I chose to look at the two flagships – 1 Main Street (The Clocktower) and 30 Main Street (The Sweeney Building). Both buildings are well established door men condos with views. Other buildings in the area do have views – but I chose not to look at others such as 100 Jay and 85 Adams are new construction, and 70 Washington runs the risk of views being obstructed by the Dock Street development. From 2003-present there were 195 sales in these 2 buildings representing approximately 240 million dollars in value, a large enough sample size for this analysis. The penthouse sale at 1 Main, Cabanas at 30 Main, and one outlier at 30 Main (apt 7G on 9/14/9) were excluded from the analysis

The views I define as “wow factor” contain large windows that have full unobstructed views of the East River + Manhattan Bridge or East River + Brooklyn Bridge + Downtown Manhattan. More specifically these are: 1 Main – Any B, C, D line apartment or an A, J, K, L apartment above floor 4. 30 Main – G, H, A, B apartments above floor 5

All sale price information was taken from ACRIS and square footage sizes were taken from the condo offering plans. It’s important to note that the sale dates represent CLOSING dates – meaning that there can be some noise in the data depending on how long each apartment was in contract. 40 of the sales contain contract date data available from StreetEasy, where the average days between contract and close at 73 days.

Visual Display
The blue line in the graph below represents the average value price per square foot paid quarter by quarter for apartments that have spectacular views. The red line represents the PSF sale price those that do not. Along the X axis is time and the Y axis is dollars paid per square foot ($/PSF).

You can see that over time there is a clear gap between the blue line and the red line (Aside from Q3 2004). This gap represents the higher value of apartments with spectacular views. Furthermore, since 2005 the red line remains fairly constant with a band around 700-800 $/PSF, while the blue line spikes and dips with the market.
It’s important to highlight again that the closing price data comes from ACRIS, which means that the dates are closing dates – NOT the dates each contract was signed.

More recent data – zoom on the chart from 2005-Present

Quantification
Here is the same data in table format. You can clearly see the # of sales, total dollar value of sales per quarter, and weighted $/PSF for each quarter. It’s also interesting to note that though there were 42 more sales of non spectacular view apartments the total $ value is only 6mm more. The final takeaway from the chart is that that the average weighted $PSF difference for the entire timeline is ~$268 PSF.

To extrapolate the $268 PSF into more real terms – we are saying that having two apartments of the same size, one with a view would cost $1,000,000 while one without would cost $732,000. The calculation methodology for PSF calculations were weighted by total square foot. For example, if a 3000 sq ft apartment sold for 1000 psf and a 1000 sq ft apartment sold for 2000 a foot, the avg for that quarter would be 1250. 4000 total sq ft sold – 3000/4000 = .75, 1000/4000 = .25, (.75 * 1000) + (.25 * 2000) = 1250.

Assuming a 20% down payment and 5.5% 30 year fixed mortgage the payments would also work out as follows:

View: $200,000 down, $800,000 mortgage, monthly payment of $4,542 No View: $146,400 down, $585,600 mortgage, monthly payment of $3,325

So we have a difference in monthly payment of $1,217 per million dollars of apartment value, and an annual amount of $14,604 per year.

So when you see a graphic like below that suggests the median price in DUMBO is $1.24 million, you know that value per square foot within that median price is drastically different depending on if the apartment has a spectacular view vs. not.


(Source: The Real Deal)

Appraisal
I got my hands on an actual appraisal for a unit that has a “wow factor” view – and looked at the comps. The first thought is to look at the comps themselves. Understandably, it is very difficult to find true comps considering real estate is such an illiquid asset, but I have highlighted in red the major issue as to why each particular comp loses validity – lets work from the bottom up. If you are buying at 1 Main or 30 Main, you are most likely not considering 360 Furman Street (1 Brooklyn Bridge Park). This is like comparing the Upper West Side and Hells Kitchen – though close in distance, they are just totally different neighborhoods that appeal to different clientele. The Next 3 – 30 Main/7C, 1 Main/5E, and 1 Main/2K – don’t have spectacular views. As we showed in the above chart, there is a significant difference in value when the view is not present and should not be compared. Lastly, though 1 Main/12K could be considered a comparable – I don’t see how it makes sense to compare a sale in 2010 to one that was signed before the Lehman collapse.

Appraisers take these differences into account and thus make adjustments to true up the values of the apartments. In this case, adjustments were made for date of sale, maintenance costs, floor, view, age of building, bathroom count, size in square feet, outdoor space, common roof deck, and garage. Here is a snippet of those adjustments:

If you refer back to my chart above you can see the total appraised PSF of each apartment as well ad the contribution to Total PSF for each adjustment. I’ve left the sign (+/-) off the view/floor and time adjustments, but you can assume that they are positive for the apartments that do not have “wow factor” views. You can see that the View/Floor and Time adjustments are no where near where they need to be compared to the empirical finding

In summary, this appraisal does not take into accounts the severity of difference in price that comes from the nuances of view or timing accurately. More proof that appraisers need in depth local knowledge of the properties they are assessing in order to be able to compare apples to apples.

Current Listings
There are currently 11 units for sale between 1 Main and 30 Main, more important than location, there are 4 with spectacular views and 7 without. The chart below shows those listings and is sorted by price per square foot – looks like the sellers are aware of the bifurcated market as well.

Below is the post Lehman/Financial collapse price per square foot for the area.

You can see that the average for the last 5 quarters comes out to approximately 1118 $/PSF for apartments with views and 766 $/PSF for apartments that lack. We also see that the there is a significant upward trend in the spectacular view apartments where 3 units sold in Q1 of 2010 at a size weighted average of 1224 $/PSF.

Per our earlier analysis with the appraisal – there are nuances to the way these apartments are priced. 1 Main/5D is priced at 1695 $/PSF due to extensive renovations. 1 Main/6GH is commanding a premium due to its size (3bed) as well as renovations.

View Apartments: Considering the current listings are either below 1118 $/PSF or very close to the latest quarter’s $/PSF (1224), the data suggests that all apartments with views aside from 5D are accurately priced.

Non View: We also see that all apartments that lack spectacular views aside from 30 Main/4F are overpriced as they are over the 766 $/PSF recent average and the data does not suggest any upward trend at the moment.

Conclusion
It’s important to disclose that this analysis is measuring the value of space within the DUMBO area, and assumes that buyers are solely looking at apartments within this area. It highlights how even within two buildings there are many nuances and generalizing apartments across neighborhoods is a very difficult and complex task.

Through analyzing historic closing sale information it is clearly visible that there are two separate markets in existence in DUMBO. Refining the data suggests that the price differential between the two markets is ~268 $/PSF. Even within the same building there are significant factors that create a drastic difference in value, and breaking down into monthly mortgage payments the price differential for apartments with views vs those that don’t works about to ~$14,600 annually for a $1 million apartment.

This analysis has also shown that appraising a property is an extremely difficult task that requires an immense amount of local knowledge and building/apartment features.

Lastly, the current listings in the markets for apartments with views are priced in line with historic $/PSF as well as recent trends. 30 Main/9A happens to be the writer’s personal favorite and the one I would bet sells next. The data suggests that apartments that do not have spectacular views appear to be overpriced.

DUMBO: A Tale of Two Views [Anonymous via Miller Samuel]


Tags: ,


[Furman Center] Peeling Back The Lis Pendens

February 3, 2010 | 12:47 am | |

The Furman Center for Real Estate and Urban Policy at New York University released a fascinating report on New York foreclosures called: Foreclosed Properties in NYC: A Look at the Last 15 Years.

Here’s a key characteristic of foreclosures in New York state: 54% of properties that received an LP in 2007 had not, by the end of June 2009, been sold or completed the foreclosure process, and had not received an additional LP.

What’s a lis pendens? Recording a lis pendens alerts a potential purchaser or lender that the propertys title is in question, which makes the property less attractive to a buyer or lender. After the notice is filed, anyone who nevertheless purchases the land or property described in the notice takes it subject to the ultimate decision of the lawsuit.

The average time to sell a property with a foreclosure filing in 2009 was substantially longer.


[RealtyTrac] Pushing 4M in 2009, November Foreclosure Filings Remain High, Pace Eases

December 10, 2009 | 2:45 pm | |


[click to expand]

RealtyTrac has released their monthly US Foreclosure Market Report today and its a mixed bag of results. In other words, its like unemployment. Its at a high level but the pace of increase seems to be abating. In other words, with 3.9 million notices sent to homeowners in default, it is going to take a while for this inventory to clear out.

Here are the foreclosure metrics by state.

And a news recap:

foreclosure filings — default notices, scheduled foreclosure auctions and bank repossessions — were reported on 306,627 U.S. properties during the month, a decrease of nearly 8 percent from the previous month but still up 18 percent from November 2008. The report also shows one in every 417 U.S. housing units received a foreclosure filing in November.

Phyllis Furman over at The Daily News does a nice NYC-centric analysis of the results.

While foreclosure activity is rising, the percentage of homes at risk here – one in every 1,706 – is small relative to the rest of the country. In November, 306,627 U.S. homes – one in every 417 – received a foreclosure filing. That was up 18.4% from last year, but down 7.7% from October.

And Dan Levy at Bloomberg does a nice US foreclosure recap

Dec. 10 (Bloomberg) — Foreclosure filings in the U.S. will reach a record for the second consecutive year with 3.9 million notices sent to homeowners in default, RealtyTrac Inc. said.

This year’s filings will surpass 2008’s total of 3.2 million as record unemployment and price erosion batter the housing market, the Irvine, California-based company said.

“We are a long way from a recovery,” John Quigley, economics professor at the University of California, Berkeley, said in an interview. “You can’t start to see improvement in the housing market until after unemployment peaks.”:

Statistical nirvana by default (sorry for the pun)

  • One in every 417 U.S. housing units received a foreclosure filing in November
  • Default notices nationwide were down 8 percent from the previous month but still up 22 percent from November 2008
  • Nevada, Florida, California post top state foreclosure rates
  • Nevada foreclosure activity – one in every 119 housing units receiving a foreclosure filing in November — 3.5 times the national average.
  • Four states account for more than 50 percent of national total: For the second month in a row, the same four states accounted for 52 percent of the nation’s total foreclosure activity: California, Florida, Illinois and Michigan
  • Las Vegas drops out of top spot among 10 highest metro foreclosure rates. After four straight months with the nation’s top foreclosure rate among metropolitan areas with a population of at least 200,000, Las Vegas dropped to No. 5 thanks to a 33 percent decrease in foreclosure activity from the previous month. One in every 102 Las Vegas housing units received a foreclosure filing in November — still more than four times the national average.


[In The Media] New York Daily News “Top Appraiser” Full Pager

September 14, 2009 | 2:48 pm | | Public |

Was the subject of a full page story in the NY Daily News today – with photo – by Phyllis Furman called Top appraiser offers forecast for New York’s housing market

Fun!

Rankings for today so far:

  • no. 1 read story,
  • no. 1 discussed story and
  • no. 2 emailed story.

Some of the points:

Whenever I talk to a real estate broker who sold a high-end property, I ask, “Did they get a mortgage?” In the last two months, I have never had an agent tell me yes. Their buyers have all paid all cash. Think about that. There are not a lot of all cash buyers out there. I am guessing under 2%.

The 1980s were characterized by massive rental to co-op conversions and significant construction of tax-incentivised, new development condos, primarily for investors. This time around, we didn’t have the investor element. We didn’t have a housing boom, we had a credit boom.

ok, back to work.


Tags:


[Interview] Vicki Been, Professor of Law at NYU School of Law, Director of the Furman Center

June 29, 2009 | 2:59 am | | Podcasts |

Read More


[The Housing Helix Podcast] Vicki Been, Professor of Law at NYU School of Law, Director of the Furman Center

June 29, 2009 | 12:01 am | | Podcasts |


I had the pleasure of speaking with Vicki Been, who among other positions is a Professor of Law at New York University School of Law and Director of the Furman Center.

Great discussion on foreclosures and homeownership.

She and her team do important housing policy work at the Furman Center for Real Estate and Urban Policy.

They also produce a must-read publication called State of New York City’s Housing and Neighborhoods.

Check out the podcast.

You can subscribe on iTunes or simply listen to the podcast on my other blog The Housing Helix.


Get Weekly Insights and Research

Housing Notes by Jonathan Miller

Receive Jonathan Miller's 'Housing Notes' and get regular market insights, the market report series for Douglas Elliman Real Estate as well as interviews, columns, blog posts and other content.

Follow Jonathan on Twitter

#Housing analyst, #realestate, #appraiser, podcaster/blogger, non-economist, Miller Samuel CEO, family man, maker of snow and lobster fisherman (order varies)
NYC CT Hamptons DC Miami LA Aspen
millersamuel.com/housing-notes
Joined October 2007