Guest Columnist:
Anonymous DUMBO Resident
Periodically I receive insight from people that have spent a lot of time analyzing specific market trends or attributes. In this case, here’s a fascinating analysis about the views in DUMBO by one of its residents. – Jonathan Miller
A Tale of Two Views
April 2010
Anonymous
Introduction
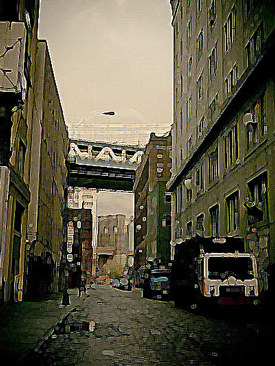
DUMBO. Down Under The Manhattan Bridge Overpass – arguably one of the most hyped neighborhoods of the aughts. I thought I would take a stab at analyzing some of the real estate in the area. It’s always interesting when market reports and news stories quote a price per square foot or median price for an entire neighborhood. I believe that these numbers are not very useful because even within a neighborhood as small as DUMBO, there are still micro markets that exist based on apartment features. Though DUMBO is a cultural and business center, is safe, family friendly, and has access to shops/restaurants/parks/transportation, the main attraction to real estate in the area is for the world class views. There are really two markets cohabitating in the DUBMO market – one for apartments with “wow factor” views, and one for apartments that do not contain them. The existence of two separate markets will be empirically proved and explored in this paper.
The goals for this analysis are 4 fold:
1) Visually display the existence of the two separate markets in DUMBO
2) Quantify $/PSF value for apartments with “wow factor” views vs those that don’t
3) Assess the effectiveness of an actual DUMBO appraisal
4) Discuss the pricing of apartments currently on the market
Data and Definitions
The area is actually incredibly small with only a few buildings and I chose to look at the two flagships – 1 Main Street (The Clocktower) and 30 Main Street (The Sweeney Building). Both buildings are well established door men condos with views. Other buildings in the area do have views – but I chose not to look at others such as 100 Jay and 85 Adams are new construction, and 70 Washington runs the risk of views being obstructed by the Dock Street development. From 2003-present there were 195 sales in these 2 buildings representing approximately 240 million dollars in value, a large enough sample size for this analysis. The penthouse sale at 1 Main, Cabanas at 30 Main, and one outlier at 30 Main (apt 7G on 9/14/9) were excluded from the analysis
The views I define as “wow factor” contain large windows that have full unobstructed views of the East River + Manhattan Bridge or East River + Brooklyn Bridge + Downtown Manhattan. More specifically these are:
1 Main – Any B, C, D line apartment or an A, J, K, L apartment above floor 4.
30 Main – G, H, A, B apartments above floor 5
All sale price information was taken from ACRIS and square footage sizes were taken from the condo offering plans. It’s important to note that the sale dates represent CLOSING dates – meaning that there can be some noise in the data depending on how long each apartment was in contract. 40 of the sales contain contract date data available from StreetEasy, where the average days between contract and close at 73 days.
Visual Display
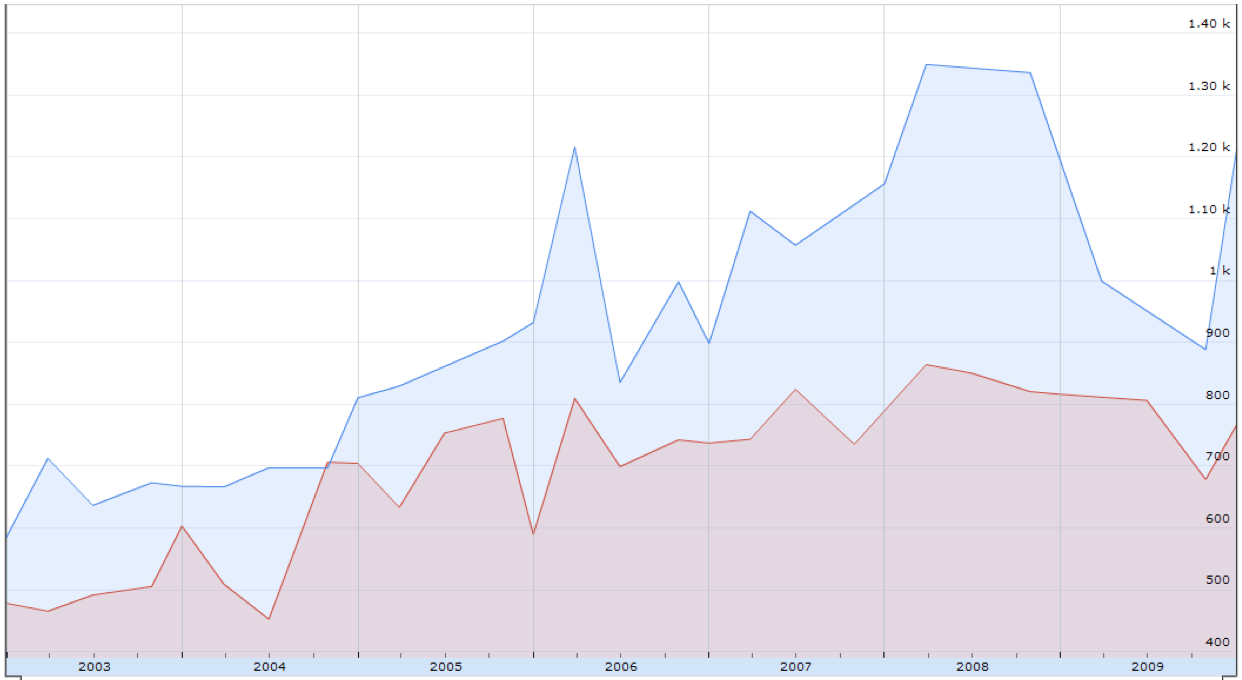
The blue line in the graph below represents the average value price per square foot paid quarter by quarter for apartments that have spectacular views. The red line represents the PSF sale price those that do not. Along the X axis is time and the Y axis is dollars paid per square foot ($/PSF).
You can see that over time there is a clear gap between the blue line and the red line (Aside from Q3 2004). This gap represents the higher value of apartments with spectacular views. Furthermore, since 2005 the red line remains fairly constant with a band around 700-800 $/PSF, while the blue line spikes and dips with the market.
It’s important to highlight again that the closing price data comes from ACRIS, which means that the dates are closing dates – NOT the dates each contract was signed.
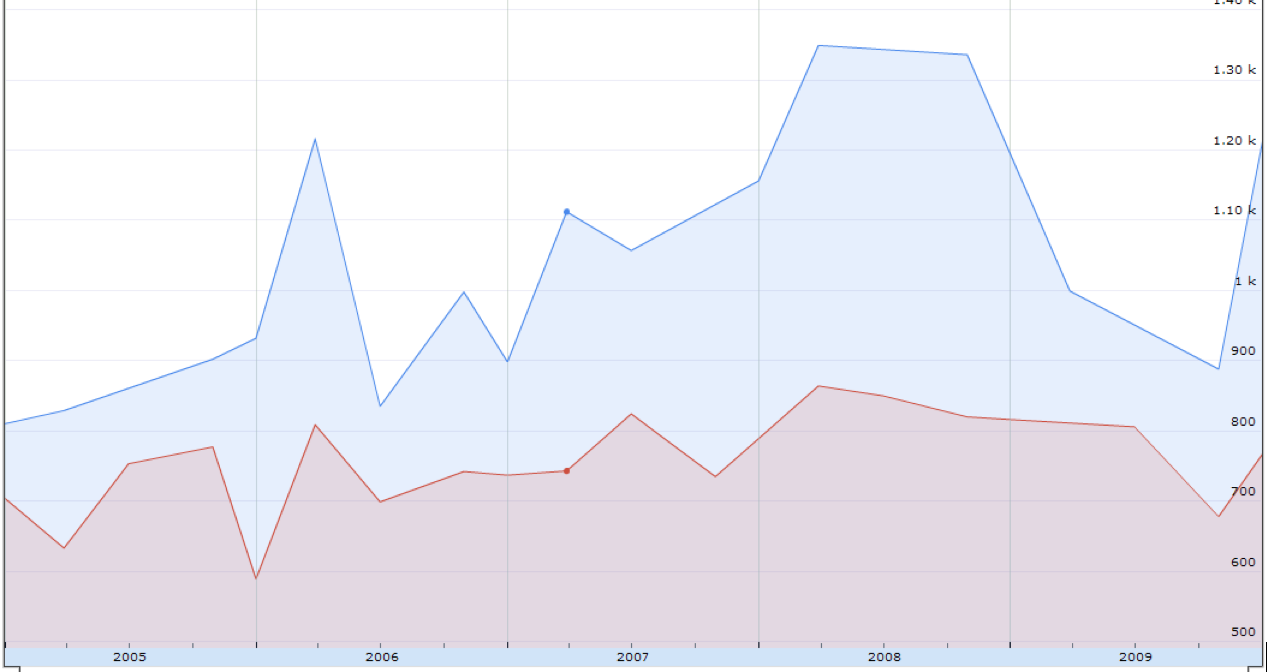
More recent data – zoom on the chart from 2005-Present
Quantification
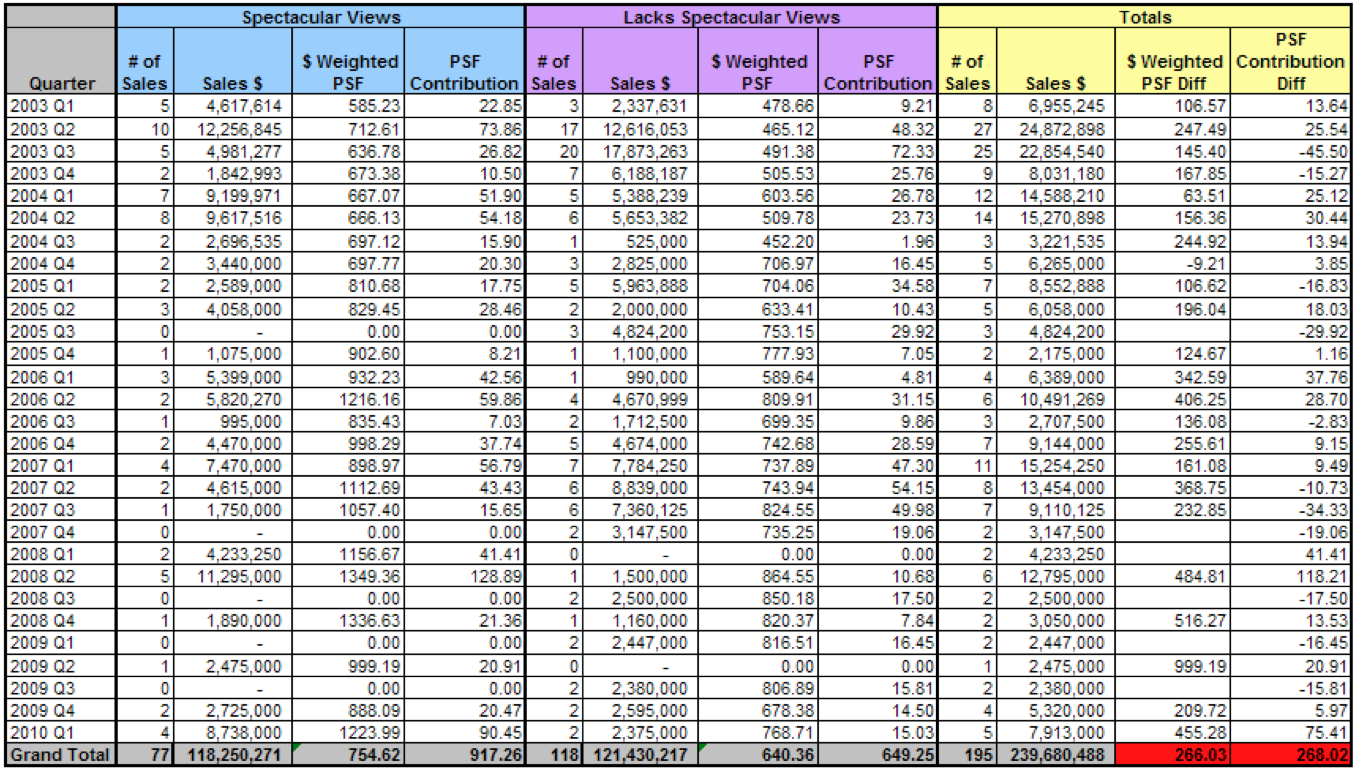
Here is the same data in table format. You can clearly see the # of sales, total dollar value of sales per quarter, and weighted $/PSF for each quarter. It’s also interesting to note that though there were 42 more sales of non spectacular view apartments the total $ value is only 6mm more. The final takeaway from the chart is that that the average weighted $PSF difference for the entire timeline is ~$268 PSF.
To extrapolate the $268 PSF into more real terms – we are saying that having two apartments of the same size, one with a view would cost $1,000,000 while one without would cost $732,000. The calculation methodology for PSF calculations were weighted by total square foot. For example, if a 3000 sq ft apartment sold for 1000 psf and a 1000 sq ft apartment sold for 2000 a foot, the avg for that quarter would be 1250. 4000 total sq ft sold – 3000/4000 = .75, 1000/4000 = .25, (.75 * 1000) + (.25 * 2000) = 1250.
Assuming a 20% down payment and 5.5% 30 year fixed mortgage the payments would also work out as follows:
View: $200,000 down, $800,000 mortgage, monthly payment of $4,542
No View: $146,400 down, $585,600 mortgage, monthly payment of $3,325
So we have a difference in monthly payment of $1,217 per million dollars of apartment value, and an annual amount of $14,604 per year.
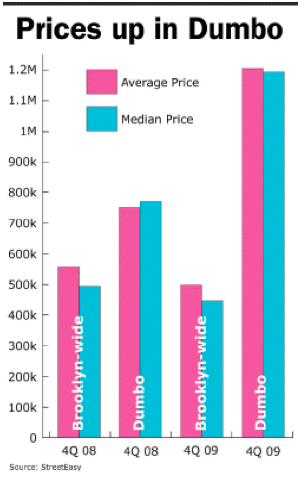
So when you see a graphic like below that suggests the median price in DUMBO is $1.24 million, you know that value per square foot within that median price is drastically different depending on if the apartment has a spectacular view vs. not.
(Source: The Real Deal)
Appraisal
I got my hands on an actual appraisal for a unit that has a “wow factor” view – and looked at the comps. The first thought is to look at the comps themselves. Understandably, it is very difficult to find true comps considering real estate is such an illiquid asset, but I have highlighted in red the major issue as to why each particular comp loses validity – lets work from the bottom up. If you are buying at 1 Main or 30 Main, you are most likely not considering 360 Furman Street (1 Brooklyn Bridge Park). This is like comparing the Upper West Side and Hells Kitchen – though close in distance, they are just totally different neighborhoods that appeal to different clientele. The Next 3 – 30 Main/7C, 1 Main/5E, and 1 Main/2K – don’t have spectacular views. As we showed in the above chart, there is a significant difference in value when the view is not present and should not be compared. Lastly, though 1 Main/12K could be considered a comparable – I don’t see how it makes sense to compare a sale in 2010 to one that was signed before the Lehman collapse.
Appraisers take these differences into account and thus make adjustments to true up the values of the apartments. In this case, adjustments were made for date of sale, maintenance costs, floor, view, age of building, bathroom count, size in square feet, outdoor space, common roof deck, and garage. Here is a snippet of those adjustments:
If you refer back to my chart above you can see the total appraised PSF of each apartment as well ad the contribution to Total PSF for each adjustment. I’ve left the sign (+/-) off the view/floor and time adjustments, but you can assume that they are positive for the apartments that do not have “wow factor” views. You can see that the View/Floor and Time adjustments are no where near where they need to be compared to the empirical finding
In summary, this appraisal does not take into accounts the severity of difference in price that comes from the nuances of view or timing accurately. More proof that appraisers need in depth local knowledge of the properties they are assessing in order to be able to compare apples to apples.
Current Listings
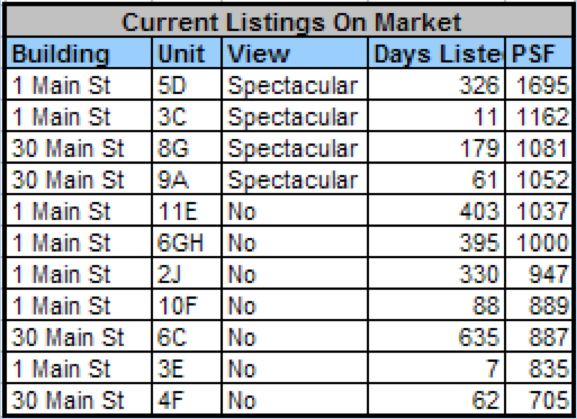
There are currently 11 units for sale between 1 Main and 30 Main, more important than location, there are 4 with spectacular views and 7 without. The chart below shows those listings and is sorted by price per square foot – looks like the sellers are aware of the bifurcated market as well.
Below is the post Lehman/Financial collapse price per square foot for the area.
You can see that the average for the last 5 quarters comes out to approximately 1118 $/PSF for apartments with views and 766 $/PSF for apartments that lack. We also see that the there is a significant upward trend in the spectacular view apartments where 3 units sold in Q1 of 2010 at a size weighted average of 1224 $/PSF.
Per our earlier analysis with the appraisal – there are nuances to the way these apartments are priced. 1 Main/5D is priced at 1695 $/PSF due to extensive renovations. 1 Main/6GH is commanding a premium due to its size (3bed) as well as renovations.
View Apartments: Considering the current listings are either below 1118 $/PSF or very close to the latest quarter’s $/PSF (1224), the data suggests that all apartments with views aside from 5D are accurately priced.
Non View: We also see that all apartments that lack spectacular views aside from 30 Main/4F are overpriced as they are over the 766 $/PSF recent average and the data does not suggest any upward trend at the moment.
Conclusion
It’s important to disclose that this analysis is measuring the value of space within the DUMBO area, and assumes that buyers are solely looking at apartments within this area. It highlights how even within two buildings there are many nuances and generalizing apartments across neighborhoods is a very difficult and complex task.
Through analyzing historic closing sale information it is clearly visible that there are two separate markets in existence in DUMBO. Refining the data suggests that the price differential between the two markets is ~268 $/PSF. Even within the same building there are significant factors that create a drastic difference in value, and breaking down into monthly mortgage payments the price differential for apartments with views vs those that don’t works about to ~$14,600 annually for a $1 million apartment.
This analysis has also shown that appraising a property is an extremely difficult task that requires an immense amount of local knowledge and building/apartment features.
Lastly, the current listings in the markets for apartments with views are priced in line with historic $/PSF as well as recent trends. 30 Main/9A happens to be the writer’s personal favorite and the one I would bet sells next. The data suggests that apartments that do not have spectacular views appear to be overpriced.

8 Comments
Comments are closed.





TERRIFIC analysis, thx! I don’t generally follow DUMBO, but I will pay close attention to the next Major Media “how’s the market in DUMBO doing?” article, to see if they use this data or rely on the tried-and-true BS of agent quotes (“the market’s been really strong lately, with lots of open house traffic and multiple offers”).
THX, JM. THX Anon.
Genius!
[…] appraiser, analyst, investor extraordinaire Jonathan Miller added this timely piece to his Matrix blog Too bad he didn’t include 100 Jay Street in his analysis because I think he would have seen […]
[…] DUMBO: A Tale of Two Views, 23Apr10, Matrix […]
“…70 Washington runs the risk of views being obstructed by the Dock Street development.”
^
30 Main runs those risk as well, thus 70 Washington should have been included. Additionally, No building could have made your case better than 70 Washington.
Clever. I would like to see from the author a similar analysis on the premium for exposed columns as a function of the percent of column exposed.
Brilliant analysis! It would be interesting to see a list of other areas which have views of the most recognized American landmarks (in this case, the Brklyn Bridge, which is probably in the top ten, though certainly not the top 5) and if you find similar patterns.
Excellent analysis, very well thought out!