Matrix Blog

South Florida

Tracking the Flock of (Ultrawealthy) Seagulls

March 6, 2016 | 10:02 am | |

There has been voluminous discussion in recent years about following and marketing to the high end of the demographic scale, especial the real estate market. It’s been the focus of much of the new housing development action of the past five years, especially in big U.S. coastal cities. The high end development market has been widely chronicled here and within my weekly Housing Notes newsletter.

For buyers in the super luxury housing market, owning multiple homes is less about a primary residence with a second home and more about owning “stops on the big circuit.”

And as the rich own a greater share of real estate, major cities like New York, Los Angeles and London are going through a kind of “resortification,” familiar to posh beach towns or ski resorts, as their populations become more seasonal.

For Manhattan, these birds are rare in February and squawking on all treetops (bad pun for super tall condo penthouses) at full capacity in June.

nytcityhopping

And no, I never liked that band.

Tags: , , , , , , ,


[Three Cents Worth #284 Miami] Miami Drill Down: Picking Up the Scraps of the Financial Crisis

May 21, 2015 | 8:00 pm | | Charts |

It’s time to share my Three Cents Worth (3CW) on Curbed Miami, at the intersection of neighborhood and real estate in the Magic City. And I’m taking notes on the beach.

Check out my 3CW column on @CurbedMiami:

As we make our way through the second quarter (more than halfway!), I took a look at some trends extracted from the first quarter reports we prepare for Douglas Elliman. I went all out and created a four charter that addresses a number of issues born out of the financial crisis that still touch the current market..

3cw5-20-15

[click to expand chart]


My latest Three Cents Worth column: Three Cents Worth: Miami Drill Down: Picking Up the Scraps of the Financial Crisis [Curbed]

Three Cents Worth Archive Curbed NY

Three Cents Worth Archive Curbed DC

Three Cents Worth Archive Curbed Miami

Three Cents Worth Archive Curbed Hamptons

Three Cents Worth Archive Curbed LA

Three Cents Worth Archive Curbed Ski

Tags: , , ,


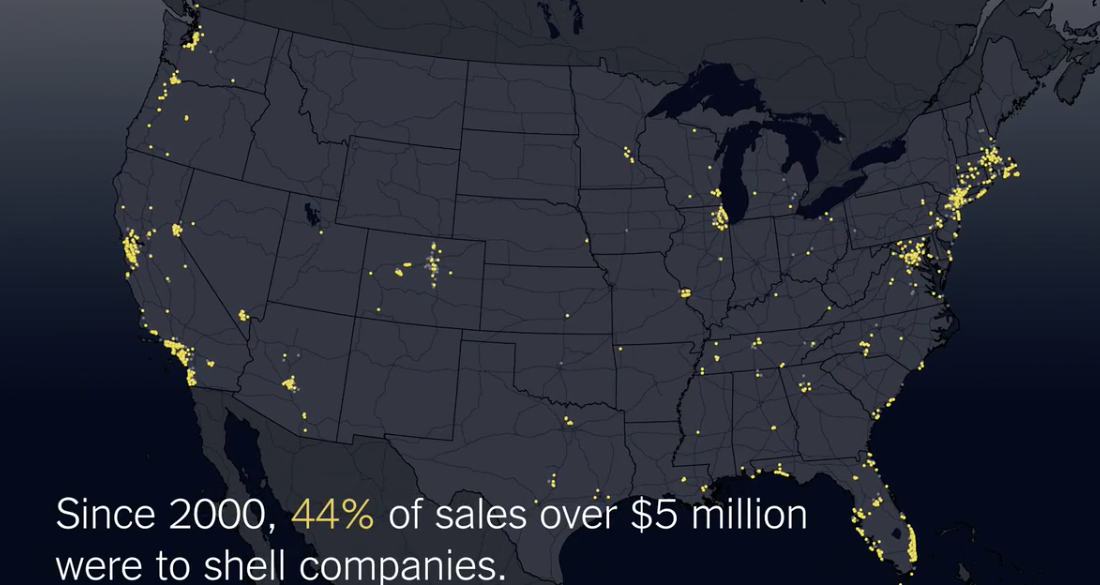
Good and Bad Super-Luxury Condo Buyers Love the LLC

February 9, 2015 | 9:46 am | | Favorites |

llc4

One of the great ironies of modern residential real estate has been the expansion in transparency of information, along with greater secrecy of ownership. I think the latter coincides with the much greater wealth that is being put into hard assets like real estate. Privacy and security are indeed very important to many, including the wealthy and especially those near the top of the financial pyramid. There is nothing sinister or unseemly about the desire for privacy. The use of limited liability corporations (LLCs) has been a legal vehicle (and a gift) from lawmakers who created it that allows people to keep certain transactions hidden from view. However the LLC also provides an opportunity for bad actors to shelter their often ill-gotten assets too.

Louise Story and Stephanie Saul of The New York Times have explored this in “Towers of Secrecy: Stream of Foreign Wealth Flows to Elite New York Real Estate,” an epic data visualization along the lines of “Snow Fall: The Avalanche at Tunnel Creek” This article is a must read covering the hypersensitive subject of high end real estate and privacy.

The ongoing debate about the dying middle class versus the booming fortunes of the wealthy, the lack of affordable housing versus the super-luxury residential tower boom and municipal governments grappling to keep construction and development moving forward to keep tax revenue flows coming in, have made this effort long overdue.

Towers of Secrecy” is careful not to stereotype users of LLCs in high end real estate transactions as exclusively foreign buyers. Within the Manhattan market, foreign buyers are not the majority of overall high-end real estate purchasers. However they tend to be concentrated around the Midtown central business district (aka ‘Billionaires’ Row’) whereas domestic purchasers tend to favor markets found to the north and south of Midtown.

UPDATE There’s a great recap over on Curbed NY too:
Scandal-Plagued Foreigners Park Millions in Midtown Condos

Here are a few screenshots of the embedded videos within the “Towers of Secrecy” piece.

llc3
llc2
llc1

Tags: , , , , , , , , ,


Speaking at ULI Miami Condo Market Symposium

December 30, 2014 | 8:24 pm | | Public |

ULIsoFLjjmpanel

Since it’s the end of the year, I’ve been thinking about some of my favorite events 2014. This past November, I was invited to keynote and moderate the main panel at the Urban Land Institute’s, Southeast FL/Caribbean District Council’s Miami Condo Market Symposium.

My panel included the heavy hitters of condo development and brokerage in South Florida – who spoke candidly in front of a sold out venue at the Epic Residences & Hotel:

– Ugo Colombo, Founder, CMC Group Inc.
– Eduardo Costantini, Chairman, Consultatio Real Estate Inc.
– Richard LeFrak, Chairman & CEO, LeFrak Organization
– Howard Lorber, CEO, Vector Group Ltd. & Chairman, Douglas Elliman
– Jorge Perez, Chairman, CEO & Founder, The Related Group

A recap of my panel and the other speakers and panels…

Photos…
ULIjjmkeynoteULIjjmLeFrakPerez
ULIjjmpanel13ULIjjmpanel12

Tags: , , , , , , , ,


Bloomberg View Column: The $10 Million Home, Never Hotter

November 30, 2014 | 1:00 pm | |

BVlogo

Read my latest Bloomberg View column The $10 Million Home, Never Hotter. Please join the conversation over at Bloomberg View. Here’s an excerpt…

As the U.S. housing market cools from last year’s overheated state, sales of homes at the top haven’t been following the same script. Prices and sales at the upper reaches are soaring…

[read more]


My Bloomberg View Column Directory

My Bloomberg View RSS feed.

Tags:


North America Leads Luxury Housing Trends in 2Q14 – Knight Frank

July 30, 2014 | 12:34 pm | |

KFpgci2q14NA

Knight Frank published their quarterly Prime Global Cities Index today and North America led the way as a region with a 14.5% rise in prices. “Prime” translates to “Luxury” in US housingspeak. We provide research for their Manhattan and Miami results through the Elliman Reports we prepare.

The report conclusion succinctly summarizes the state of high end housing today and speaks to the global phenomenon:

…the index’s annual increase of 6.2% in the year to June is above the long-run average of 4.6% recorded since Lehman’s collapse in the third quarter of 2008, underlining the extent to which prime property has become a favoured asset class globally.

Here’s the table…

KFpgci2q14
[click on table to open report]

Tags: ,


If Choosing Suburbs: Surge in NYC High Wage Earners Choosing NY-NJ-CT

July 21, 2014 | 2:11 pm |

IBOmoversstudy2014
[click to expand]

According to New York City’s IBO, in 2012, there were actually 5 times more moves to Florida than to adjacent Connecticut.

However when breaking the movers into 2 categories: households with real income below and above $500,000, the results really change. New York, New Jersey and Connecticut enjoyed a large increase of high income movers from New York City. The California market share in this category of movers collapsed.

But it is important to recognize that the high wage earners only represent 1.8% of total movers. Florida is still the third most popular destination for movers from NYC who are mere mortals.

Tags: ,


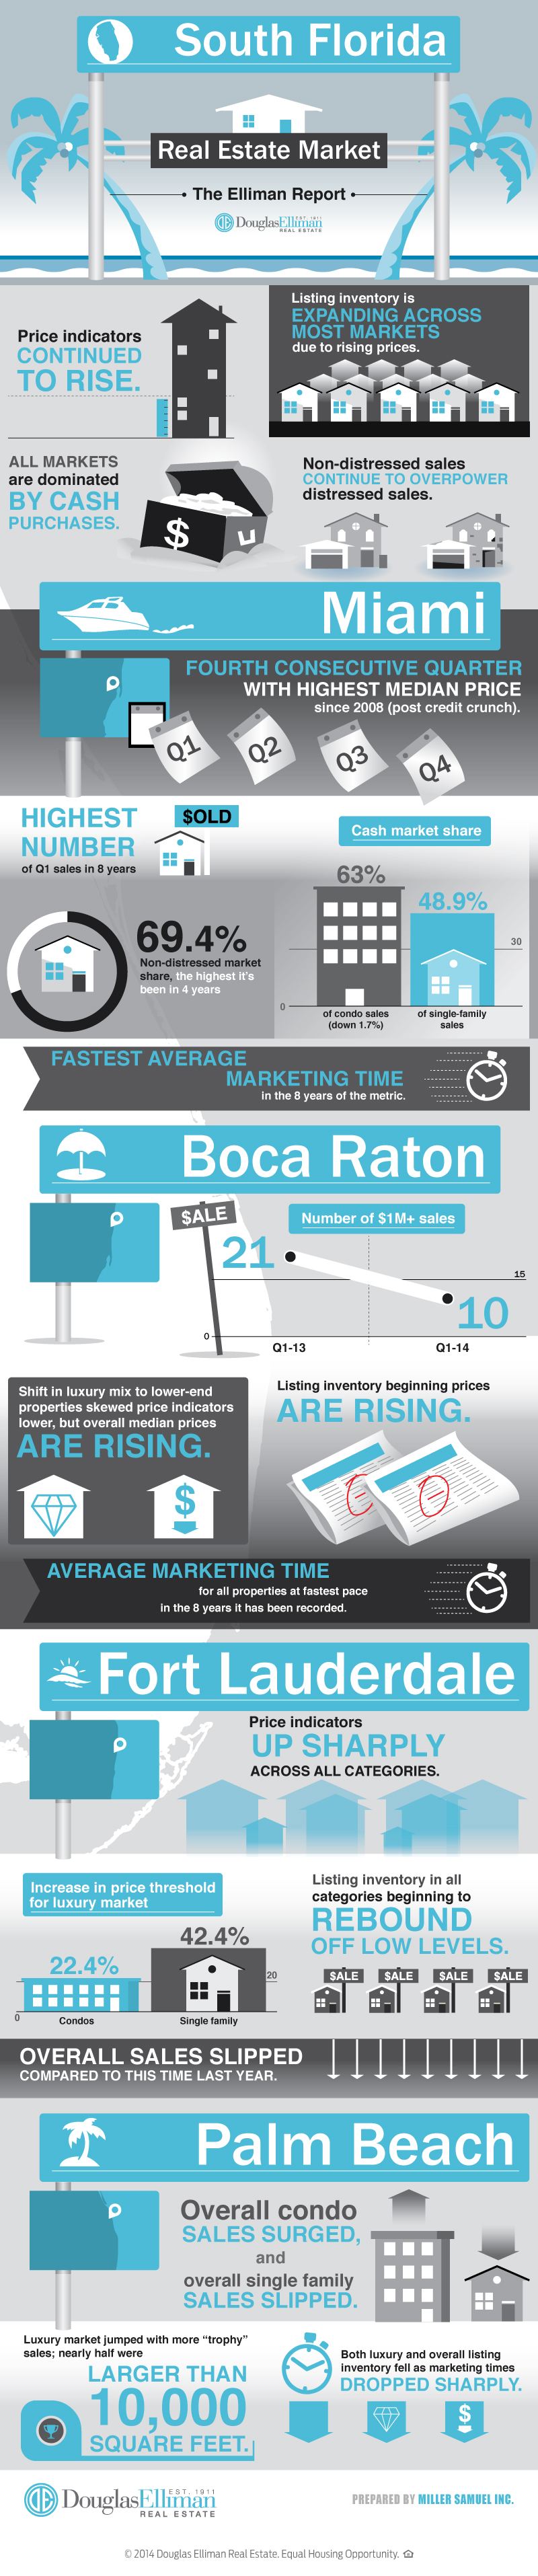
[Infographic] Getting Graphic in South Florida in 1Q 2014

April 18, 2014 | 4:30 pm | | Infographics |

Here’s a jumbo infographic from Douglas Elliman covering the findings of the four market reports in South Florida we prepare for them. Thank goodness Matrix can handle super tall images.

1q14infographicelliman-florida


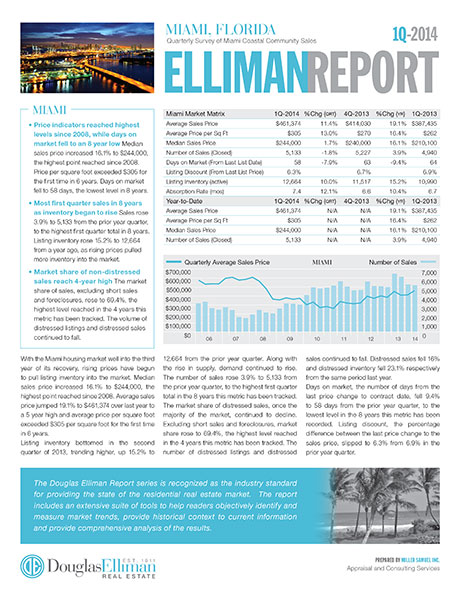
[Ready, Set, Download] South Florida Market Reports 1Q 2014

April 18, 2014 | 4:01 pm | | Reports |

Our 4 comprehensive reports for Douglas Elliman on the residential sales markets for Miami, Boca Raton, Fort Lauderdale and Palm Beach this week.

Click on each report to download!

Miami_1Q14

MIAMI
With the Miami housing market well into the third year of its recovery, rising prices have begun to pull listing inventory into the market. Median sales price increased 16.1% to $244,000, the highest point reached since 2008. Average sales price jumped 19.1% to $461,374 over last year to a 5 year high and average price per square foot exceeded $305 per square foot for the first time in 6 years. Listing inventory bottomed in the second quarter of 2013, trending higher, up 15.2% to 12,664 from the prior year quarter. Along with the rise in supply, demand continued to rise. The number of sales rose 3.9% to 5,133 from the prior year quarter, to the highest first quarter total in the 8 years this metric has been tracked. The market share of distressed sales, once the majority of the market, continued to decline. Excluding short sales and foreclosures, market share rose to 69.4%, the highest level reached in the 4 years this metric has been tracked. The number of distressed listings and distressed With the Miami housing market well into the third year of its recovery, rising prices have begun to pull listing inventory into the market. Median sales price increased 16.1% to $244,000, the highest point reached since 2008. Average sales price jumped 19.1% to $461,374 over last year to a 5 year high and average price per square foot exceeded $305 per square foot for the first time in 6 years…

BocaRaton_1Q14

BOCA RATON
CONDO Median sales price surged 16.3% to $150,000 and average sales price declined 8.8% to $229,569 respectively from the prior year quarter. Listing discount, the percent difference between the list price at time of contract and the sales price, rose to 7% from 3.8% in the prior year quarter, but fell from 7.7% in the prior quarter…

SINGLE FAMILY Median sales price jumped 19.4% to $370,000 and average sales price rose 5.3% to $528,616 respectively from the prior year quarter. Listing discount edged up to 6.9% from 6.1% in the prior year quarter, as sellers were slightly more optimistic when determining their listing price…

FtLauderdale_1Q14

FORT LAUDERDALE
CONDO Median sales price jumped 19.8% to $255,000 from the same quarter last year, the highest level reached since 2008. Average sales price followed the same pattern, rising 23.9% to $379,391 over the same period also reaching a 5 year high.

SINGLE FAMILY The average time to market a property was 91 days, essentially unchanged from 90 days in the prior year quarter. Listing discount, the percentage difference between the list price at time of contract and the sales price, jumped to 8.1% from 4.5% as sellers pressed list prices higher than market trends support.

PalmBeach_1Q14

PALM BEACH
CONDO There were 68 sales during the quarter, 25.9% more than the same period last year. Listing inventory fell 16.9% to 360 over the same period. As a result the absorption rate, the number of months to sell all inventory at the current pace of sales, fell 34% to 15.9 months from the same period last year. The faster market pace pushed down days on market, the number of days from the last price change to the contract date, by 10 days to an average of 182 days.

SINGLE FAMILY Median sales price increased 10.7% to $3,100,000 from the prior year quarter to the highest first quarter reached since 2009. Average sales price jumped 56.7% to $6,450,093 over the same period. The average square footage of a sale was 5,261, up 20.9% from the prior year quarter.

Tags:


Price per Square Inch for Pizza, Slices for Real Estate Market

March 3, 2014 | 5:58 pm | Explainer |

sausagepizzabox

Now that the Oscars are behind us and the “next big snowstorm” just missed NYC, I thought I would finally talk about pizza. But because of why you are here – I’ll make price per inch and price per square foot interchangeable.

One of my favorite podcasts, NPR Planet Money had a great segment called “74,476 Reasons You Should Always Get The Bigger Pizza

The math of why bigger pizzas are such a good deal is simple: A pizza is a circle, and the area of a circle increases with the square of the radius. So, for example, a 16-inch pizza is actually four times as big as an 8-inch pizza. And when you look at thousands of pizza prices from around the U.S., you see that you almost always get a much, much better deal when you buy a bigger pizza.

Explanation of above math: 200.1 inches of pizza surface versus 50.2 inches of pizza surface (pi*r squared=surface area of a circle) And here’s an easy way to calculate the volume of a pizza if you can’t help get enough pizza geometry.

priceperinchpizzachart

Here’s the (pizza) logic
The premise of the piece is that it is much cheaper to buy a large pie than a small pie on a price per inch basis. Pricing for a large pie doesn’t expand as much as the surface area does so the price per inch drops precipitously. In the example above, the 16″ pizza wouldn’t be priced 4x as much as the 8″ pizza – probably more like 2x. Apparently pizza makers don’t take geometry seriously.

Buy the large and throw the unused portion in the fridge. Perhaps that is why people buy homes somewhat larger than what they actually need – they will grow into it.

Suburbs
In suburban real estate, after a certain point, larger the home is, generally the lower the price per square foot. There is a point of diminishing return on excess square footage. The total dollar price is higher, obviously, but the cost of additional space is usually less on a per square foot basis. Hence the pizza analogy applies.

Queen of Versailles, Florida
A well known example of diminishing return is the home featured in the documentary, Queen of Versailles. The 90,000 square foot home is so oversized for the Windmere, South Florida housing market that the vast majority of the living area likely has no value as a single family – other than to the current owners, of course.

Manhattan
In a market with one of the highest per capita population density for a US city, there is a premium for larger contiguous space so perhaps that is why we have so many pizza joints. Here is an price per square foot table by apartment size – you can see how ppsf expands with apartment size consistently over the decade (actually it has shown this pattern for the past 25 years). It’s expensive to get more living area in Manhattan.

manhattanppsftable

Tags: , ,


Overwhelming Visual Recap of Prior ‘Three Cents Worth’ Columns #250 to #256

February 3, 2014 | 8:31 pm | | Charts |

Ok, that’s a lot of hyperbole, the charts do look pretty cool all lined up below. Although the Matrix blog was quiet as we transitioned to a new web site, I still wrote a bunch of posts on Curbed over the past several months and thought I’d share. Here’s the list. Click on each blog title to go to the full post.

December 18, 2013 Curbed NY #256 Finding 2014 Clues In Oft-Overlooked Data 3cwNY12-18-13

December 10, 2013 Curbed NY #255 Dogging Manhattan Apartment Values 3cwNY12-10-13

December 3, 2013 Curbed NY #254 Tallest Rental Chart in Manhattan History 3cwNY12-3-13thumb

November 27, 2013 Curbed NY #253 Charting Manhattan’s So Not Tryptophan-Like Absorption Rate 3cwNY11-27-13

November 19, 2013 Curbed NY #252 Sales Prices Way More Volatile Than Rents 3cwNY11-19-13

November 14, 2013 Curbed NY #251 Manhattan Listings May Have Bottomed 3cwNY11-14-13


Three Cents Worth Archive Curbed NY Three Cents Worth Archive Curbed DC Three Cents Worth Archive Curbed Miami Three Cents Worth Archive Curbed Hamptons

Tags: , , , ,


[Three Cents Worth #249 Miami] The Miami Housing Trend Breakdown

October 28, 2013 | 7:56 pm | | Charts |

It’s time to share my Three Cents Worth (3CW) on Curbed Miami, at the intersection of neighborhood and real estate in the Magic City. And I’m taking notes on the beach.

Check out my 3CW column on @CurbedMiami:

Miami has become a market with a lot of moving parts so it’s best not to throw all the data into one bucket and call it a day. Last week Douglas Elliman released the 4 South Florida market reports I author for them including Miami and this week’s charts were taken from data compiled in the report. I presented a bunch of metrics in the single family and condo market broken out by the distressed and non-distressed markets. Distressed property are defined here as short sales and foreclosures…

[click to expand chart]


My latest Three Cents Worth column on Curbed: The Miami Housing Trend Breakdown [Curbed]

Three Cents Worth Archive Curbed NY
Three Cents Worth Archive Curbed DC
Three Cents Worth Archive Curbed Miami
Three Cents Worth Archive Curbed Hamptons

Tags: , ,

Get Weekly Insights and Research

Housing Notes by Jonathan Miller

Receive Jonathan Miller's 'Housing Notes' and get regular market insights, the market report series for Douglas Elliman Real Estate as well as interviews, columns, blog posts and other content.

Follow Jonathan on Twitter

#Housing analyst, #realestate, #appraiser, podcaster/blogger, non-economist, Miller Samuel CEO, family man, maker of snow and lobster fisherman (order varies)
NYC CT Hamptons DC Miami LA Aspen
millersamuel.com/housing-notes
Joined October 2007