Matrix Blog

Posts Tagged ‘PHSI’

Bloomberg View Column: A Housing Recovery Built to Last?

May 16, 2015 | 9:17 pm | | Charts |

BVlogo

Read my latest Bloomberg View column A Housing Recovery Built to Last?.

bvchartfaststart

Here’s an excerpt…

The housing market has recovered in fits and starts since the financial crisis, so it’s worth noting when one important indicator looks really strong. This is the case with the pending home sales index, which reflects contracts signed for purchases of single-family homes, co-ops and condos, published by the National Association of Realtors…

[read more]


My Bloomberg View Column Directory

My Bloomberg View RSS feed.

Tags: , , , , ,


My Bloomberg View Column: Housing Data Is Old and Moldy

July 31, 2014 | 11:32 am | | Charts |

BVlogo

After being pummeled with confusing sound bits after the release of Monday’s Pending Home SalesIndex by the NAR and the S&P/Case Shiller Index, I thought it was time to set the record straight on the applicability of this research.

This is my second column for Bloomberg View: Housing Data Is Old and Moldy


My Bloomberg View RSS feed.

Tags: , , , , , ,


[Fox Business TV] Risk & Reward with Deirdre Bolton 5-29-14

May 29, 2014 | 4:43 pm | | TV, Videos |

It was great to reconnect with Deirdre Bolton after she made the move to Fox Business from her long time home at Bloomberg TV.

We talked housing, touching on NAR’s pending home sale index release as well as research from Realtytrac concerning record prices in a growing number of urban markets.

Fun.

Tags: , , , , ,


Pending Home Sales Fall Short of Year Ago Sales Surge

May 29, 2014 | 4:29 pm | Charts |

2014-april-phsi-05-29-2014
[click to expand]

The NAR released their Pending Home Sale Index today for April which aggregates signed contract data for the month. It is generally 2 months closer to the “meeting of the minds” between buyer and seller than their existing home sale report, that is based on closed sales (and 4 months faster than Case Shiller).

Pending Home Sales Index is not “forward looking”
In my chart above, and if you know me, I hate seasonal adjustments (SA) in housing data so this chart uses NAR’s reported numbers without adjustments. NAR always frames this release series as “forward looking” when it really is “less backward looking” because it is based on contracts, not closed sales. The end of May report reflects April contracts, half of which were probably signed in Late March. With a 2 month spread between contract and closing dates, this report is the most recent US housing market snapshot but nothing about it is actually “forward looking.”

With all the weather talk and mixed housing market messaging over the last month, this release brought us a broad range of interpretation, from “plunging” to “edging higher.”

Well, which is it? Or could it be both? Yes it can. We just need context.

According to Housingwire (uses SA numbers): Pending home sales plunge 9.2% in April So much for that post-winter, pent-up demand

Pending home sales for the month of April plummeted 9.2% compared to April 2013, the National Association of Realtors reported Thursday.

Contracts signed to buy existing homes increased 0.4% in April compared to March 2014, but that’s coming off three months of flat sales blamed on cold weather.

The expectation had been for at least a 2% gain month-over-month.

According to Diana Olick at CNBC (uses SA numbers), Pending home sales up just 0.4% in April, missing expectations

Warmer weather and higher expectations failed to cause a meaningful surge in home sales.

Signed contracts to buy existing homes increased just 0.4 percent in April, according to a monthly report from the National Association of Realtors (NAR). The expectation had been for at least a 2 percent gain sequentially.

The Realtors’ so-called pending home sales index is now 9.2 percent lower than April of 2013.

What’s going on?

If you look at the above chart you can see that last year’s pending home sales were surging up until May 2013, their highest level in 3 years (since the federal homeowner tax credit program as part of the stimulus). The surge in contracts in the first half of 2013 was born out of consumer fears that rates were going to rise. In addition, all the pent-up demand accumulated during the two year period preceding the US election and fiscal cliff deadline was released into the market. Many fence-sitters became decision-makers.

This winter’s harsh weather could have delayed buyers and we should be seeing this uptick in activity by now. We probably are seeing it but it no match for the year ago surge in activity but now the market is being characterized as weak or weakening. The problem with that description is it assumes that 2013 was a normal trend of an improving market. Well it wasn’t.

So yes, sales are down from the 2013 sales surge anomaly and the weather time-shifting buyers forward further into spring this year was no match for it. In fact, I suspect the next month will show the same type of “weakness” and the PHSI results probably can’t show real improvement at least until June.

Tags: , , , , ,


PBS Newshour – Making Sense of Weak US Housing Reports

April 28, 2014 | 5:10 pm |

Michelle Conlin of Reuters gives a nice overview of the state of the US housing on PBS, talking through the national reports that hit us recently. Check it out. This month’s weak NAR Existing Home Sales report has unleashed a surge of housing self-loathing (although today’s PHSI seems to take some of the drama/edge off).

Tags: , , , , , , , ,


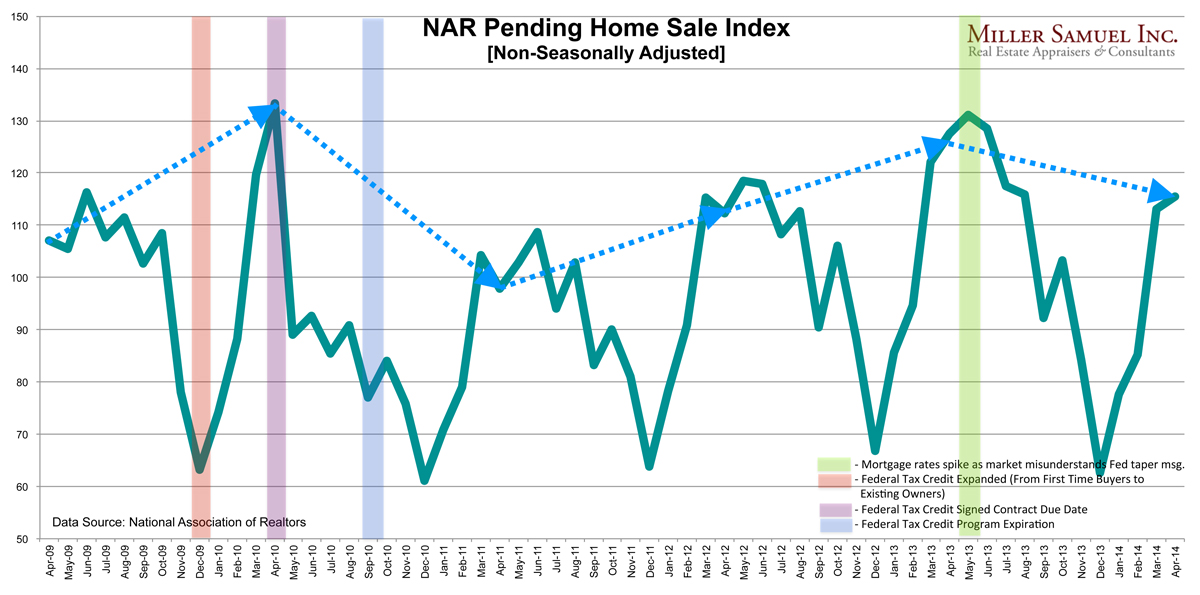
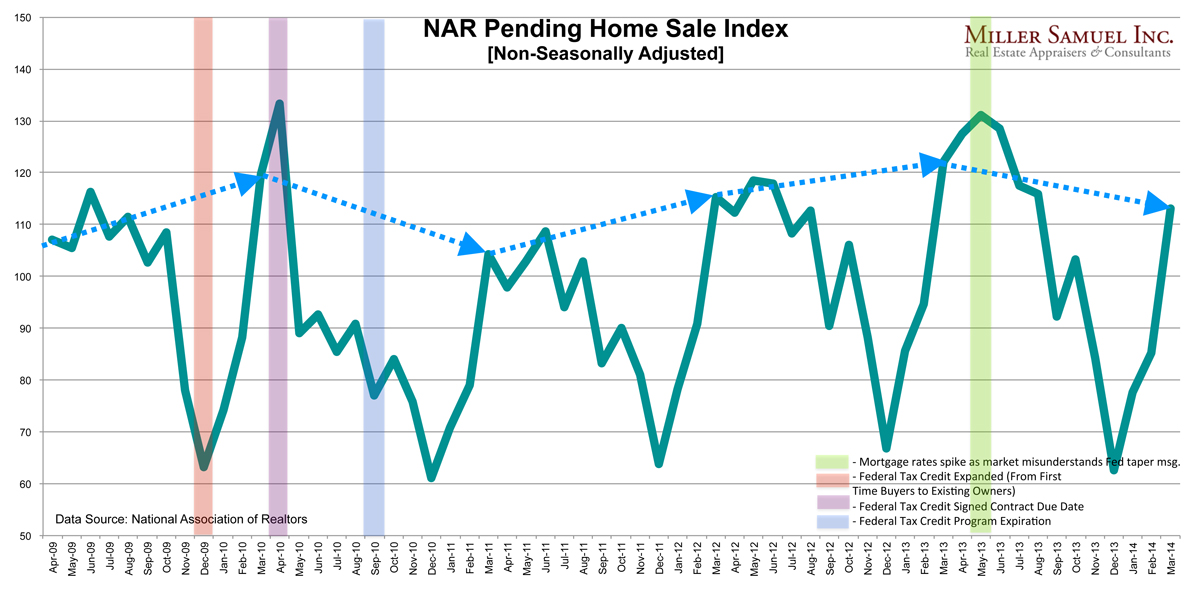
NAR Pending Home Sales Had Biggest “February to March” Jump in 4 Years

April 28, 2014 | 4:52 pm | |

4-28-14PHSI
[click to expand]

After all the housing news drama of the past month, I thought it was interesting to see the negative streak broken. Still, sales are below year ago levels after what I described as a “release of pent-up demand” that was caused by the expiration of the “fiscal cliff” and the looming rise in mortgage rates last year.

Although home sales are expected to trend up over the course of the year and into 2015, this year began on a weak note and total sales are unlikely to match the 2013 level.

All the indices NAR publishes bother me because they include seasonal adjustments and those adjustments can be very severe. The chart above has no seasonal adjustments so you can see how much adjusting has to take place to smooth out the line. I thought I’d take a look at the month-over-month data that wasn’t seasonally adjusted to see if the same pattern occurred.

4-28-14PHSIfebtomarch

Yes, month-over-month pending sales rose the most since 2010 when the market was wildly skewed (higher) as a result of the First-Time Homebuyer Credit (federal first time buyer and homeowner tax credit).

February to March 2014 had the largest increase in contracts than the same period in each year since 2010.

Tags: , , , , ,


Pending Home Sales Down 10.2% YOY And That’s Not A Bad Thing

March 27, 2014 | 11:55 am | Charts |

NARphsi3-27-14
[click to expand]

NAR released their pending home sale index today and the news was not unexpected. US home sales volume has slowed since last spring’s taper miscue by the fed which caused mortgage rates to jump. If you look at the May surge in pending sales, sales volume, seasonally speaking (comparing year over year) has fallen 10.2% (unadjusted).

The introduction of QM earlier in the year probably doesn’t help volume levels, but I’m not really convinced that the housing recovery is actually stalling. It seems more like sales levels are settling to more sustainable levels. And as sales go, so goes the insane price gains seen in the national reports.

Tags: , , , , ,


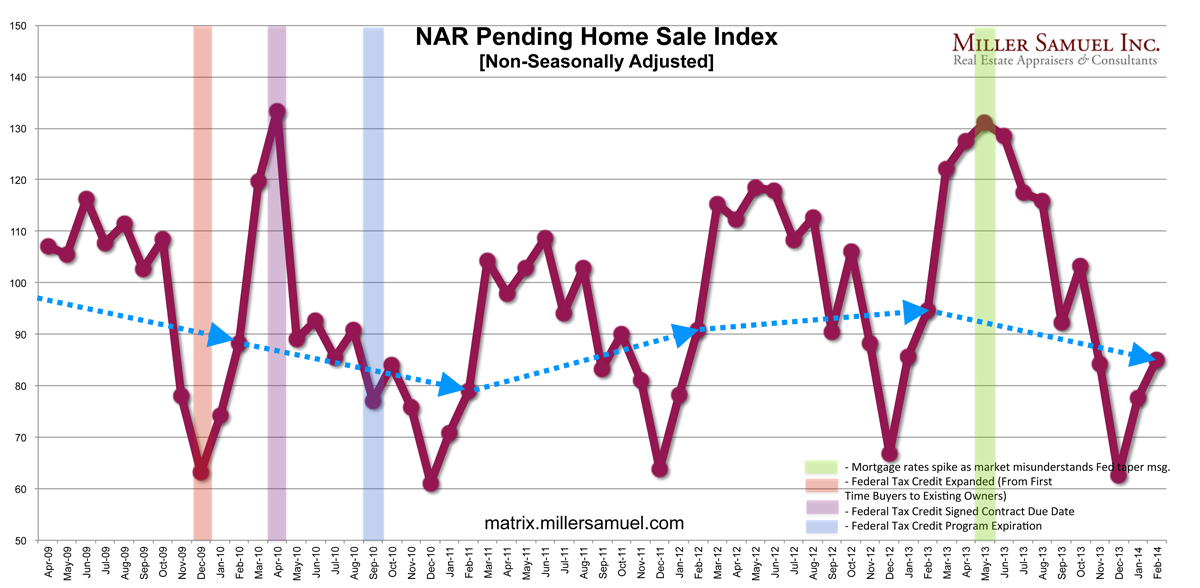
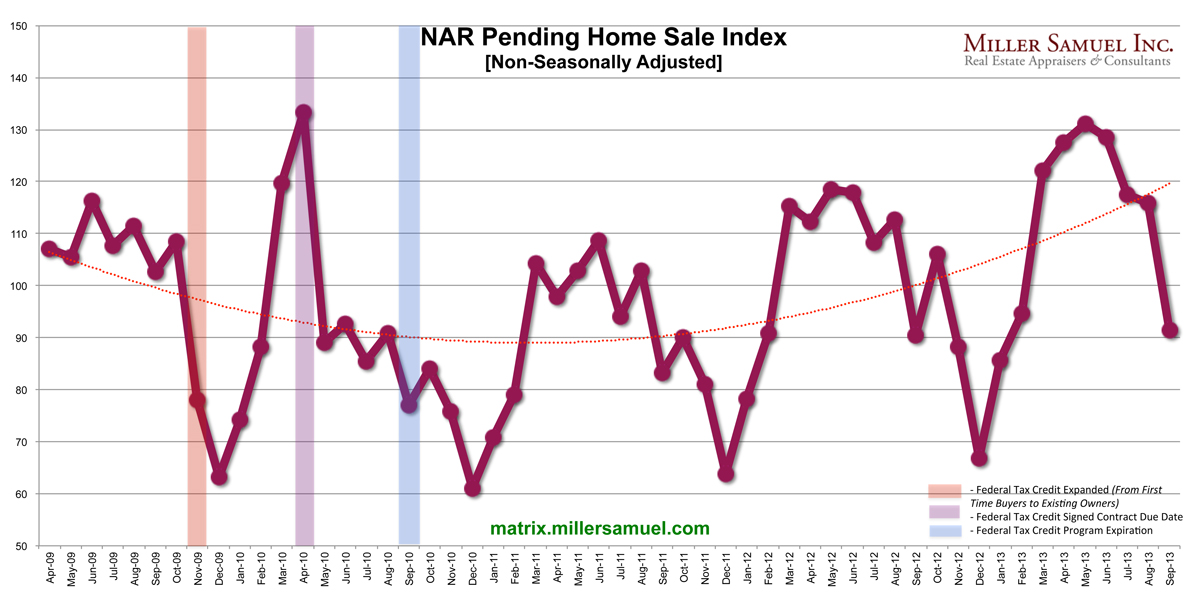
NAR Pending Home Sale Index Sort of Goes Negative

October 28, 2013 | 7:31 pm | | Charts |


[click to expand]

According the National Association of Realtors, their Pending Home Sales Index fell 5.6% from August to September 2013 (seasonally adjusted), the largest monthly drop since May 2010 after the artificial prop of the 2009-2010 federal homebuyers tax credit expiration caused contracts to drop by nearly 1/3 from bloated levels.

Removing seasonality from the results makes the year-over-year adjustment show nominally 1.1% higher contract volume from September 2013 than in 2012 rather than a 1.2% decline. Still, the results were weak.

Why did pending sales post weaker results?

  • Don’t blame the partial government shutdown – that came later.
  • After the May 2013 Fed surprise announcement, fence sitters surged to the market to lock in before mortgage rates rose further, bloating contract volume over the summer (and why month-over-month seasonal adjustments to this data are so very misleading).
  • The surge in summer sales “poached” from future organic volume that we would have seen in September so we were already expecting a slow down in volume. Didn’t we learn in 2010 what happens when unusual circumstances press volume sharply higher only to see volume fall sharply when that circumstance disappears?

Weaker conditions prevail, but its really not as bad a report result as being discussed – namely because the seasonal adjustments paint a weaker picture than what actually happened, and we expected a decline in activity because the prior several months were artificially pushed higher with so many more buyers rushing to the market to beat rising rates (or the perception of rising rates).

Tags: , , , , ,


[Housing Recovery Update] Proclamations Over Reasons, Statistics Over Logic

December 13, 2012 | 10:20 am |

Once a month a local real estate broker passes out monthly updates of our local Connecticut housing market at our commuter train station. He’s a nice affable guy and I get to hear him explain the market to people as we wait in the warm station. He said this to me after I took a look at his handout this morning,

“The statistics aren’t too shabby, eh?”

And I smiled and responded, “that’s the power of record low mortgage rates.” to which he gave me the “thumb’s up” gesture.

And he’s right, his MLS statistics show a very much improved housing market from a few years ago and nearly all of the improvement has been mortgage rate related.

His view of housing is not unlike most public economic prognosticators from Wall Street, NAR, NAHB and real estate brokerage firms, consumers and general in-the-media-all-the-time types.

However few, if any, prognosticators understand why or seem interested in understanding whether it is sustainable (aka forecasting a trend). Once a metric shows promise, it will rise forever, or something like that.

Here’s my town recap for November being presented as a report (with a wildly low 15 sale data set). All the percentages reflect November 2012 over November 2011:

  • New Listings -40%
  • Pending Sales +36.4%
  • Homes sold +15.4%
  • DOM +53%
  • Average Sales Price +29.4%
  • Average Dollar Volume +49.3%

Despite the low data set, the results are remarkably consistent with national trends. Now look at why these metrics actually changed:

  • New Listings -40% [tight credit pressing inventory down because sellers can’t buy]
  • Pending Sales +36.4% [record low (and continuing to fall) mortgage rates + high rents]
  • Homes sold +15.4% [behind pendings because pace of sales accelerating as rates fall]
  • DOM +53% [older stagnant inventory is getting sold off from lack of supply]
  • Average Sales Price +29.4% [more high end sales are moving this year]
  • Average Dollar Volume +49.3% [same as above]

If you pull the plug on low rates, the housing market (literally) plunges. No one is suggesting this is the scenario that will occur but the national housing market feels incredibly fragile to me.

But why should I (or anyone else) actually care whether we understand what’s actually going on? The stats show sales and price numbers are higher than last year – “bullet dodged” – that’s all we need to know – we did the math.

Tags: , , , , ,


[NAR] Pending Home Sales Index

June 2, 2010 | 2:16 pm | |


[click to expand]

NAR released its PHSI today and there were no surprises. The expiration of the federal tax credit for first time buyers and existing home owners (signed contract by April 30, close by June 30) showed its impact on sales trends.

By the way, my above chart shows how ridiculous seasonal adjustments are – the non-seasonal adjusted line better reflects whats going on.

The pending sales data set is about 20% the size of existing homes and is comprised of existing single family and condo sales. Its dubbed a forward looking index but it really is a current looking index. The “meeting of the minds” between buyer and seller occurs just before contract signing. Its forward looking in the context of closing data but it is not forward looking on the condition of housing.

Consecutive M-O-M Gains

  • Sales were up 6% from March to April and up 22% from April 09 to April 10. Last month
  • Sales were up 7.9% from February to March and up 8.3% from March 09 to March 10.

Analysts have expressed fear the housing market will suffer with the end of the government subsidy. But the job market has been improving. The Labor Department is scheduled this week to release employment data for May, and economists surveyed by Dow Jones Newswires are expecting a gain of 515,000 non-farm payroll jobs.

The same thing happened last fall as the initial tax credit within the federal stimulus plan was set to expire on November 30 only to be renewed and expanded a few weeks later. No renewal this time.

Regionally things were not so consistent. Month over month gains in

  • Northeast +29.5%
  • Midwest +4.1%
  • South -0.6%
  • West +7.5%

Buyers they better close by June 30th. Not an automatic assumption in today’s mortgage environment.


Tags: , , ,


[In The Media] Bloomberg Radio The Hays Advantage 12:30pm

June 2, 2010 | 9:15 am | | Public |

Just a bit of house cleaning…err NAR’s Pending Home Sales Index being released at 10am this morning.

I’ll be on The Hays Advantage show with Kathleen Hays on Bloomberg Radio talkin’ pending home sales (contracts) today at 12:30 on AM1130, XM channel 129 or SIRIUS channel 130.

Always enjoy being on her program.


Tags: , , , ,


[Pending Home Sales] Tax Credit Wild Card? M-O-M Down 16%, Y-O-Y Up 15.5%

January 6, 2010 | 12:43 am | |


[click to expand]

NAR released their November 2009 Pending Home Sales Index which ended a 9 month string of increases.

The Pending Home Sales Index, a forward-looking indicator based on contracts signed in November, fell 16.0 percent to 96.0 from an upwardly revised 114.3 in October, but is 15.5 percent higher than November 2008 when it was 83.1.

NAR attributes the drop as a pullback during November related to the uncertainty surrounding the extension of the first time home buyers tax credit which expired November 30th. However it was subsequently extended and expanded to include existing home buyers who have until the end of this April to sign a bonafide contract. We may trivialize the tax credit’s success in the NYC metro area because of the higher housing costs relative to $8,000 and $6,500 tax credits respectively but from my discussions with real estate agents around the country, it did appear to trigger a large portion of home sales in 2009.

What does the 16% drop suggest? More weakness to come?

Yes, but not in the coming months (remember this is a seasonally adjusted stat).

It signifies that the US Housing market doesn’t yet have its own set of legs. No credit = drop in sales.

The credit extension ends in April, the Fed begins their pullout from the purchasing of Fannie Mae mortgage paper, perhaps influencing mortgage rates higher.

The combination of high unemployment, rising mortgage rates and the expiring tax credit in the spring, combined with the elixir of rising foreclosures causes by sustained unemployment at high levels suggests housing sales will fall in second half 2009.

Housing in 2010: Stability in the first half, with more concern for the second half.


Tags: , , ,

Get Weekly Insights and Research

Housing Notes by Jonathan Miller

Receive Jonathan Miller's 'Housing Notes' and get regular market insights, the market report series for Douglas Elliman Real Estate as well as interviews, columns, blog posts and other content.

Follow Jonathan on Twitter

#Housing analyst, #realestate, #appraiser, podcaster/blogger, non-economist, Miller Samuel CEO, family man, maker of snow and lobster fisherman (order varies)
NYC CT Hamptons DC Miami LA Aspen
millersamuel.com/housing-notes
Joined October 2007