Matrix Blog

Posts Tagged ‘Hurricane’

Incentivized by FEMA, ‘Houses on Stilts’

March 31, 2014 | 6:00 am |

Nearly a year ago, my wife and I went for a drive in the next town over from where we live in Connecticut and stumbled across a slew of houses being modified to the FEMA Base Flood Elevation (BFE). It was eye opening for me since I never envisioned a house – especially houses built 30-50 years ago – as so readily moveable. As a kid I had observed my dad have his real estate office moved 2 doors down so he could sell his lot to an adjacent condo developer….and 40-years later both of those buildings are standing.

Note all the”tall” garages.

IMG_3703
IMG_3707
IMG_4555
IMG_4557

It also raises valuation issues. How will an appraiser handle the valuation of the house next to the house that was raised? We may see the market apply a penalty to the house not on stilts in a flood zone.

This was a home being lifted last spring…

IMG_3715

and with the work complete…

IMG_4559

What would a potential buyer of the house next door (in a flood zone) think?
IMG_4560 2

Tags: , , , ,


Group Claims Glass Curtain Walls “A Major Step Backward Environmentally”

February 4, 2014 | 4:42 pm | | Radio |

wsjglasshouse2-3-14

The Wall Street Journal released an intriguing article about the use of glass curtain walls on new buildings: Study: Glass Condos Could Pose Health Threat Through Overheating: Hot Summer Could Raise Temperatures Into Triple Digits.

The piece was inspired by content provided by the Urban Green Council, who are trying to push for more rigorous building standards in the aftermath of Superstorm Sandy. They’ve had a PR bonanza for this one since the story was even picked up by Gawker.

But the findings were disputed by some developers and architects, who said that glass buildings in recent years have made big advances in overall energy efficiency. That includes improved glass with special coatings to reflect heat and more insulated surfaces in building walls, to comply with increasingly rigorous city and state energy codes.

The idea of glass curtain walls became a bigger issue in the recent boom and the current boom than in years past: the technology has improved, and with shift in the mix towards luxury development, the need for expansive views and light to raise values made it more popular. The irony of this is, and this is certainly not a definitive statement, that glass curtain walls can be less expensive for luxury development than using more traditional mortar/window installs if it is not load bearing.

And Toronto seems to hate them (when not writing about Mayor Rob Ford) in this CBC piece: Throw-away buildings: The slow-motion failure of Toronto’s glass condos.

UPDATE

Ilya Marritz at WNYC just posted on this topic with the understated title: People Who Live in Glass Houses are Really Hot. Here’s the radio version:

Tags: , , , , , , , ,


[Three Cents Worth NY #239] 13 Thousand Little (Manhattan) Closings

July 30, 2013 | 4:45 pm | | Charts |

It’s time to share my Three Cents Worth (3CW) on Curbed NY, at the intersection of neighborhood and real estate in the capital of the world…and I’m here to take measurements.

Check out my 3CW column on @CurbedNY:

It’s been quite a 12-month window on the Manhattan market and since I am going on a beach-related vacation tomorrow, I thought I’d get granular like sand (sorry). I took a look at the past year’s worth of co-op, condo and townhouse closings to view the impact of Hurricane Sandy and the Fiscal Cliff on closing patterns, throwing in holidays for good measure…

[click to expand chart]


My latest Three Cents Worth column on Curbed: 13 Thousand Little (Manhattan) Closings [Curbed]
Three Cents Worth Archive Curbed NY
Three Cents Worth Archive Curbed DC
Three Cents Worth Archive Curbed Miami

Tags: , , , ,


Manhattan’s 1% Prefer Proximity to Central Park Over Waterfront

November 20, 2012 | 5:40 pm | Charts |

With the post-Hurricane Sandy heightened awareness of waterfront living and flooding risk, I thought I’d provide a visualization of where the top 1% most expensive properties in Manhattan are located. Manhattan’s top 1% of the housing market starts at $10M. I presented all the co-op, condo and 1-3 family townhouses that closed at or above January 1, 2003 in Manhattan. I used the same data set (but updated) when I presented the Tallest Chart in the History of Manhattan Real Estate a while back.

Fairly consistent pattern – clustered around Central Park and lofts downtown with only a handful along the waterfront.

Tags: , ,


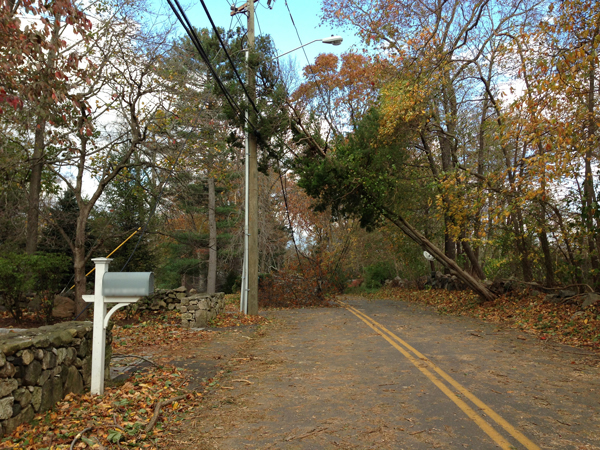
Sandy Aftermath – 60 Minutes Story on Belle Harbor, Queens, New York

November 12, 2012 | 6:56 pm | TV, Videos |

A few thousand people in Belle Harbor have endured so much – inspirational – community. This is one of many areas devastated by Hurricane Sandy in NYC region. And it’s why I feel so petty when asked about what happened to us in the storm – that I lost power for 5 days. They faced losses from 9/11, a jet crashing in their neighborhood in 2001 and now Sandy.

Good grief.

Tags: , ,


Hamptons High End Market in 4Q: Hedging Against Possible Rise in Capital Gains?

November 6, 2012 | 8:00 am | | Charts |


[click to expand]

This chart is an enlarged version of a chart that appeared within our just released Elliman Report: Hamptons/North Fork Sales. I’ve expanded it because I was struck by the randomness of activity in the $5M and up sector of the market (blue columns). Clearly the pattern follows the market stall after Lehman’s ’08 bankruptcy for a few quarters but otherwise, the sales don’t seem to follow a pattern, seasonal or otherwise.

The two quarters with a spike of 38 sales, 4Q 2010 and 2Q 2012 could be explained perhaps but the reasons aren’t that compelling in comparison to how much they stand out.

4Q 2010 The looming Bush tax cut expiration at the end of 2010 caused many sellers to bring high end properties and they were quickly absorbed.

2Q 2012 The prior quarter seemed to be an elevated spring surge.

4Q 2012 Will the 4th quarter see the same phenomenon as 4Q 2010? The capital gains implications are the same – will the Bush tax cuts be extended? – I’m not sure but our appraisal practice is inundated with valuation assignments of high end properties hedging against the potential end of year rise in capital gains tax.

The aftermath of Hurricane Sandy and the imminent Snor’eastercane may change the 4Q 2012 results.

Tags: ,


[Sandy] The SoPo New York Magazine Cover

November 4, 2012 | 6:47 pm | |

Since my company is located in neighborhood formerly known as “SoPo” (South of Power) I thought I’d post the amazing New York Magazine cover.

Tags: , , ,


Sandy Language Summary: Snor’eastercane, SoPo and a Sturdy Mailbox

November 2, 2012 | 5:36 pm | |

Remember this mailbox? It’s been through a lot. The photo is of my street in my CT home town, one of many downed trees and wires on my street. It’s been a long work week, especially since I haven’t been able to work much without power at home or work and it’s not nearly been a week since Sandy wreaked havoc on the Northeast US. My family and friends are safe and I feel very fortunate.

I’ve expanded or refreshed my vocabulary since Super-Storm Sandy – here’s my slow wifi, town library recap:

%$$%%!!! Your one word profanity-laden scream (insert word of your preference) when one of your favorite healthy 6-story shade trees falls down next to your house during the storm and you realize the storm is no longer an adventure (incidentally a tree falls really fast, not like in the movies).

OMG – The word you utter when your fireman son tells you about all the near misses with falling trees while they were out on the truck responding to emergency calls while your other adult child is taking pictures of the storm and submitting them to the local paper’s web site.

Boom of Doom – What my friend Michael Gross called the collapsed crane on West 57th Street, which forced the evacuation of his apartment nearby.

Zone A – A FEMA designation that few were familiar with (as appraisers we are) that now smoothly rolls off everyone’s tongue in everyday conversation.

Waterfront – That highly sought after real estate amenity that has everyone wondering if living away from the water would be better. Nah.

Flood – See “Waterfront”

“Coned” – The way a long-time Weather Channel anchor was pronouncing the NYC’s electric utility “Con-ed”

SoPo – (h/t to my friend Dan Alpert) was an overheard description for “South of Power” – Manhattan below 39th Street is without power. Of course, my office is located on 38th and remains dark.

NoPo – My alternative to “SoPo” and it is not location specific – it refers to anywhere that has power.

Electricity – It’s that crazy magical force that makes pretty much everything we rely on actually work and we only notice it when we don’t have it.

Primary (Service) Wire – The name my fireman son gave a large thick black wire – if you touch it while electricity is coursing through it – you catch on fire – incidentally one of these wires is still laying on my front lawn.

Snor’eastercane – The nickname given to the storm coming to our area next week bringing cold weather, snow and rain. Has it’s own twitter handle.

Sandy – A hurricane we won’t forget. Replaces “Back in ’38” with “Back in ’12”

Frankenstorm – See “Sandy”

Super-Storm – aka Mega-Storm. See “Sandy”

Puzzles – Those arcane cardboard pieces of art cut into odd shapes that you try to reconnect when you have no power and have to actually speak to your significant other and your kids.

YES!!!! – The near-expletive yelled with joy when we discovered our boat dock came within 6 inches of lifting over the piling and floating away with our boat. Always have a “YES!!!” “chambered” and ready to use it when your power turns back on.

UPDATE

Treemaggedon – What it felt like to see huge trees down all over our street and yard.

Tags: , , , ,


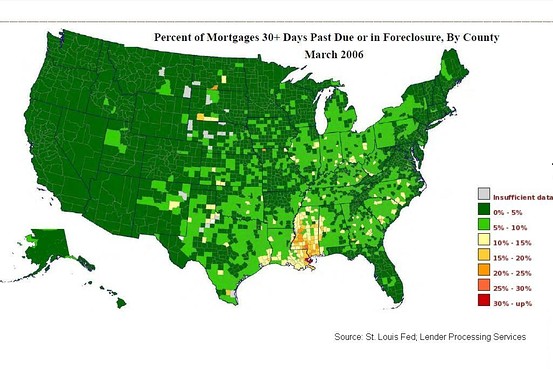
Visualizing US Distressed Sales – Katrina Edition

June 7, 2012 | 2:28 pm | |

The WSJ presented a series of charts on US distressed properties based on information from the St. Louis Fed (most proficient data generators of all Fed banks) and LPS.

Here are the first and last maps of the series. To see all of them, go to the post over at Real Time Economics Blog at WSJ.

A few thoughts:

  • The distress radiates out from New Orleans 7 months after Hurricane Katrina hit. There was relatively tame distressed sales activity in the US in 2006, the peak of the US housing boom.
  • The article makes the observation that distressed activity is seeing some improvement in 2010. However the “robo-signing” scandal hit (late summer 2010) and distressed activity entering the market fell for the next 18 months as servicers restrained foreclosure activity until the servicer settlement agreement was reached in early 2012. This is likely why the distressed heat maps show some improvement.
  • The music stopped when people couldn’t make their payments en mass circa 2006, the US national housing market peak. It’s quite astounding how quickly credit-fueled conditions collapsed across the US.

Tags: , ,


[Storm Track] Bank Failures Are A Category 2

September 2, 2008 | 12:01 am |

I turned on the TV this morning to catch an update on the hurricane in New Orleans, hoping it was better. Thank goodness no deja vu, the storm appeared to be less intense than originally feared. I flipped the channels and saw Geraldo Rivera holding an anemometer counting off the wind speed. It reached 70mph, and thought, this is simply perverse.

Despite all the coverage and worry, the FDIC has reported only 10 bank failures so far this year. Granted, there were only 3 in 2007, 4 in 2004, 3 in 2003, 12 in 2002, 4 in 2001 and 2 in 2000, but from all the coverage, I would have expected 50 by now. Of the failures this year, Indymac was the only biggie.

The watch list has grown from 90 to 117 (and Indymac wasn’t on the watch list).

The Federal Deposit Insurance Corporation, or FDIC, insures bank deposits of up to $100,000 at nearly 8,500 of the nation’s banks and also keeps a watch list of banks that it considers in trouble.

Thanks to a collapsing housing market and a weak economy, a growing number of banks are struggling to stay afloat, with not enough cash on hand to cover losses from bad loans.

At the beginning of the year, 90 banks were on the FDIC watch list. There are now 117, FDIC chairwoman Sheila C. Bair announced at a news conference this afternoon. That is the highest number in five years, but some analysts expect the list to grow even more in coming months.

This is supposed to be one of the biggest financial catastrophes in US history, no? In the 1980s FDIC removed nearly 2,000 institutions and S&L from the face of the earth. I remember the unbelievable stuff we saw as appraisers, performing workouts for RTC and FDIC in the early 1990s. Incredible stupidity abound.

Because it’s not all about the traditional banks…

It’s about the investment banks and the investors. Banks were able to shift the risk to third parties via securitization.


Tags: ,


Insurance Market Forces: Greater Than Category 5

May 14, 2007 | 9:08 am | |

One of the dire predictions (that pesky conventional wisdom thing again) of the post-Katrina US was the soon to be lack of homeowner’s insurance or at the very least, hard to get and very expensive post-war homeowner’s insurance.

But then a funny thing happened… (Peter Coy, in Businessweek’s Hurricane Ahead, But Lower Insurance:

In most of the country, property insurance rates for homeowners and businesses are actually lower than they were before Katrina. And amazingly, insurance rates have been falling recently in many parts of Florida and the Gulf Coast that stand to suffer severe losses from hurricanes, encouraging continued construction in low-lying areas.

Why?

  • No major hurricanes hit in 2006 and investment returns by the industry set a record.
  • Private equity firms, in search of returns, have poured money into bonds, betting on whether a hurricane will hit.
  • Florida government is keeping rate increases in check.
  • Insurance firms have fled Florida, driving up competition in other states, thereby lowering costs.
  • New companies have entered Florida, gambling there won’t be a major storm anytime soon, offering new and lower priced products.


Tags: ,


Talkin’ About The Weather Around The House (In Your Hip Boots)

March 12, 2007 | 10:47 am | |

After the nation was able to make it past the annual Sports Illustrated swimsuit edition, we were faced with an SI cover story on global warming.

One of the lessons from Hurricane Katrina and made official recently from climatologists, is that we are influencing to a certain degree, the weather. In fact, if we all go green right now, its probably too late to undo the damage. I had read somewhere that every mile of lost wetlands around New Orleans results in one foot of additional storm surge. The loss of wetlands over the past 50 years escalated the damage of Katrina…it wasn’t all about the levees.

A few degrees of warmer weather and a few inches of water can cause havoc in the housing market, especially with the surge (no pun intended) of second homes, of which a significant portion are located on coastal waterways and shoreline. There was an interesting cover story by Teri Rogers called The Real Riddle of Changing Weather: How Safe Is My Home? in last Sunday’s New York Times Real Estate section about consideration given to these changes in a high density urban market like New York City.

Click here for full sized graphic.

One of the take aways from the article for me was the potential underground damage to transportation and utilities and the rise in the use of glass in architectural design.

Incidentally, the FEMA flood zone maps for New York City haven’t been updated since 1983 and Battery Park City, which is a neighborhood created on the Hudson River from a landfill using the earth from the World Trade Center site isn’t even on the FEMA map. The maps still show the pre-existing piers. FEMA flood zone maps rate areas as zones of risk such as A5, B and C, usually in one hundred year increments. Perhaps, the time frame might need to be rethought.


Tags: , ,

Get Weekly Insights and Research

Housing Notes by Jonathan Miller

Receive Jonathan Miller's 'Housing Notes' and get regular market insights, the market report series for Douglas Elliman Real Estate as well as interviews, columns, blog posts and other content.

Follow Jonathan on Twitter

#Housing analyst, #realestate, #appraiser, podcaster/blogger, non-economist, Miller Samuel CEO, family man, maker of snow and lobster fisherman (order varies)
NYC CT Hamptons DC Miami LA Aspen
millersamuel.com/housing-notes
Joined October 2007