Matrix Blog

Posts Tagged ‘Contracts’

Contract Data Is Pending Data Is Lagging Data

April 29, 2020 | 11:50 am | Explainer |

In our post-Coronavirus world, it is clear that market conditions and our understanding of the future are subject to change every day. In my prior post Establishing the COVID-19 Demarcation Line: From ‘Hanks To Banks’, data that falls after the line represents a different market.

So how do we determine what data falls in after the demarcation line? It’s not as straightforward as it sounds.

Throughout my career, I have seen brokerage firms publish pending/contract reports, touting pending trends as more reliable than reports based on closings. I don’t look at them as better or worse, just a different way to look at the market. The simplistic, uninformed argument for pending sales is that contract dates occur before closing dates, so they are more current. Incidentally, contract prices are not readily shared. I get all of this. Yet I have seen the failure rate of contracts be as high as 40% – in other words, many contracts might not close whereas closing reports are solely based on successful transactions. Still, pending sale trends are useful as long as the reader understands their shortcomings. I plan to develop one someday.

Closing data and contract/pending data lags the “meeting of the minds.

Meeting of the minds (also referred to as mutual agreement, mutual assent, or consensus ad idem) is a phrase in contract law used to describe the intentions of the parties forming the contract. In particular, it refers to the situation where there is a common understanding in the formation of the contract.

While we know that closing dates lag the “meeting of the minds,” we also need to understand that signed contract dates are lagging indicators, often by 2-4 weeks. During this crisis, I’m speculating the failure rate will be high initially, and the time lag will be on the longer end rather than, the shorter end of this 2-4 week range.

Here’s why contract dates are a lagging indicator and not necessarily more insightful than closing data:

1) The “meeting of the minds” occurs when buyers and sellers negotiate price and terms, usually facilitated by a real estate agent or broker.

2) The price and terms are handed off to transaction attorneys who work together to craft language agreeable to both parties.

3) The contract is signed by both parties and often indicated as such in an MLS-type system.

4) In some markets or marketing periods, especially when a market is cooling, many contracts never close, so their initial inclusion makes pending trends reports suspect.

If there is a four week signed contract lag from the meeting of the minds, and considering the March 15 demarcation line for post-Coronavirus, that means that with us being six weeks into the crisis, we are only able to see two weeks worth of post-Coronavirus data. And even with that reality and current shelter in place rules, many current contracts might have been older deals that were facilitated by the buyer who had already inspected the home in January/February – we are seeing some of that now.

In other words, relevant data on the new market remains extremely limited.

Tags: , ,


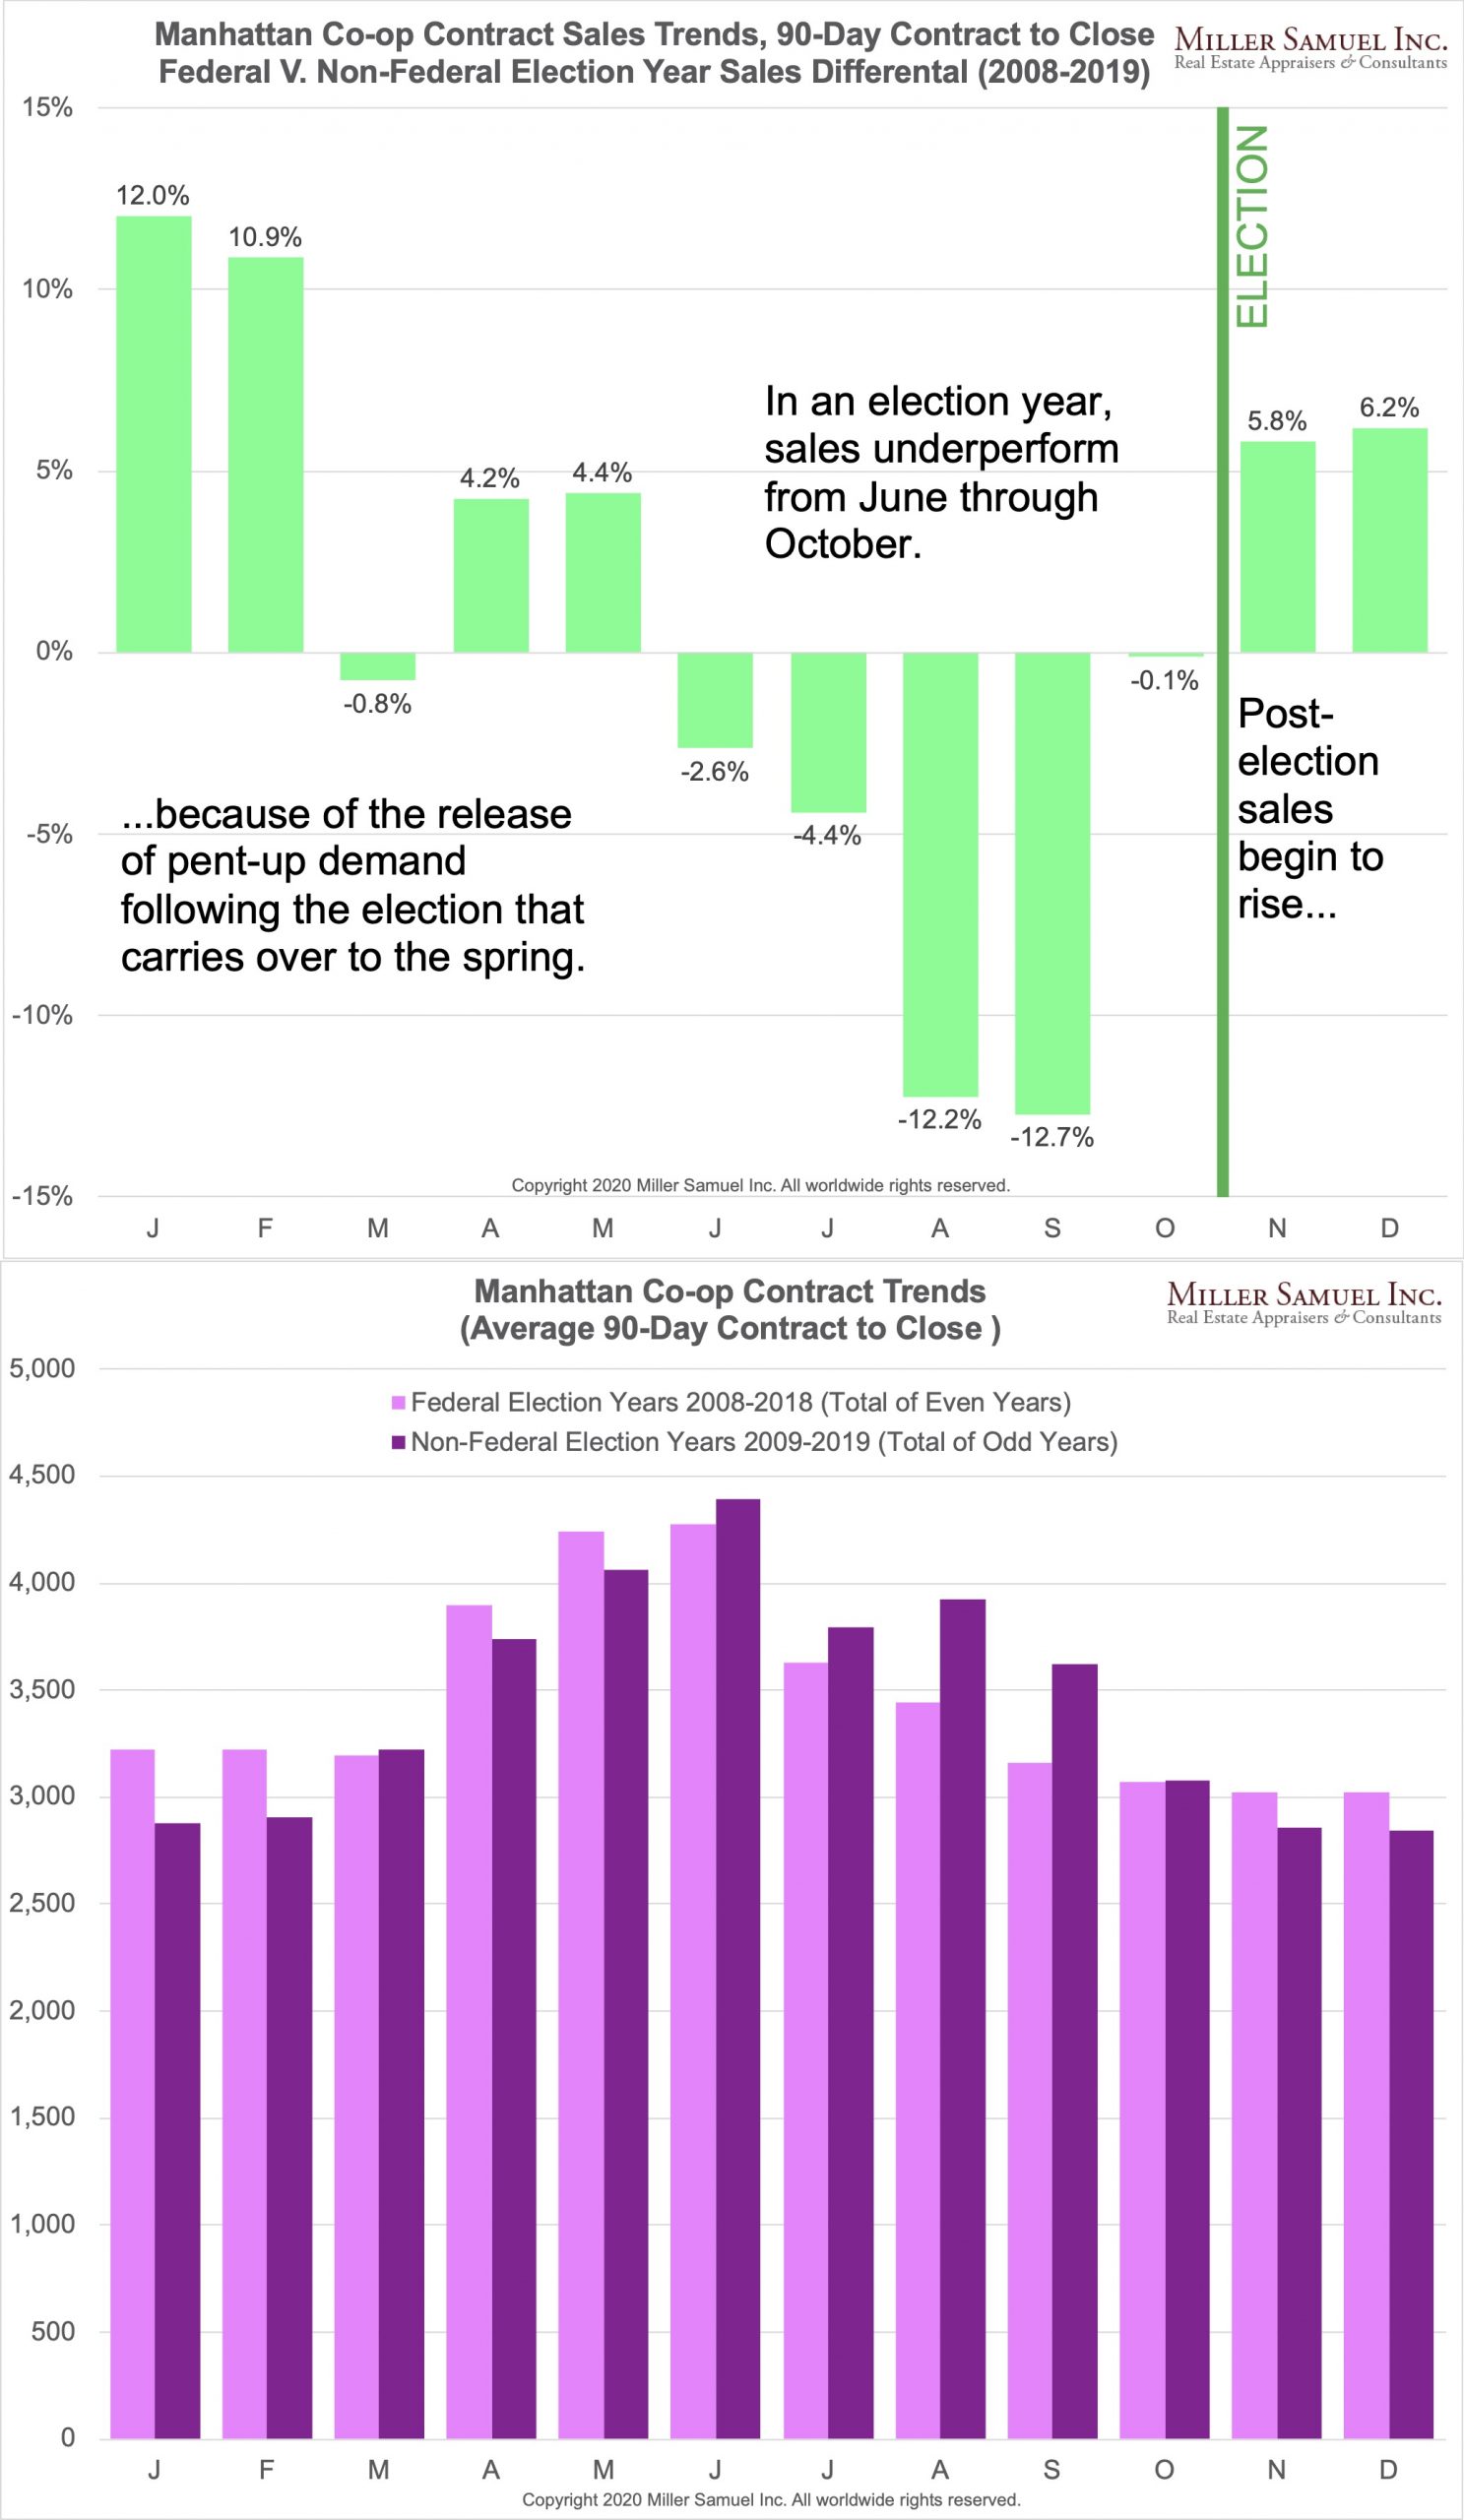
Manhattan Co-op Sales Fall During Federal Election Year

February 5, 2020 | 3:52 pm | | Charts |

For the past decade, I’ve been observing a pullback in sales in the summer of an election year and then a release in sales after the election into the new year, no matter the party or the candidate. I was speaking about this to Sylvia Varnham O’Regan at The Real Deal Magazine, and she asked me to prove it empirically.

So I did.

Her article: This is how presidential elections really affect home sales lays it out for the Manhattan market.

My methodology:

  • The data set was co-op based because they account for 74% of the apartment market and doesn’t have the wild fluctuation of contract versus closing date because of condo new development lags.
  • We don’t have all the contract dates for co-ops, but for those we do, they have been remarkably consistent at around 90 days. That 90-day average was applied to all the closing dates to reverse-engineer contract dates.
  • Contracts for even and odd years were compared: Even years represented federal election years, including midterms.

The results compared federal election years to non-federal election years, finding that beginning in June of an election year, sales were progressively weaker than their non-election year counterpart. The most significant difference occurred in September during an election year with a 12.7% weaker sales market than a non-election year. Beginning in November during an election year, sales overpower their non-election year counterpart, with the release of pent-up demand occurring well into the following spring.

Tags: , , ,


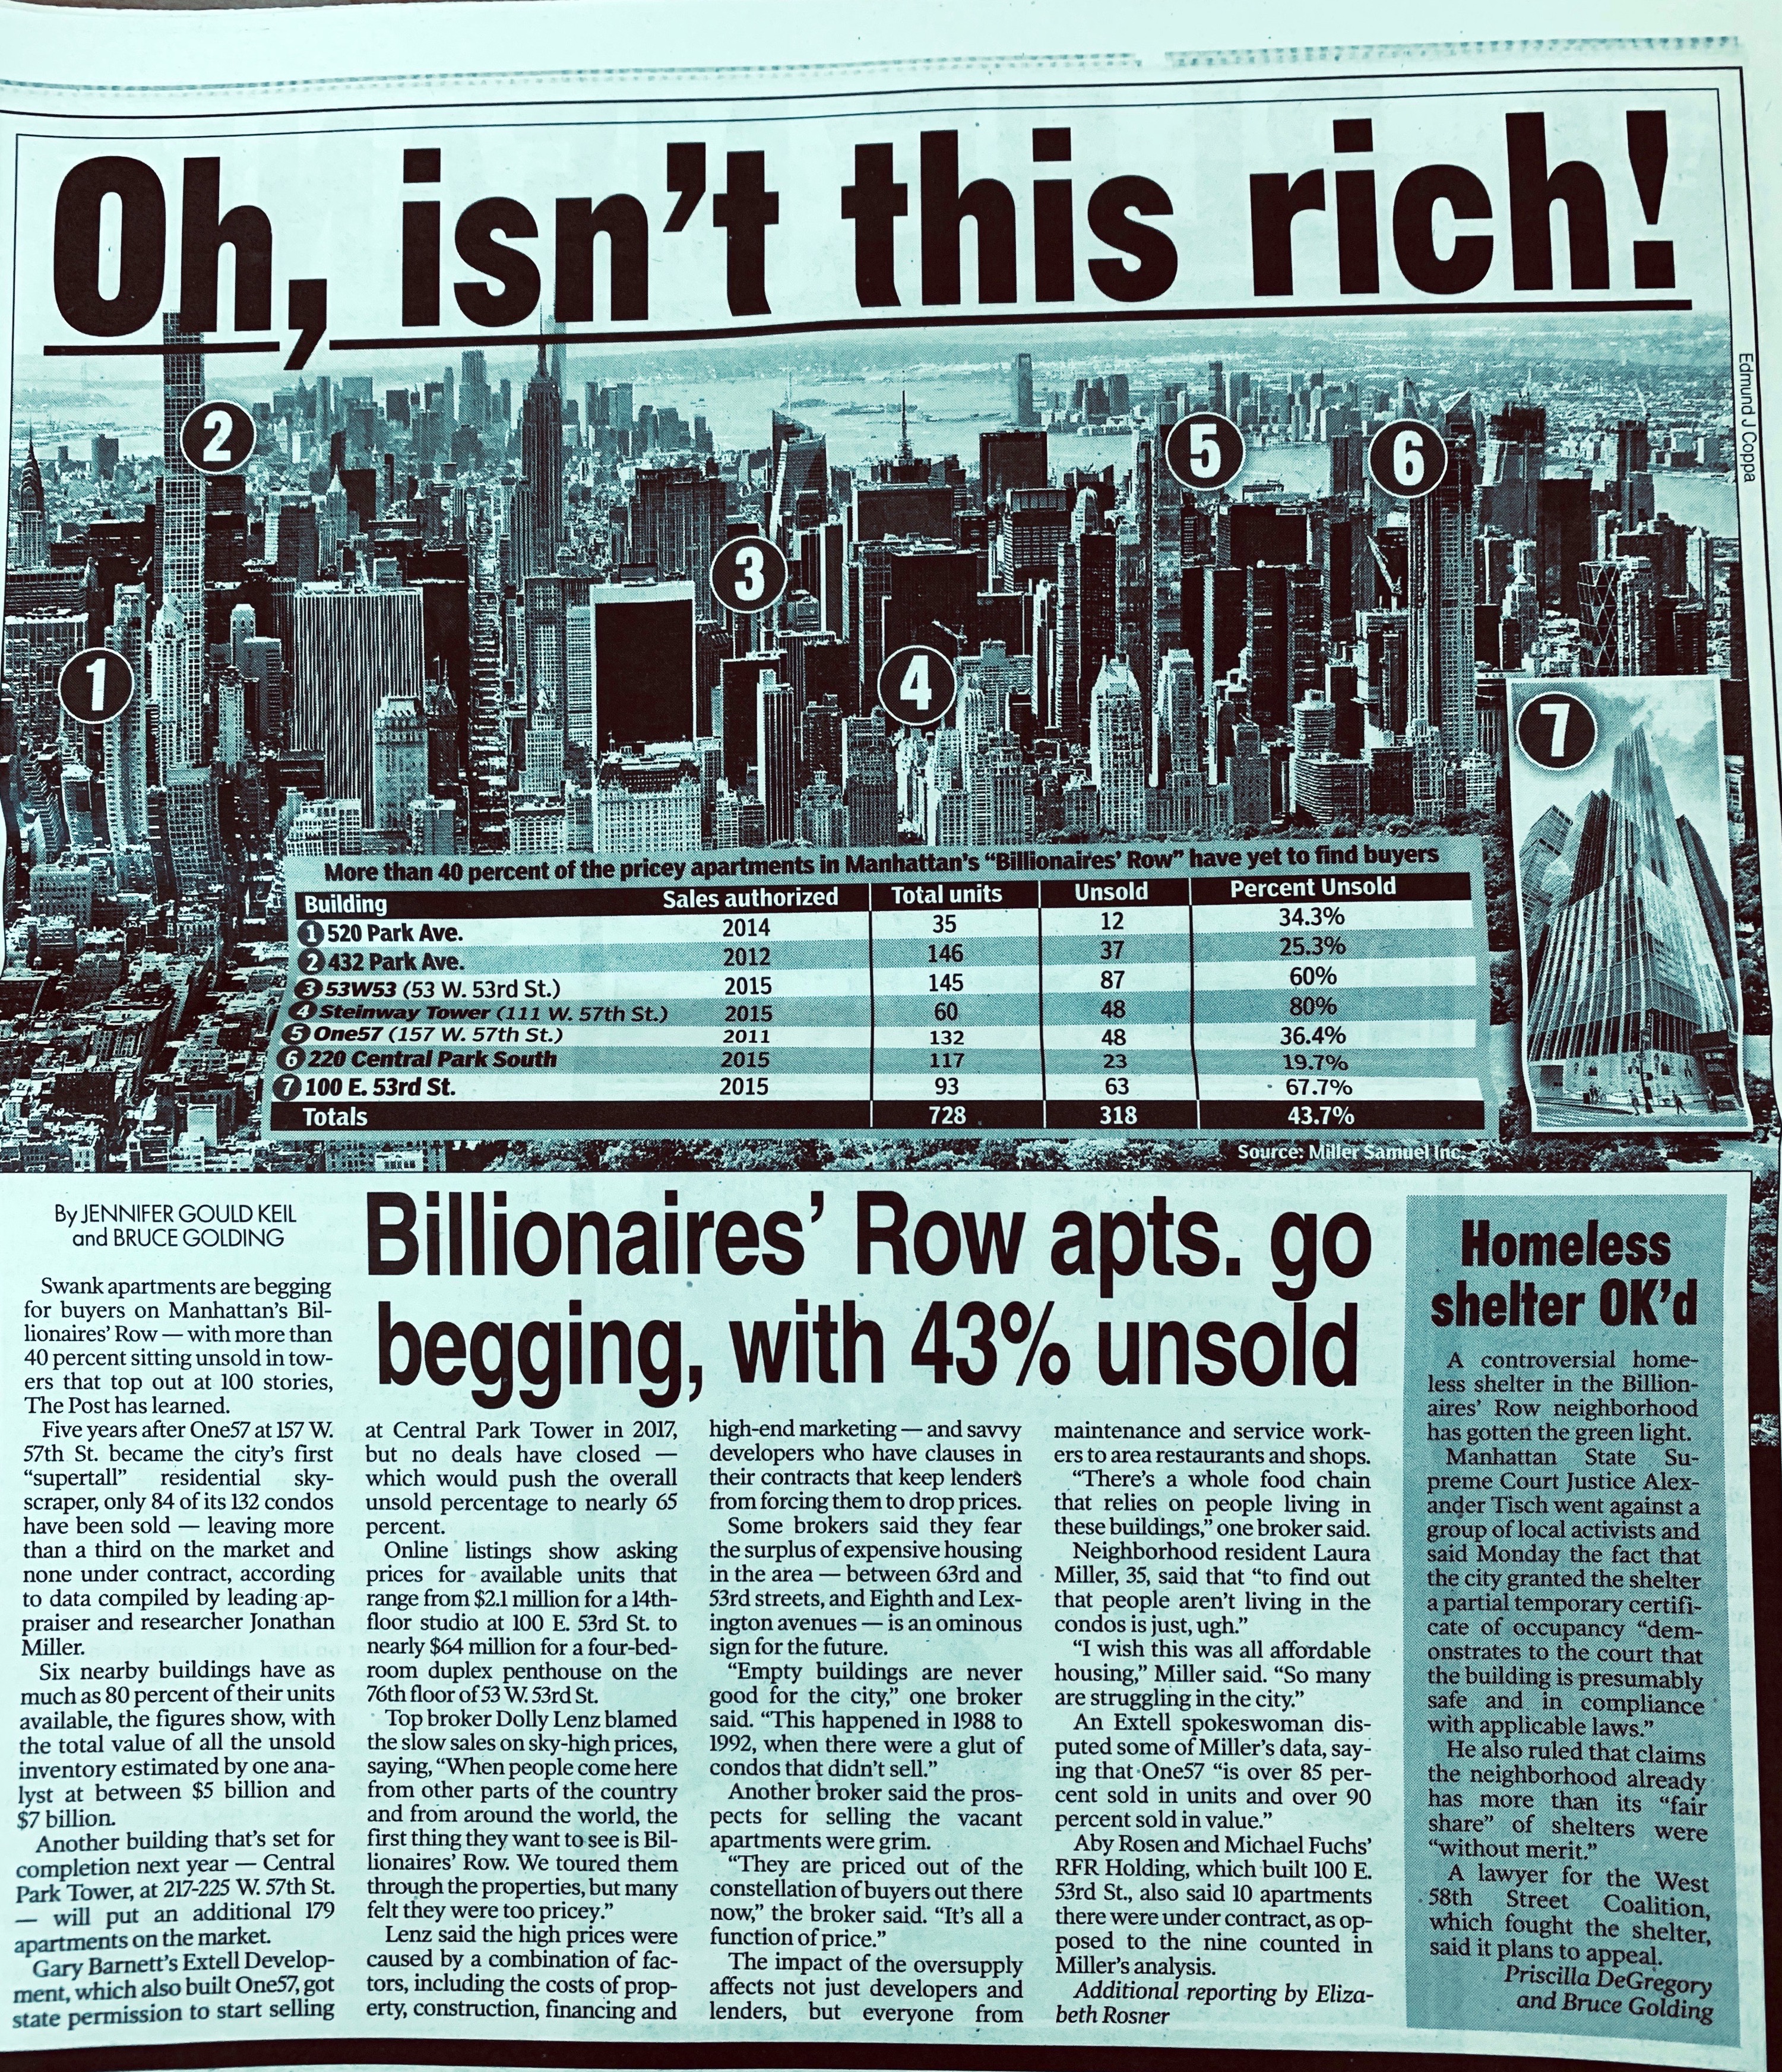
Billionaires Row Continues to be Challenged

May 4, 2019 | 11:09 am | Infographics |

It’s been no secret that super luxury Manhattan sales have been the hardest hit segment of the market since 2014. The slowdown is related to the oversupply of new development created from the vast amounts of capital looking for a home since the financial crisis. Perhaps the most famous representation of the super-luxury market has been “Billionaires Row” centered on 57th Street in the heart of Manhattan’s central business district in Midtown Manhattan. The introduction of supertalls to the skyline has provided never before expansive views to the buyers.

I was asked by the New York Post to provide a snapshot of this submarket. Since contract data is not public record and is easily manipulated, I estimated the state of the key buildings as best I could, using ACRIS for closed sales, Streeteasy contract tags, and feedback from market experts in and around the brokerage community. The result was really no surprise to anyone in the real estate business but because it was concentrated in one place, the story went viral. Curbed wrote a good follow-up as well.

Tags: , , , ,


[Three Cents Worth #281 NY] 6 Graphs That Prove New York Real Estate’s Love of Mondays

May 16, 2015 | 9:10 pm | | Charts |

It’s time to share my Three Cents Worth (3CW) on Curbed NY, at the intersection of neighborhood and real estate in the capital of the world…and I’m here to take measurements.

Check out my 3CW column on @CurbedNY:

After covering more serious topics as of late, this week I thought I’d lighten things up and look at New York city’s signed contracts by day of the week. I used the roughly 2,000 contract dates I had for the closed sales in Q1 of 2015, as used in the Elliman Report for that time period, and parsed out the market by day of the week. Strategically, there is probably nothing to be learned from this exercise, but hey, it’s an angle I’ve never examined before…


3cw5-6-15
[click to expand chart]


My latest Three Cents Worth column on Curbed: Three Cents Worth: 6 Graphs That Prove New York Real Estate’s Love of Mondays [Curbed]

Three Cents Worth Archive Curbed NY
Three Cents Worth Archive Curbed DC
Three Cents Worth Archive Curbed Miami
Three Cents Worth Archive Curbed Hamptons

Tags: , , , ,


Bloomberg View Column: Giant Condo Tower Needs More Billionaires

September 29, 2014 | 2:26 pm | | Charts |

BVlogo

Read my latest Bloomberg View column Giant Condo Tower Needs More Billionaires. Please join the conversation over at Bloomberg View. Here’s an excerpt…

In post-crash Manhattan’s high-end real estate, few projects loom larger or more visibly than the 1,004-foot-high One57, the tallest residential-hotel building in New York. This is a rarefied market, with two penthouse units selling for more than $90 million each, including one to hedge-fund baron Bill Ackman.

Amid all the hyperventilating about the tower, including complaints that it’s out of scale with the neighborhood, it’s poorly reviewed design and that it casts an afternoon shadow on Central Park in the winter, the little known fact is that the 92-unit building seems to be less of a hit with buyers than one might glean from the PR machine….

[read more]


My Bloomberg View Column Directory

My Bloomberg View RSS feed.

Tags: , , , , ,


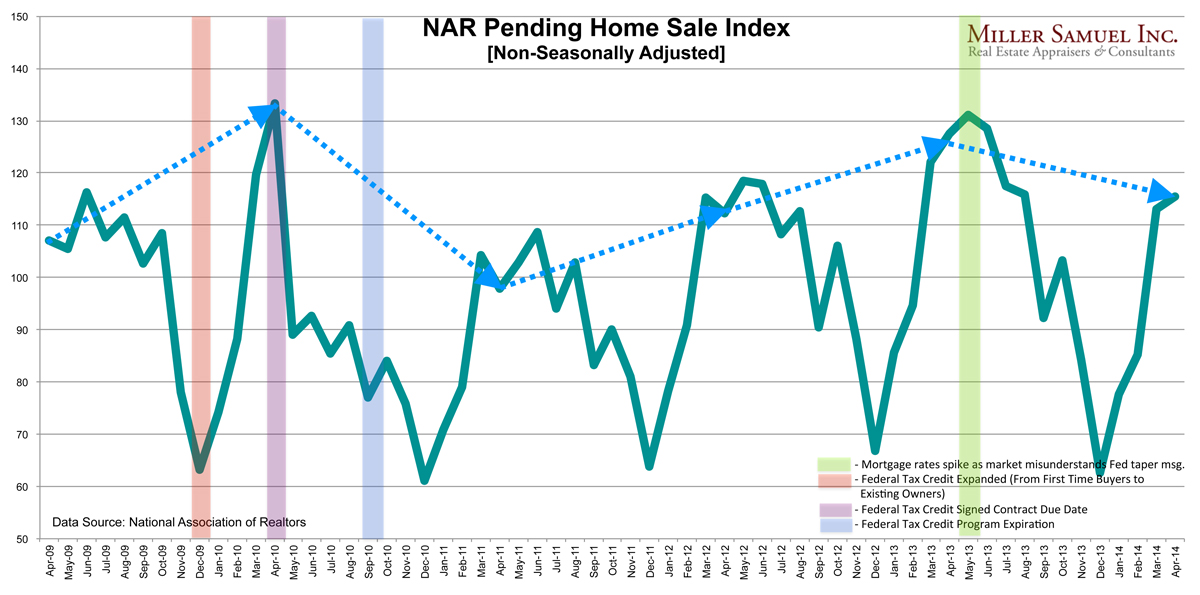
Pending Home Sales Fall Short of Year Ago Sales Surge

May 29, 2014 | 4:29 pm | Charts |

2014-april-phsi-05-29-2014
[click to expand]

The NAR released their Pending Home Sale Index today for April which aggregates signed contract data for the month. It is generally 2 months closer to the “meeting of the minds” between buyer and seller than their existing home sale report, that is based on closed sales (and 4 months faster than Case Shiller).

Pending Home Sales Index is not “forward looking”
In my chart above, and if you know me, I hate seasonal adjustments (SA) in housing data so this chart uses NAR’s reported numbers without adjustments. NAR always frames this release series as “forward looking” when it really is “less backward looking” because it is based on contracts, not closed sales. The end of May report reflects April contracts, half of which were probably signed in Late March. With a 2 month spread between contract and closing dates, this report is the most recent US housing market snapshot but nothing about it is actually “forward looking.”

With all the weather talk and mixed housing market messaging over the last month, this release brought us a broad range of interpretation, from “plunging” to “edging higher.”

Well, which is it? Or could it be both? Yes it can. We just need context.

According to Housingwire (uses SA numbers): Pending home sales plunge 9.2% in April So much for that post-winter, pent-up demand

Pending home sales for the month of April plummeted 9.2% compared to April 2013, the National Association of Realtors reported Thursday.

Contracts signed to buy existing homes increased 0.4% in April compared to March 2014, but that’s coming off three months of flat sales blamed on cold weather.

The expectation had been for at least a 2% gain month-over-month.

According to Diana Olick at CNBC (uses SA numbers), Pending home sales up just 0.4% in April, missing expectations

Warmer weather and higher expectations failed to cause a meaningful surge in home sales.

Signed contracts to buy existing homes increased just 0.4 percent in April, according to a monthly report from the National Association of Realtors (NAR). The expectation had been for at least a 2 percent gain sequentially.

The Realtors’ so-called pending home sales index is now 9.2 percent lower than April of 2013.

What’s going on?

If you look at the above chart you can see that last year’s pending home sales were surging up until May 2013, their highest level in 3 years (since the federal homeowner tax credit program as part of the stimulus). The surge in contracts in the first half of 2013 was born out of consumer fears that rates were going to rise. In addition, all the pent-up demand accumulated during the two year period preceding the US election and fiscal cliff deadline was released into the market. Many fence-sitters became decision-makers.

This winter’s harsh weather could have delayed buyers and we should be seeing this uptick in activity by now. We probably are seeing it but it no match for the year ago surge in activity but now the market is being characterized as weak or weakening. The problem with that description is it assumes that 2013 was a normal trend of an improving market. Well it wasn’t.

So yes, sales are down from the 2013 sales surge anomaly and the weather time-shifting buyers forward further into spring this year was no match for it. In fact, I suspect the next month will show the same type of “weakness” and the PHSI results probably can’t show real improvement at least until June.

Tags: , , , , ,


Best Real Estate Lawsuit Prose EVER

February 24, 2014 | 1:20 pm |

prosetext

Here’s an excerpt from a recent lawsuit for a NYC property that struck me as high art (modified to keep parties private).

…During the same timeframe in which the Sponsor insisted it was unable to restore service to the Condominium, it was somehow possible to locate and rescue 33 trapped miners in a remote region of Chile.

Tags:

Get Weekly Insights and Research

Receive Jonathan Miller's 'Housing Notes' and get regular market insights, the market report series for Douglas Elliman Real Estate as well as interviews, columns, blog posts and other content.

Follow Jonathan on Twitter

#Housing analyst, #realestate, #appraiser, podcaster/blogger, non-economist, Miller Samuel CEO, family man, maker of snow and lobster fisherman (order varies)
NYC CT Hamptons DC Miami LA Aspen
millersamuel.com/housing-notes
Joined October 2007