Matrix Blog

Queens

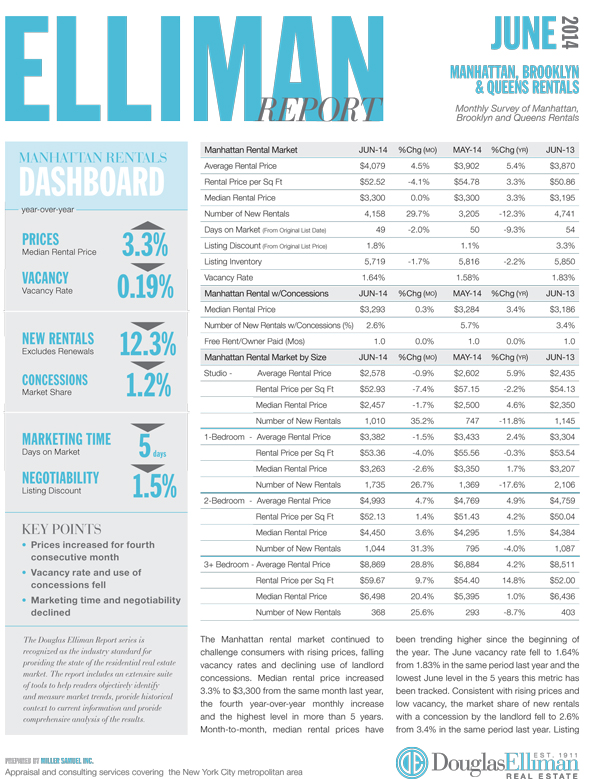
Adding Queens To Our Manhattan/Brooklyn Rental Report

July 14, 2014 | 9:12 am | | Reports |

Rental_0614

We’ve expanded the Elliman rental report to include Queens this month and added additional metrics for Manhattan and Brooklyn.

MANHATTAN
– Prices increased for 4th consecutive month after year end lull.
– Median rent is at highest point in more than 5 years.
– The vacancy rate was lowest June in 5 years.
– Use of concessions continued to fall, now at nominal levels.
– Marketing times and negotiability continued to fall.
– Luxury market outperformed the overall market.

BROOKLYN
[North, Northwest, East Regions]
– Median rental price up year over year for 13 consecutive months.
– Rents hovering near record highs but have remained stable since beginning of year.
– New rentals surged indicating resistance to price increases at time of renewal.
– Nominal use of concessions by landlords.
– Overall market outperformed luxury market, price growth stronger in smaller units.
– Manhattan-Brooklyn rental price gap remained at $500, more than the $210 record low in February but less than half of 2008 level.

QUEENS
[Northwest Region]
– Median rental price year-over-year slipped after 4 consecutive monthly increases.
– Shift in mix to smaller units (60.2% share of 1-bedrooms) pulling down overall prices.
– Nearly half of the rental stock is located in new development buildings.
– Overall market outperformed luxury market, price growth stronger in smaller units.
– Marketing time slipped as listing discount remained nominal.


The Elliman Report [Miller Samuel]
Miller Samuel Aggregate Database [Miller Samuel]
Chart Gallery [Miller Samuel]


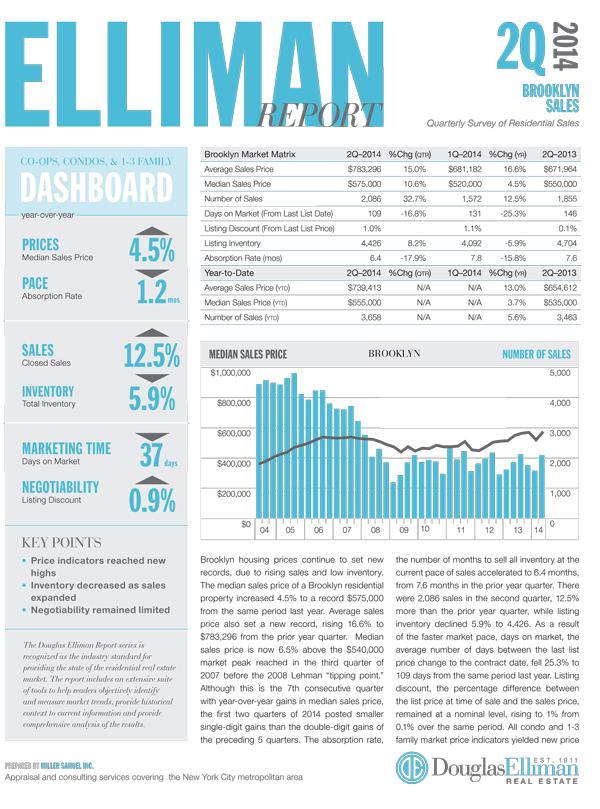
2Q14 Brings Mixed Regional Messages – Brooklyn, Queens and Westchester/Putnam Reports

July 14, 2014 | 8:53 am | | Reports |

If you’ve been:

A. Pouring over state maps of pet ownership
B. Watching the World Cup
C. Watching the Tour de France
D. Fretting about the Russell Stover purchase

Then you may have missed last week’s market report releases for Brooklyn, Queens and Westchester/Putnam Reports. These are part of the report series I’ve been writing for Douglas Elliman since 1994 (20 years!). The reports have a new look – hope you like them.

Click on graphics to open them.

Brooklyn_2Q_2014

BROOKLYN SALES MARKET Brooklyn housing prices continue to set new records, due to rising sales and low inventory. The median sales price of a Brooklyn residential property increased 4.5% to a record $575,000 from the same period last year. Average sales price also set a new record, rising 16.6% to $783,296 from the prior year quarter. Median sales price is now 6.5% above the $540,000 market peak reached in the third quarter of 2007 before the 2008 Lehman “tipping point.” Although this is the 7th consecutive quarter with year-over-year gains in median sales price, the first two quarters of 2014 posted smaller single-digit gains than the double-digit gains of the preceding 5 quarters…

Queens_2Q_2014

QUEENS SALES MARKET The Queens housing market took a breather after 6 consecutive quarters of rising sales. There were 2,404 sales in the second quarter, 3.6% less than the same period last year. Year to date, the number of sales remained 14.2% higher than the same period last year due to the sharp rise in first quarter sales activity. Despite the decline, listing inventory continued to fall for the 13th consecutive quarter. There were 5,892 listings at the end of the second quarter, 5.3% less than the same period last year. As a result of the combination of declining sales and falling inventory, the pace of the market remained stable…

Westchester_2Q_2014

WESTCHESTER/PUTNAM SALES MARKET Westchester single family contract activity was higher than prior year levels as severe winter weather conditions pushed first quarter pending sales into the second quarter. Despite the 16.7% decline in closed home sales, total contracts expanded 3.9% from the prior year quarter and jumped 51.9% from the prior quarter. The rise in contracts from first to second quarter was higher than the 35.5% average increase of the prior 2 years. Listing inventory expanded 7.9% to 3,905 rising from the low water mark set in 2013…


Miller Samuel Aggregate Database [Miller Samuel]
Market Chart Gallery [Miller Samuel]


[Video] TRD Forum: Getting A Sense of the New Development Frenzy

May 23, 2014 | 4:24 pm | | TV, Videos |

I stumbled across this clip taken at the recent New Development Showcase hosted by The Real Deal. The publisher and founder, Amir Korangy, pulls off a couple of well-timed video-bombs!

This video gives you a good sense of the excitement, if not frenzy in the residential development space in New York City. There was a long line of people waiting to enter the venue for the event when I arrived.

Tags: , , , ,


Floored: Can/Should A Governing Body Set Minimum Sales Prices?

May 6, 2014 | 2:47 pm |

woodfloored

The concept of “setting a price floor” applies to gated communities, homeowner associations, planned unit developments – in fact any situation where a central governing body has direct influence over the sales price and/or buyer of your property. I believe the idea of “setting price floors” is surprisingly common in the outer boroughs of NYC, especially Queens.

Let me back up a second to provide context.

As the Manhattan market peaked in 2007/2008, we began to observe some co-op boards setting floors to prices in their buildings to “maintain value” for their shareholders. While a fiduciary responsibility, it is steeped in contradictions to free market principles. There was a great New York Times summary piece about this practice back in June 2007: “Should Co-op Boards Set ‘Floor Prices’?

About 15 months after the NYT article was written Lehman Brothers had collapsed and AIG, Fannie Mae and Freddie Mac were all bailed out. Manhattan sales prices had fallen about 30% from 2008 to 2009. During this period I observed an increase in the practice of setting price floors. A hypothetical scenario (the type I often observed first hand) for – let’s call it – “Apartment XXX” and the timeline might go something like this:

  • Sold in 8/2007 for $1,000,000
  • Listed in 8/2008 for $1,100,000
  • Zero activity until 1/2009, offered $700,000. Offer rejected by shareholder.
  • Offer made by new buyer in 2/2009, offered $705,000. Offer rejected by shareholder.
  • Offer made by new buyer in 3/2009, offered $700,000. Offer accepted by shareholder.
  • Board turndown – “price too low.”
  • Offer made by new buyer in 4/2009, offered $695,000. Offer rejected by shareholder.
  • Offer made by new buyer in 5/2009, offered $710,000. Offer accepted by shareholder.
  • Board turndown – “price too low.”
  • Taken off market by shareholder.

A co-op board CAN’T dictate sales prices
It is clear from the steady stream of new offers in my hypothetical that the market had reset to a significantly lower level during the year. If that was the case (it was), then the board was actually doing a disservice to their shareholders by making their apartments essentially unsaleable. A buyer isn’t going to pay what the seller or the board wants the price to be. Econ 101. Housing market prices change over time, hopefully rising more than falling in the long run. The brokerage community also has a fiduciary responsibility to get the highest price for their seller under market conditions at that time. Although the board is trying to protect their shareholders (and themselves as shareholders), they have in effect, temporarily nullified the market in their building. The brokerage community is less likely to bring offers to sellers because they assume the board will reject the price even though the property had been properly exposed and vetted in the marketplace.

A co-op board CAN protect their shareholder against price outliers
One of the misnomers of the “setting a price floor” discussion is the fact that appraisal quality for lenders has been decimated since the financial crisis as banks now fully rely on appraisal management company ie “AMC” appraisers and most have no “local market knowledge.” An out of market appraiser will likely be more influenced by outliers than a local appraiser because the out of market appraiser is data starved and has no experience in the nuances of that market. It is clearly prudent for a board to be vigilant about outliers as reflected in the video. I’ve consulted on transactions for boards that don’t represent market value – ie the heir or executor lives on the other side of the country, doesn’t care about the market value and simply wants to dump the unit, make some money and move on. The out of market appraiser will probably use that sale as a “comp.”

“Protecting against outliers” is very different than “controlling prices” in a market.

In the outer boroughs especially in Queens, I believe the practice of setting a price floor has remained a widespread practice for years. Here’s a co-op attorney who is providing tips on how to “maintain values” on Habitat Magazine‘s web site. Concepts like setting up “sliding scales” to sell at 95% of the average of past sales may work in a stable market but worry me because the co-op won’t be able to respond to downturns and is in danger of choking off the market, potentially depressing prices even more.

This video also talks about apartments being different in condition and boards need to consider this because real estate appraisers don’t take into consideration whether or not an apartment was renovated.

No! This is absolutely an incorrect or the appraiser is not being asked to provide an opinion of market value – appraisers are supposed to take condition into consideration if they are being requested to provide an opinion of market value.

As I mentioned earlier, with the proliferation of AMCs, appraisers working for retail banks are generally being paid 50% of the market rate and can’t or won’t confirm condition of their comps. Higher up banking executives don’t yet equate appraisal fees with appraisal quality.

“Maintaining Value” in a co-op (or multi-unit housing entity with a governing body) Here are a few (non-legal) valuation thoughts on “maintaining” values in a co-op. I’ve personally always taken this to mean that the corporation is run efficiently for the benefit of the shareholders and when that happens, property values are “maintained” relative to the market. I also believe their values will ebb and flow with the world that surrounds the building – ie supply, demand, credit, interest rates, economy, employment, etc. These are outside factors tend to be things that the board has no control over. If the board takes actions to control “market forces” they can potentially damage shareholder value and they are potentially not fulfilling their fiduciary responsibilities.

Tags: , ,


Ready, Set, Download: 1Q 2014 Market Reports for Brooklyn, Queens and Westchester/Putnam Sales

April 12, 2014 | 1:49 pm | |

We released 3 reports for Douglas Elliman on the sales markets for Brooklyn, Queens and Westchester/Putnam this week. Click on the reports to download!

Brooklyn_1Q_2014 BROOKLYN The Brooklyn housing market was characterized by more modest price growth and chronic lack of inventory, holding back sales growth. Median sales price expanded 1% to $520,000 from the same period last year and the highest first quarter result in 6 years. Average sales price grew 7.3% to $681,182 over the same period. Co-ops posted the largest year-over-year gain in median sales price, rising 12.2% to $340,000 but lost 2.1% of the market share. Condos remained essentially unchanged over the year with a $625,000 median sales price and market share edged 1.6% higher. The 1-3 family median sales price increased 5.1% to $588,733 and market share increased a nominal 0.5%…

Queens_1Q_2014 QUEENS The first quarter Queens housing market was a period of rising prices after an extended period of stability, declining inventory, and rising sales. The bottom of the multi-year decline of listing inventory may have been reached in the fourth quarter of 2013. Although the first quarter listing inventory increased 7% from the prior quarter bottom to 5,617, it was the second lowest level recorded in this report series since 2005 and 13.5% below prior year levels. The number of sales jumped 32.8% to 3,156 from the prior year quarter, the highest first quarter total in 6 years. The combination of declining inventory and rising sales led to a faster market pace. The absorption rate, the number of months to sell all listing inventory at the current pace of sales, fell to 5.3 months, less than half the 11.2 month average over the past 5 years…

Westchester_1Q_2014 WESTCHESTER The Westchester housing market saw the most first quarter sales in 7 years, the highest median sales price in 6 years and initial signs that the trend of declining inventory may be ending. There were 1,525 sales in the first quarter, up 13.1% from the prior year quarter and the most first quarter sales since the same period 7 years ago. Listing inventory fell 3.7% to 5,378 from the same period last year and for the 8th consecutive quarter. With the rise in the number of sales and the decline in listing inventory, the pace of the market was faster. The monthly absorption rate, defined as the number of months to sell all inventory at the current pace of sales, fell by 1.8 months to 10.6 months from the prior year quarter…
PUTNAM After bottoming out two years ago, housing prices have generally trended higher as the number of sales expanded and inventory contracted. All price indicators posted gains from prior year levels. Median sales price increased 12.7% to $302,500 while average sales price rose 15.9% to $379,217 over the same period…

Tags:


3Q 2013 Market Report Gauntlet Comes to a Close

October 26, 2013 | 5:15 pm | | Reports |

This week marked the end of what I call the “quarterly gauntlet” market report releases that I author for Douglas Elliman. If you’re interested, we’ve analyzed a bunch of markets:

NYC Metro Area
Manhattan Sales
Manhattan & Brooklyn Rentals
Brooklyn Sales
Queens Sales
Westchester/Putnam Sales
Long Island Sales
Hamptons Sales
North Fork Sales

South Florida
Miami Sales
Boca Raton Sales
Fort Lauderdale Sales
Palm Beach Sales

I’ve been writing this expanding report series for Douglas Elliman since 1994. You can also build custom data tables on information included in the reports using our aggregate database and a growing library of market charts.


[Three Cents Worth #246 NY] Considering Manhattan as a Boom Town

September 11, 2013 | 1:47 pm | | Charts |

It’s time to share my Three Cents Worth (3CW) on Curbed NY, at the intersection of neighborhood and real estate in the capital of the world…and I’m here to take measurements.

Check out my 3CW column on @CurbedNY:

I thought I’d present some metrics across all all five boroughs to show a little context to Manhattan. This chart trifecta shows market dollar volume, change in sales and change in prices by borough since 2004…

[click to expand chart]


My latest Three Cents Worth column on Curbed: Considering Manhattan as a Boom Town [Curbed]

Three Cents Worth Archive Curbed NY
Three Cents Worth Archive Curbed DC
Three Cents Worth Archive Curbed Miami
Three Cents Worth Archive Curbed Hamptons

Tags: , ,


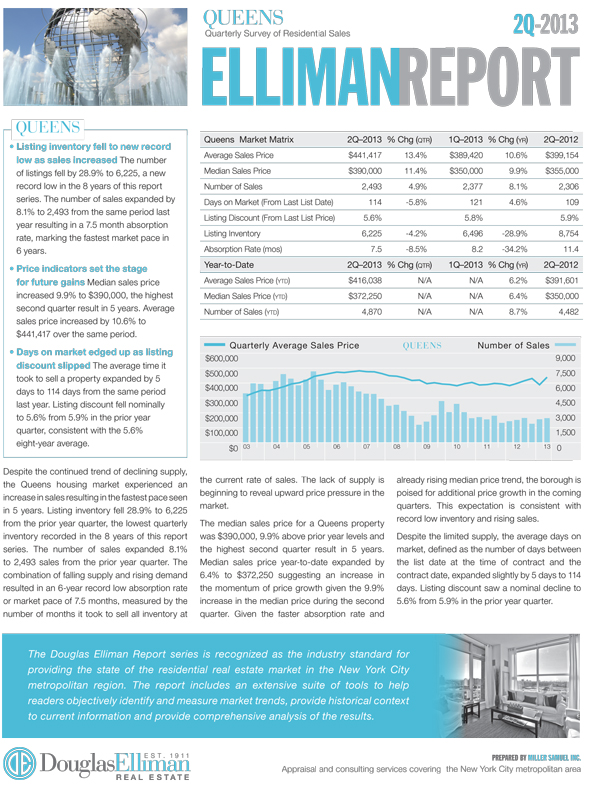
[Help From Brooklyn] 2Q 2013 Queens Report

July 11, 2013 | 9:41 pm | | Reports |

Douglas Elliman just published the market report on the Queens sales market that we author. This is part of an evolving market report series I’ve been writing for Douglas Elliman since 1994.

Key Points

  • Inventory remained at 8-year low.
  • Sales increased causing fastest absorption rate in 5-years.
  • Upward price pressure from lack of supply is apparent.
  • Market benefiting from Manhattan and Brooklyn market tightness.

Here’s an excerpt from the report:

…Despite the continued trend of declining supply, the Queens housing market experienced an increase in sales resulting in the fastest pace seen in 5 years. Listing inventory fell 28.9% to 6,225 from the prior year quarter, the lowest quarterly inventory recorded in the 8 years of this report series. The number of sales expanded 8.1% to 2,493 sales from the prior year quarter. The combination of falling supply and rising demand resulted in an 6-year record low absorption rate or market pace of 7.5 months, measured by the number of months it took to sell all inventory at the current rate of sales. The lack of supply is beginning to reveal upward price pressure in the market…

Our data tables and market charts are now updated with 2Q13 data.

Press coverage


The Elliman Report: 2Q 2013 Queens Sales [Miller Samuel]
The Elliman Report: 2Q 2013 Queens Sales [Douglas Elliman]
Aggregated Custom Market Data Tables [Miller Samuel]
Queens Market Charts [Miller Samuel]

Tags:


[Stability With Less] 1Q 2013 Queens Report

April 11, 2013 | 3:10 pm | | Reports |

Douglas Elliman just published the market report on the Queens sales market that we author. This is part of an evolving market report series I’ve been writing for Douglas Elliman since 1994.

Key Points

  • Listing inventory fell to 8-year low.
  • Release of pent-up demand as number of sales increased despite low supply.
  • Prices showed modest gains.
  • Low mortgage rates continue to play important role in demand.


Here’s an excerpt from the report:

…The key market characteristic of the Queens housing market in the first quarter was the scarcity of supply. This condition kept housing prices stable and combined with record low mortgage rates, brought buyers and sellers close together when negotiating price. Price indicators showed across the board gains from the same period last year. Median sales price edged 1.1% higher to $350,000 from the same period last year and average sales price increased 1.5% to $389,420 over the same period. There were 6,496 listings at the end of the first quarter, an 8-year record and 26.6% less than in the same period last year…

Our Queens data tables are now updated for 1Q13 and charts will be available soon.


The Elliman Report: 1Q 2013 Queens Sales [Miller Samuel]
The Elliman Report: 1Q 2013 Queens Sales [Douglas Elliman]
Aggregated Custom Market Data Tables [Miller Samuel]


[7-Year List Low] 4Q 2012 Queens Report

January 21, 2013 | 10:21 pm | | Reports |

We recently published our report on the Queens sales market for 4Q 2012. This is part of an evolving market report series I’ve been writing for Douglas Elliman since 1994.

Key Points

  • Although year-over-year inventory slipped nominally, it was the lowest fourth quarter total in 7 years.
  • Price indicators up from same period last year year.
  • Number of sales declined from year ago levels restrained by limited inventory.
  • Luxury market prices rise but not at pace of overall market.
  • Mortgage underwriting remains “irrationally tight” but record low mortgage rates and improving employment continue to drive demand.

Here’s an excerpt from the report:

…In the final quarter of 2012, the Queens housing market saw a sharp year-over-year bump in prices, a modest slip in sales and listing inventory, shorter marketing times, and less negotiability between buyers and sellers. The historically tight mortgage underwriting standards continued to hold the impact of record low mortgage rates in check.

Both price indicators pressed above prior year levels. Median sales price was up 13.7% from the prior year quarter at $390,000, the highest level in nearly 4 years. Average sales price showed a similar result, rising 9.4% to $432,503 over the same period. All market quintiles generally saw gains in median sales price compared to the prior year period…

Our Queens data tables are now updated for 4Q12 and charts will be available soon.


The Elliman Report: 4Q 2012 Queens Sales [Miller Samuel]
The Elliman Report: 4Q 2012 Queens Sales [Douglas Elliman]
Aggregated Custom Market Data Tables [Miller Samuel]


Sandy Aftermath – 60 Minutes Story on Belle Harbor, Queens, New York

November 12, 2012 | 6:56 pm | TV, Videos |

A few thousand people in Belle Harbor have endured so much – inspirational – community. This is one of many areas devastated by Hurricane Sandy in NYC region. And it’s why I feel so petty when asked about what happened to us in the storm – that I lost power for 5 days. They faced losses from 9/11, a jet crashing in their neighborhood in 2001 and now Sandy.

Good grief.

Tags: , ,


[Falling Supply] 3Q 2012 Queens Report

October 20, 2012 | 8:00 am | | Reports |

We published our report on the Queens sales market for 3Q 2012.   This is part of an evolving market report series I’ve been writing for Douglas Elliman since 1994.

Key Points

  • Listing inventory declined, marketing time and listing discount fell sharply.
  • Sales below year ago levels.
  • Overall pricing indicators mixed, prices generally stable.
  • Luxury pricing edged above year ago levels.
  • Condo and 1-3 family sales down, co-op sales are up.
  • Northwest and West Queens showed most improvement.

Here’s an excerpt from the report:

…The third quarter Queens housing market was characterized by stable pricing, falling inventory, sliding sales, faster marketing times and less price negotiability between sellers and buyers. The slide in sales despite record-low mortgage rates was largely due to declining inventory levels and irrationally tight mortgage underwriting standards.

Listing inventory continued to fall. There were 9,052 listings at the end of the third quarter, 12.2% below the prior year total of 10,305. The number of sales followed a similar trend, as lower inventory began to temper sales activity. There were 2,509 sales in the third quarter, 8.5% fewer than 2,743 sales in the same period last year. The monthly absorption rate, the number of months to sell all active inventory at the current pace of sales, was 10.8 months, faster than 11.3 months a year ago but consistent with the 10.6-month 7-year average…

Updates to our Queens data NOW UPDATED FOR 3Q12 and charts will be available soon.


The Elliman Report: 3Q 2012 Queens Sales [Miller Samuel]
The Elliman Report: 3Q 2012 Queens Sales [Prudential Douglas Elliman]

Tags:

Get Weekly Insights and Research

Housing Notes by Jonathan Miller

Receive Jonathan Miller's 'Housing Notes' and get regular market insights, the market report series for Douglas Elliman Real Estate as well as interviews, columns, blog posts and other content.

Follow Jonathan on Twitter

#Housing analyst, #realestate, #appraiser, podcaster/blogger, non-economist, Miller Samuel CEO, family man, maker of snow and lobster fisherman (order varies)
NYC CT Hamptons DC Miami LA Aspen
millersamuel.com/housing-notes
Joined October 2007