Matrix Blog

Miami (Beach + Mainland)

[Ready, Set, Download] South Florida Market Reports 1Q 2014

April 18, 2014 | 4:01 pm | | Reports |

Our 4 comprehensive reports for Douglas Elliman on the residential sales markets for Miami, Boca Raton, Fort Lauderdale and Palm Beach this week.

Click on each report to download!

Miami_1Q14

MIAMI
With the Miami housing market well into the third year of its recovery, rising prices have begun to pull listing inventory into the market. Median sales price increased 16.1% to $244,000, the highest point reached since 2008. Average sales price jumped 19.1% to $461,374 over last year to a 5 year high and average price per square foot exceeded $305 per square foot for the first time in 6 years. Listing inventory bottomed in the second quarter of 2013, trending higher, up 15.2% to 12,664 from the prior year quarter. Along with the rise in supply, demand continued to rise. The number of sales rose 3.9% to 5,133 from the prior year quarter, to the highest first quarter total in the 8 years this metric has been tracked. The market share of distressed sales, once the majority of the market, continued to decline. Excluding short sales and foreclosures, market share rose to 69.4%, the highest level reached in the 4 years this metric has been tracked. The number of distressed listings and distressed With the Miami housing market well into the third year of its recovery, rising prices have begun to pull listing inventory into the market. Median sales price increased 16.1% to $244,000, the highest point reached since 2008. Average sales price jumped 19.1% to $461,374 over last year to a 5 year high and average price per square foot exceeded $305 per square foot for the first time in 6 years…

BocaRaton_1Q14

BOCA RATON
CONDO Median sales price surged 16.3% to $150,000 and average sales price declined 8.8% to $229,569 respectively from the prior year quarter. Listing discount, the percent difference between the list price at time of contract and the sales price, rose to 7% from 3.8% in the prior year quarter, but fell from 7.7% in the prior quarter…

SINGLE FAMILY Median sales price jumped 19.4% to $370,000 and average sales price rose 5.3% to $528,616 respectively from the prior year quarter. Listing discount edged up to 6.9% from 6.1% in the prior year quarter, as sellers were slightly more optimistic when determining their listing price…

FtLauderdale_1Q14

FORT LAUDERDALE
CONDO Median sales price jumped 19.8% to $255,000 from the same quarter last year, the highest level reached since 2008. Average sales price followed the same pattern, rising 23.9% to $379,391 over the same period also reaching a 5 year high.

SINGLE FAMILY The average time to market a property was 91 days, essentially unchanged from 90 days in the prior year quarter. Listing discount, the percentage difference between the list price at time of contract and the sales price, jumped to 8.1% from 4.5% as sellers pressed list prices higher than market trends support.

PalmBeach_1Q14

PALM BEACH
CONDO There were 68 sales during the quarter, 25.9% more than the same period last year. Listing inventory fell 16.9% to 360 over the same period. As a result the absorption rate, the number of months to sell all inventory at the current pace of sales, fell 34% to 15.9 months from the same period last year. The faster market pace pushed down days on market, the number of days from the last price change to the contract date, by 10 days to an average of 182 days.

SINGLE FAMILY Median sales price increased 10.7% to $3,100,000 from the prior year quarter to the highest first quarter reached since 2009. Average sales price jumped 56.7% to $6,450,093 over the same period. The average square footage of a sale was 5,261, up 20.9% from the prior year quarter.

Tags:


Overwhelming Visual Recap of Prior ‘Three Cents Worth’ Columns #250 to #256

February 3, 2014 | 8:31 pm | | Charts |

Ok, that’s a lot of hyperbole, the charts do look pretty cool all lined up below. Although the Matrix blog was quiet as we transitioned to a new web site, I still wrote a bunch of posts on Curbed over the past several months and thought I’d share. Here’s the list. Click on each blog title to go to the full post.

December 18, 2013 Curbed NY #256 Finding 2014 Clues In Oft-Overlooked Data 3cwNY12-18-13

December 10, 2013 Curbed NY #255 Dogging Manhattan Apartment Values 3cwNY12-10-13

December 3, 2013 Curbed NY #254 Tallest Rental Chart in Manhattan History 3cwNY12-3-13thumb

November 27, 2013 Curbed NY #253 Charting Manhattan’s So Not Tryptophan-Like Absorption Rate 3cwNY11-27-13

November 19, 2013 Curbed NY #252 Sales Prices Way More Volatile Than Rents 3cwNY11-19-13

November 14, 2013 Curbed NY #251 Manhattan Listings May Have Bottomed 3cwNY11-14-13


Three Cents Worth Archive Curbed NY Three Cents Worth Archive Curbed DC Three Cents Worth Archive Curbed Miami Three Cents Worth Archive Curbed Hamptons

Tags: , , , ,


[Three Cents Worth #249 Miami] The Miami Housing Trend Breakdown

October 28, 2013 | 7:56 pm | | Charts |

It’s time to share my Three Cents Worth (3CW) on Curbed Miami, at the intersection of neighborhood and real estate in the Magic City. And I’m taking notes on the beach.

Check out my 3CW column on @CurbedMiami:

Miami has become a market with a lot of moving parts so it’s best not to throw all the data into one bucket and call it a day. Last week Douglas Elliman released the 4 South Florida market reports I author for them including Miami and this week’s charts were taken from data compiled in the report. I presented a bunch of metrics in the single family and condo market broken out by the distressed and non-distressed markets. Distressed property are defined here as short sales and foreclosures…

[click to expand chart]


My latest Three Cents Worth column on Curbed: The Miami Housing Trend Breakdown [Curbed]

Three Cents Worth Archive Curbed NY
Three Cents Worth Archive Curbed DC
Three Cents Worth Archive Curbed Miami
Three Cents Worth Archive Curbed Hamptons

Tags: , ,


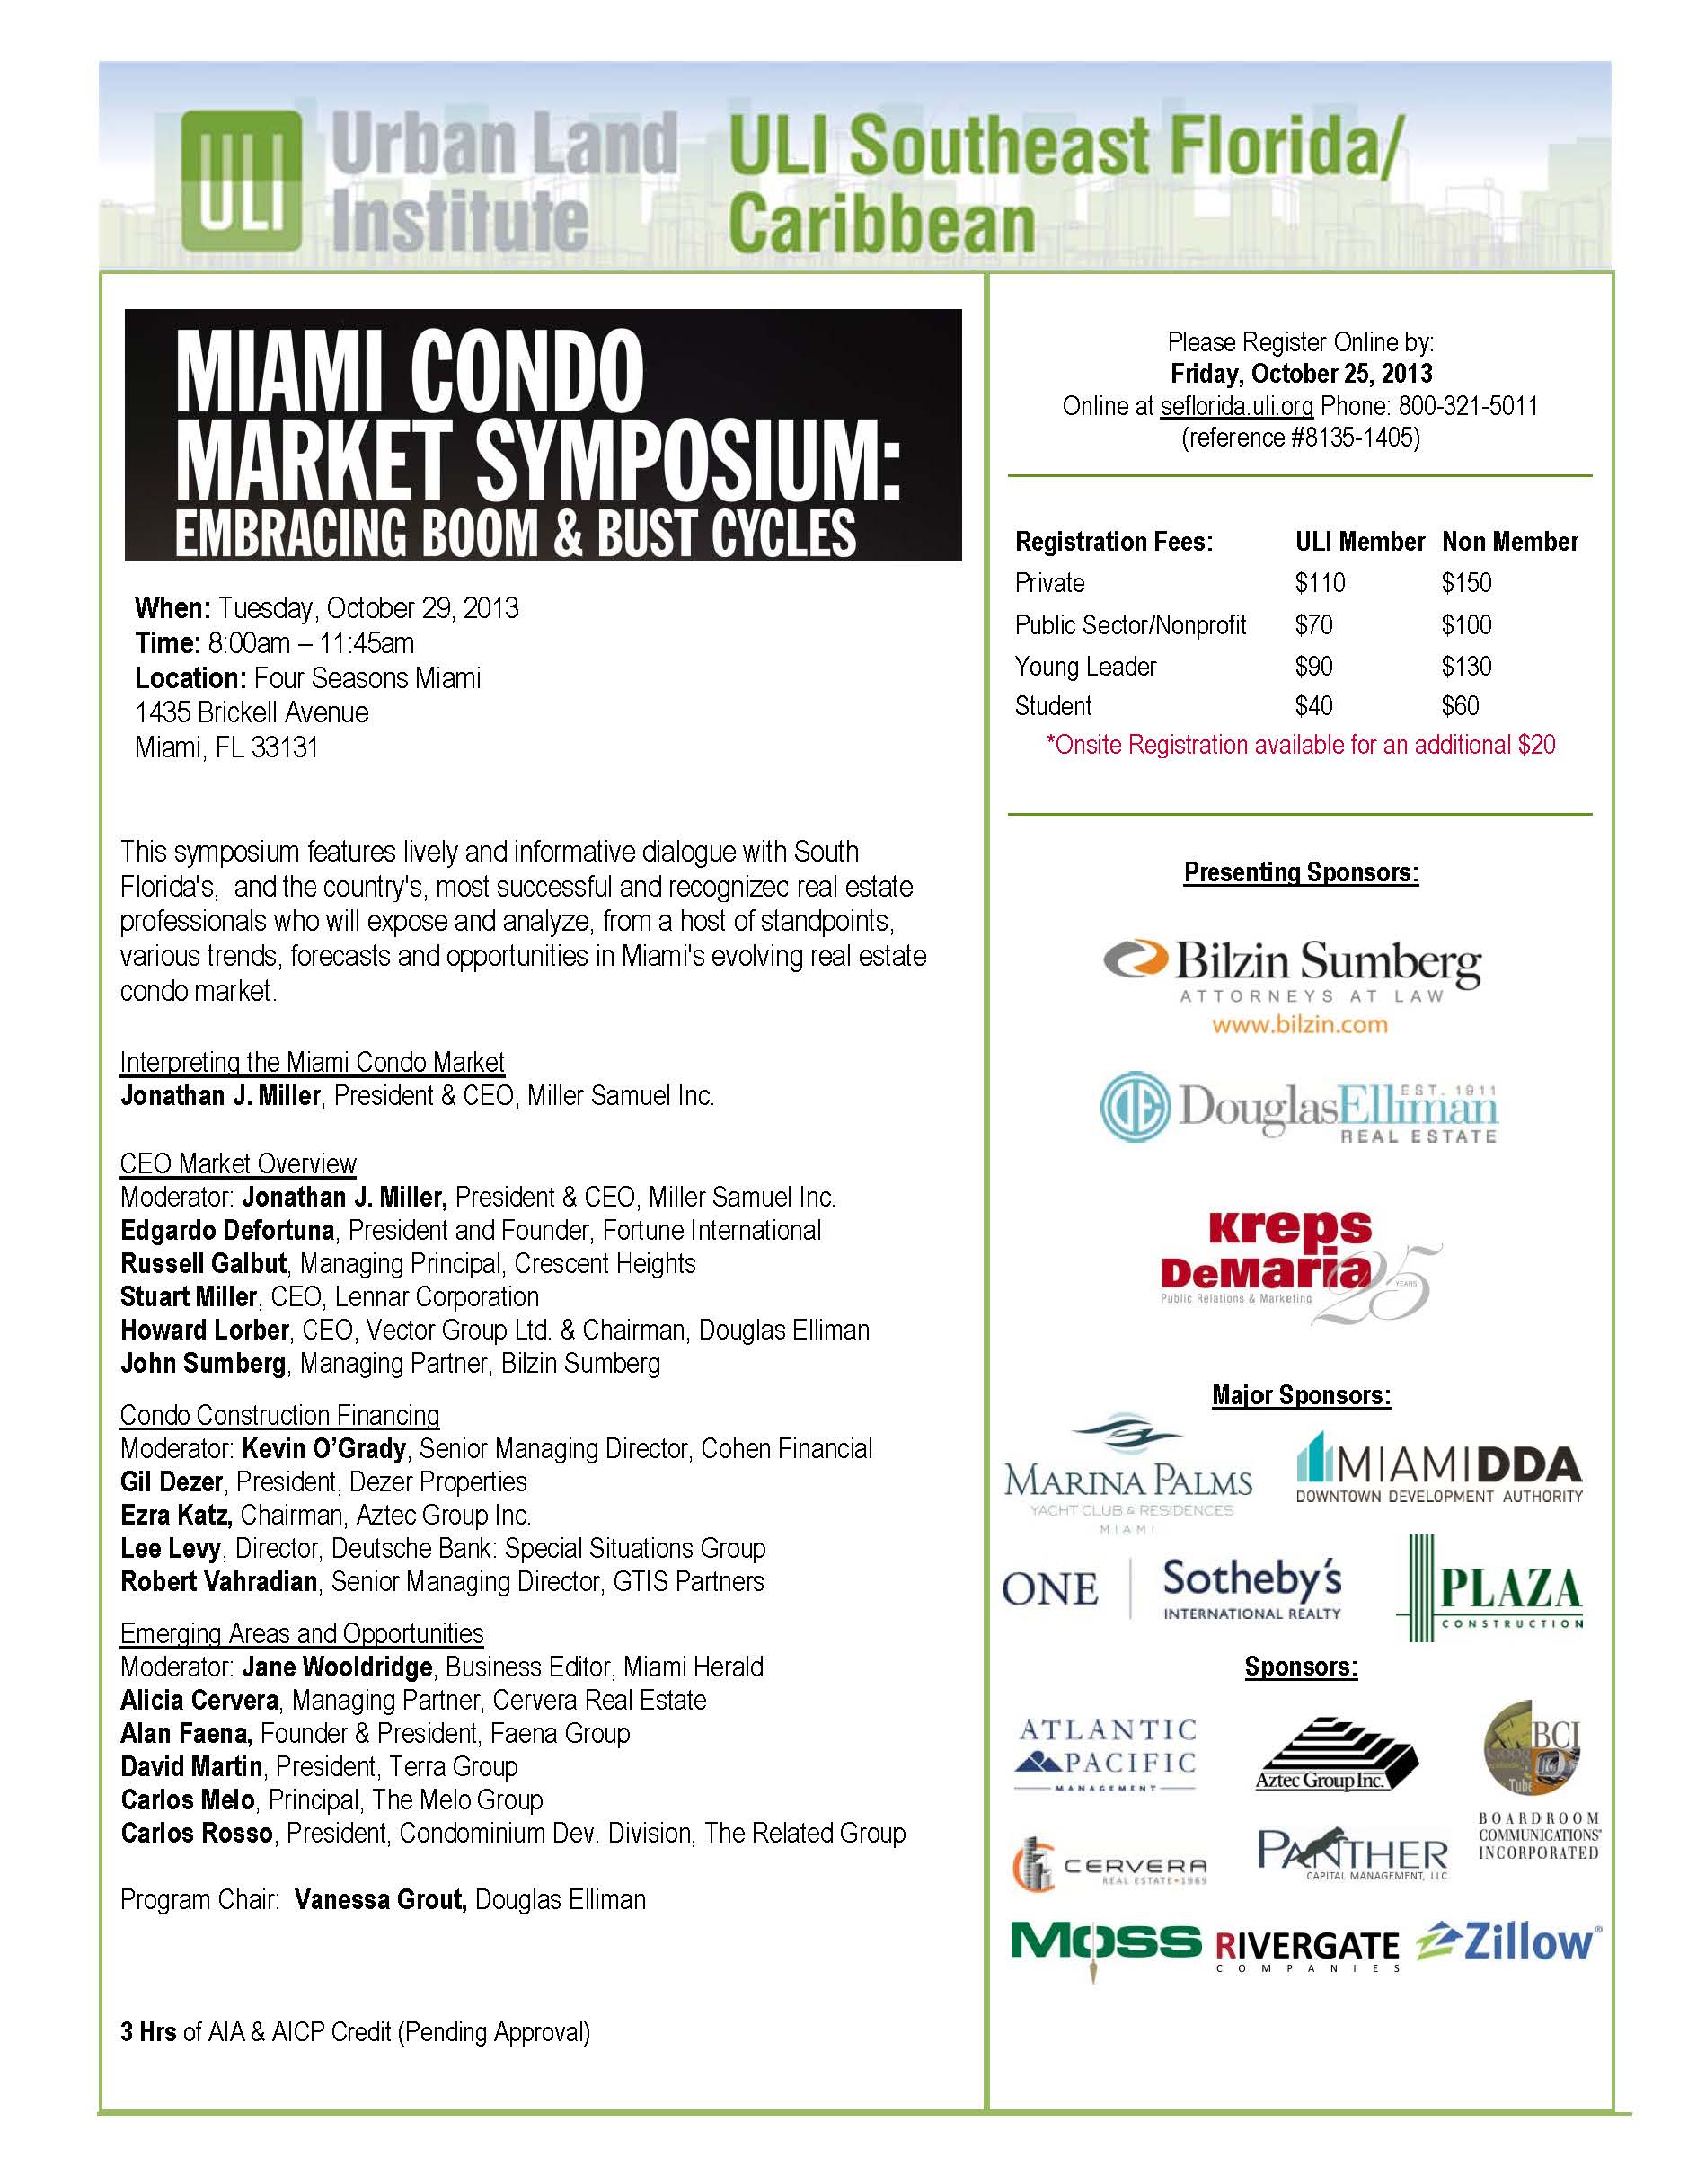
[Public Speaking] Miami Condo Market Symposium 10-29-13

October 27, 2013 | 9:32 pm | | Public |

I’m headed to Miami this week to speak at the Urban Land Institute’s Miami Condo Market Symposium: Embracing Boom & Bust Cycles. Based on the speaker list, it promises to be an informative event.


[click graphic to go to web site]


3Q 2013 Market Report Gauntlet Comes to a Close

October 26, 2013 | 5:15 pm | | Reports |

This week marked the end of what I call the “quarterly gauntlet” market report releases that I author for Douglas Elliman. If you’re interested, we’ve analyzed a bunch of markets:

NYC Metro Area
Manhattan Sales
Manhattan & Brooklyn Rentals
Brooklyn Sales
Queens Sales
Westchester/Putnam Sales
Long Island Sales
Hamptons Sales
North Fork Sales

South Florida
Miami Sales
Boca Raton Sales
Fort Lauderdale Sales
Palm Beach Sales

I’ve been writing this expanding report series for Douglas Elliman since 1994. You can also build custom data tables on information included in the reports using our aggregate database and a growing library of market charts.


[Three Cents Worth Miami #243] Midyear Snapshot On Improving Magic City Housing Market

August 15, 2013 | 4:11 pm | | Charts |

It’s time to share my Three Cents Worth (3CW) on Curbed Miami, at the intersection of neighborhood and real estate in the Magic City. And I’m simply here to take measurements.

Check out my 3CW column on @CurbedMiami:

This week I thought I’d give a quick look at the last 18 months – the period where Miami transitioned its US image from poster child for distressed real estate back to a luxury real estate location. If these are thrown into one bucket, the drop in lower priced distressed activity unreasonable skews the overall market higher so I thought it would be good to break out the market like we do in the market reports we prepare for Douglas Elliman…

[click to expand chart]


My latest Three Cents Worth column on Curbed: Midyear Snapshot On Improving Magic City Housing Market [Curbed]

Three Cents Worth Archive Curbed NY
Three Cents Worth Archive Curbed DC
Three Cents Worth Archive Curbed Miami
Three Cents Worth Archive Curbed Hamptons

Tags: , ,


Reporting from South Florida 2Q13: Miami, Boca Raton, Fort Lauderdale and Palm Beach

July 18, 2013 | 5:05 pm | | Reports |

Today Douglas Elliman published four 2Q 2013 South Florida market reports we prepare that include Miami, Boca Raton, Fort Lauderdale and Palm Beach.


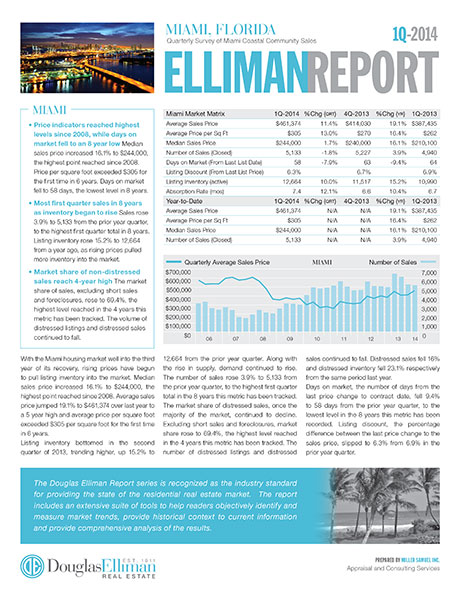
[Up + Less Distressed] 2Q 2013 Miami Report

July 18, 2013 | 2:58 pm | | Reports |

We just published our report on the Miami Coastal Community housing markets. This is part of an evolving market report series I’ve been writing for Douglas Elliman since 1994.

Key Points

  • Inventory fell to 8-year low.
  • Jump in both number of sales and signed contracts.
  • Housing prices rose above year ago level.
  • Median sales price rose to highest level for second quarter in 8 years.
  • Credit remains tight keeping inventory low.
  • Heavy contract momentum carrying into next quarter.

Here’s an excerpt from the report:

The overall number of sales rose by 15.4% to 6,416 to the highest total since we began tracking this metric in 2006. The market share for non-distressed sales comprised 67.2% of all market sales, up from 46.6% in the same quarter three years ago…There were 9,490 listings at the end of the second quarter, 18.8% less than in the prior year quarter. Distressed inventory fell by 44.1% and non-distressed inventory was down by 12% over the same period…

You can build your own custom data tables for Miami as well as view charts on the Miami market, all updated with 2Q13 data.


The Elliman Report: 2Q 2013 Miami Sales [Miller Samuel]
The Elliman Report: 2Q 2013 Miami Sales [Douglas Elliman]
Aggregated Custom Market Data Tables [Miller Samuel]
Miami Market Charts [Miller Samuel]


1Q 2013 South Florida Housing Market Reports Gone Wild

May 13, 2013 | 9:20 am | | Reports |


[click images to open each market report]

We recently completed the 1Q 2013 South Florida market report series for Douglas Elliman. These markets include Miami, Boca Raton, Fort Lauderdale and Palm Beach.


[In The Media] WNBC Channel 4 “Tightest Squeeze In Years” 2-11-2013

February 12, 2013 | 5:00 pm | Public |

Andrew Siff, a reporter for WNBC Channel 4 in New York did a great job articulating the tight inventory phenomenon we are seeing in both the region and nationally.


Tri-State Real Estate Market Under Tightest Squeeze in Years [WNBC Channel 4]
Listing Inventory Is, Well, Listing [Matrix]

Tags: , ,


The 4Q12 Miami Housing Market Translated: Economics, Spanish & Portuguese

February 2, 2013 | 10:20 pm | | Reports |

South Florida-based Douglas Elliman has translated the 4Q 2012 Elliman Report: Miami Sales that I prepare (I only took high school French) to Spanish and Portuguese, reflective of the significant demand from South Americans.

Elliman Report: Miami Sales (Spanish) | Elliman Report: Miami Sales (Portuguese)

[click to open reports]


Elliman Report: Miami Sales (Spanish) 4Q 2012 [Douglas Elliman]
Elliman Report: Miami Sales (Portuguese) 4Q 2012 [Douglas Elliman]
Elliman Report: Miami Sales (English) 4Q 2012 [Douglas Elliman]


Miami Hype Machine: “Sales Pace Slows Dramatically”

January 27, 2013 | 2:47 pm |

Since housing bust began, Condo Vultures has led the way with distressed new development information on Miami, a housing market that became branded for foreclosures and stalled new development activity after the mid-decade crash. Their name suggests someone who is picking over the dead carcasses of stalled condos built during the boom and no one has marketed themselves more thoroughly in this segment.

They seem to perform a lot of analysis through public record and have the inside track on data from developers not in public record. Good for them. It’s a niche they own. But with that dominance comes responsibility.

Their regular email press releases are chocked full of information hyperbole (as most newsletters are) but there is often a disconnect between the headline and the content (just like we see with the monthly NAR releases). Recently I observed that they stopped the dated approach of marketing properties as a percentage discount from original pricing. I do find the releases interesting to read but I worry about the accuracy of the messaging for the uninitiated. I found the latest one grating so I thought I’d break it down because it symbolizes the challenges and responsibilities of analyzing a market segment with limited transparency.

Here’s the headline:

600 New South Beach Condos Unsold As Sales Slow Dramatically In Q4 2012

That’s sounds quite dire, right?

Not really. In a pool of 600 units, 10 sold in 4Q12, down from 20 sales in 4Q11. Let’s delve into the rules of market trends:

Misuse of percentages – The results suggest a 50% drop in sales. And to use my favorite example of this technique, a market whose sales rise from 1 to 2 experienced a 100% increase in sales. Better to say 10 fewer sales or 1 more sale than last year when the numbers are so small.

Number generalization – There are no precise numbers being provided anywhere in this release yet the results are numbers-based …less than 10 sold in 4Q12 and more than 20 sales sold in 4Q11. If you are burning calories on providing approximate metrics worthy of a screaming headline, why not provide the actual numbers? If it was 9 and 21 or 1 and 29, the same logic would apply so why omit it?

Data set size – Based on the release, there were “about 600” unsold from boom, new development condo listings in 4Q12, the same size as the prior quarter. However the release doesn’t provide the year ago quarter total. What if it was 1,200?…then the drop was proportional. Why not be transparent and just provide the actual numbers – they must have them to provide such “precise estimating.” The 10 sales or less total represents 1.7% of the inventory or even less depending on how many sales there actually were.

When I first read through this release I did some quick math – I took the 10 sales (or less) which represented 1.7% of the 600 unit market and wild guessed, based on general market activity, that this shadow inventory was at least 700 last year. So at this level, the 20 sales (or more) in 4Q11 would indicate a 2.9% share. With this logic, the sales market share of the shadow inventory fell from 2.9% to 1.7% over the year, a 1.2% drop in market share.

Should a 1.2% decline be described as a dramatic slow down? No, based on the info presented, the decline was more like a rounding error.

C’mon.

Tags:

Get Weekly Insights and Research

Receive Jonathan Miller's 'Housing Notes' and get regular market insights, the market report series for Douglas Elliman Real Estate as well as interviews, columns, blog posts and other content.

Follow Jonathan on Twitter

#Housing analyst, #realestate, #appraiser, podcaster/blogger, non-economist, Miller Samuel CEO, family man, maker of snow and lobster fisherman (order varies)
NYC CT Hamptons DC Miami LA Aspen
millersamuel.com/housing-notes
Joined October 2007