Matrix Blog

Federal Reserve, New York

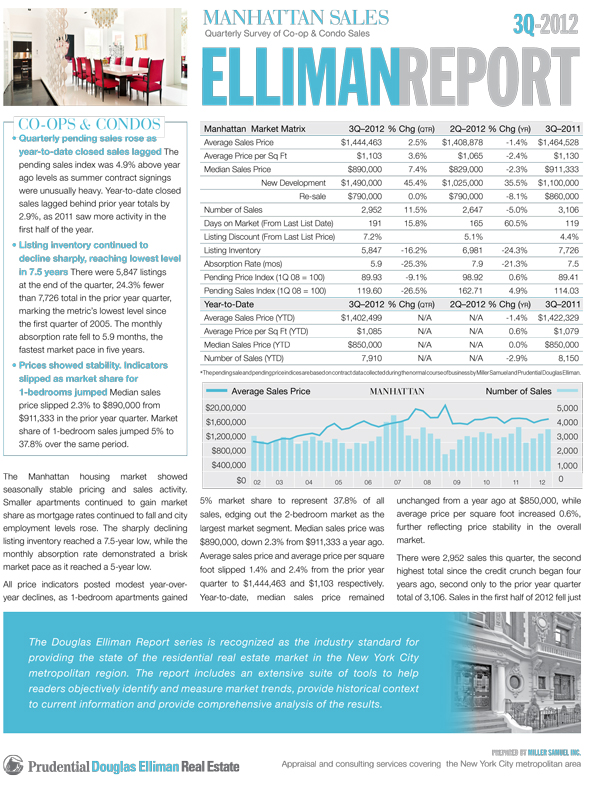
[Devoid of Sellers] 3Q 2012 Manhattan Sales Report

October 2, 2012 | 9:00 am | | Reports |

We published our report on Manhattan market sales for 3Q 2012 this morning.   I’ve been writing them for Douglas Elliman since 1994.

My Take

-Housing prices continue to remain stable – the slight YOY dip in prices was caused by a large increase in 1-bedroom sales pulling the overall numbers down (mortgage rates driving the entry-market)
-Closed sales slipped 5% from last year but pendings jumped 4.9% ahead of last summer – 2011 had more written business in first half of year while 2012 had more momentum going through summer.
-Inventory fell 24.3% from last year to lowest level in 7.5 years. Low equity keeping many sellers from listing (those sellers can’t become buyers because of tight credit), election year paralysis and concern about direction of economy, Europe, Federal Reserve’s QE3.
-Condo price trends outpacing co-op price trends likely due to foreign buyer demand.
-Luxury market prices slipping as inventory edging higher – however there was a jump in 3-bedroom sales.
-New development sales market share at 17.8%, consistent with past several years.
-Manhattan remains one of the best housing markets in the US: employment rising, tight inventory and strong international demand – despite tight credit conditions.

Here’s an excerpt from the report:

…The Manhattan housing market showed seasonally stable pricing and sales activity. Smaller apartments continued to gain market share as mortgage rates continued to fall and city employment levels rose. The sharply declining listing inventory reached a 7.5-year low, while the monthly absorption rate demonstrated a brisk market pace as it reached a 5-year low. All price indicators posted modest year-overyear declines, as 1-bedroom apartments gained 5% market share to represent 37.8% of all sales, edging out the 2-bedroom market as the largest market segment. Median sales price was $890,000, down 2.3% from $911,333 a year ago. Average sales price and average price per square foot slipped 1.4% and 2.4% from the prior year quarter to $1,444,463 and $1,103 respectively. Year-to-date, median sales price remained unchanged from a year ago at $850,000, while average price per square foot increased 0.6%, further reflecting price stability in the overall market…

Updated charts and data tables will be uploaded later today. UPDATE: The charts and data tables are updated.

Here’s the press coverage for the report today.


The Elliman Report: 3Q 2012 Manhattan Sales [Miller Samuel]
The Elliman Report: 3Q 2012 Manhattan Sales [Prudential Douglas Elliman]

Tags: ,


[In The Media] Bloomberg Surveillance 9-18-12 QE3, Low Rates and Housing

September 18, 2012 | 9:14 am | | Public |

Very much enjoyed my conversation with Tom Keene and Scarlet Fu on Bloomberg Television’s Surveillance.

Scratch notes before my appearance:

Some thoughts about the Fed’s QE3 as it relates to housing (Einstein defines insanity as doing something for a 3rd time hoping it works).

-Focus of QE3 seems to be housing, but it shows how little Fed understands housing since this seems to be an effort to press borrowing costs lower.
-Falling rates until now have increased affordability 15% this year but reaction in sales is less. A diminishing return for this action. Yes it temporarily helps but is more akin to the 2010 tax credit – remove it and consumers stop buying.
-Fed must believe recent “happy housing news” isn’t sustainable. Prices and sale generally showing improvement.

-Banks prob won’t drop rates all that much-could even see a slight increase in short term: admin backlog from existing business, guarantee fees by Fannie Mae to kick in a few months and spreads already low. This action provides little traction.

-QE3 doesn’t address THE REAL PROBLEM – mortgage underwriting remains irrationally tight. Smaller universe qualifies for mortgaged and a large number of contracts fall through – approx 15%.
-Telegraphing low rates through 2015 eliminates any urgency for consumers to take action. National volume up YOY but 2011 was the aftermath of 2010 tax credit so comparing against low.


Bernanke’s Speech on QE3 [MarketPlace.org]
Benanke Statement on QE3 [Federal Reserve]
QE3: What is quantitative easing? And will it help the economy? [WaPo Wonk Blog]
Fed’s Evans Says QE3 Will Make Economy More Resilient [Bloomberg]
Low Rates Not Improving Housing Market, Miller Says [Bloomberg Surveillance TV]

Tags: , , , , ,


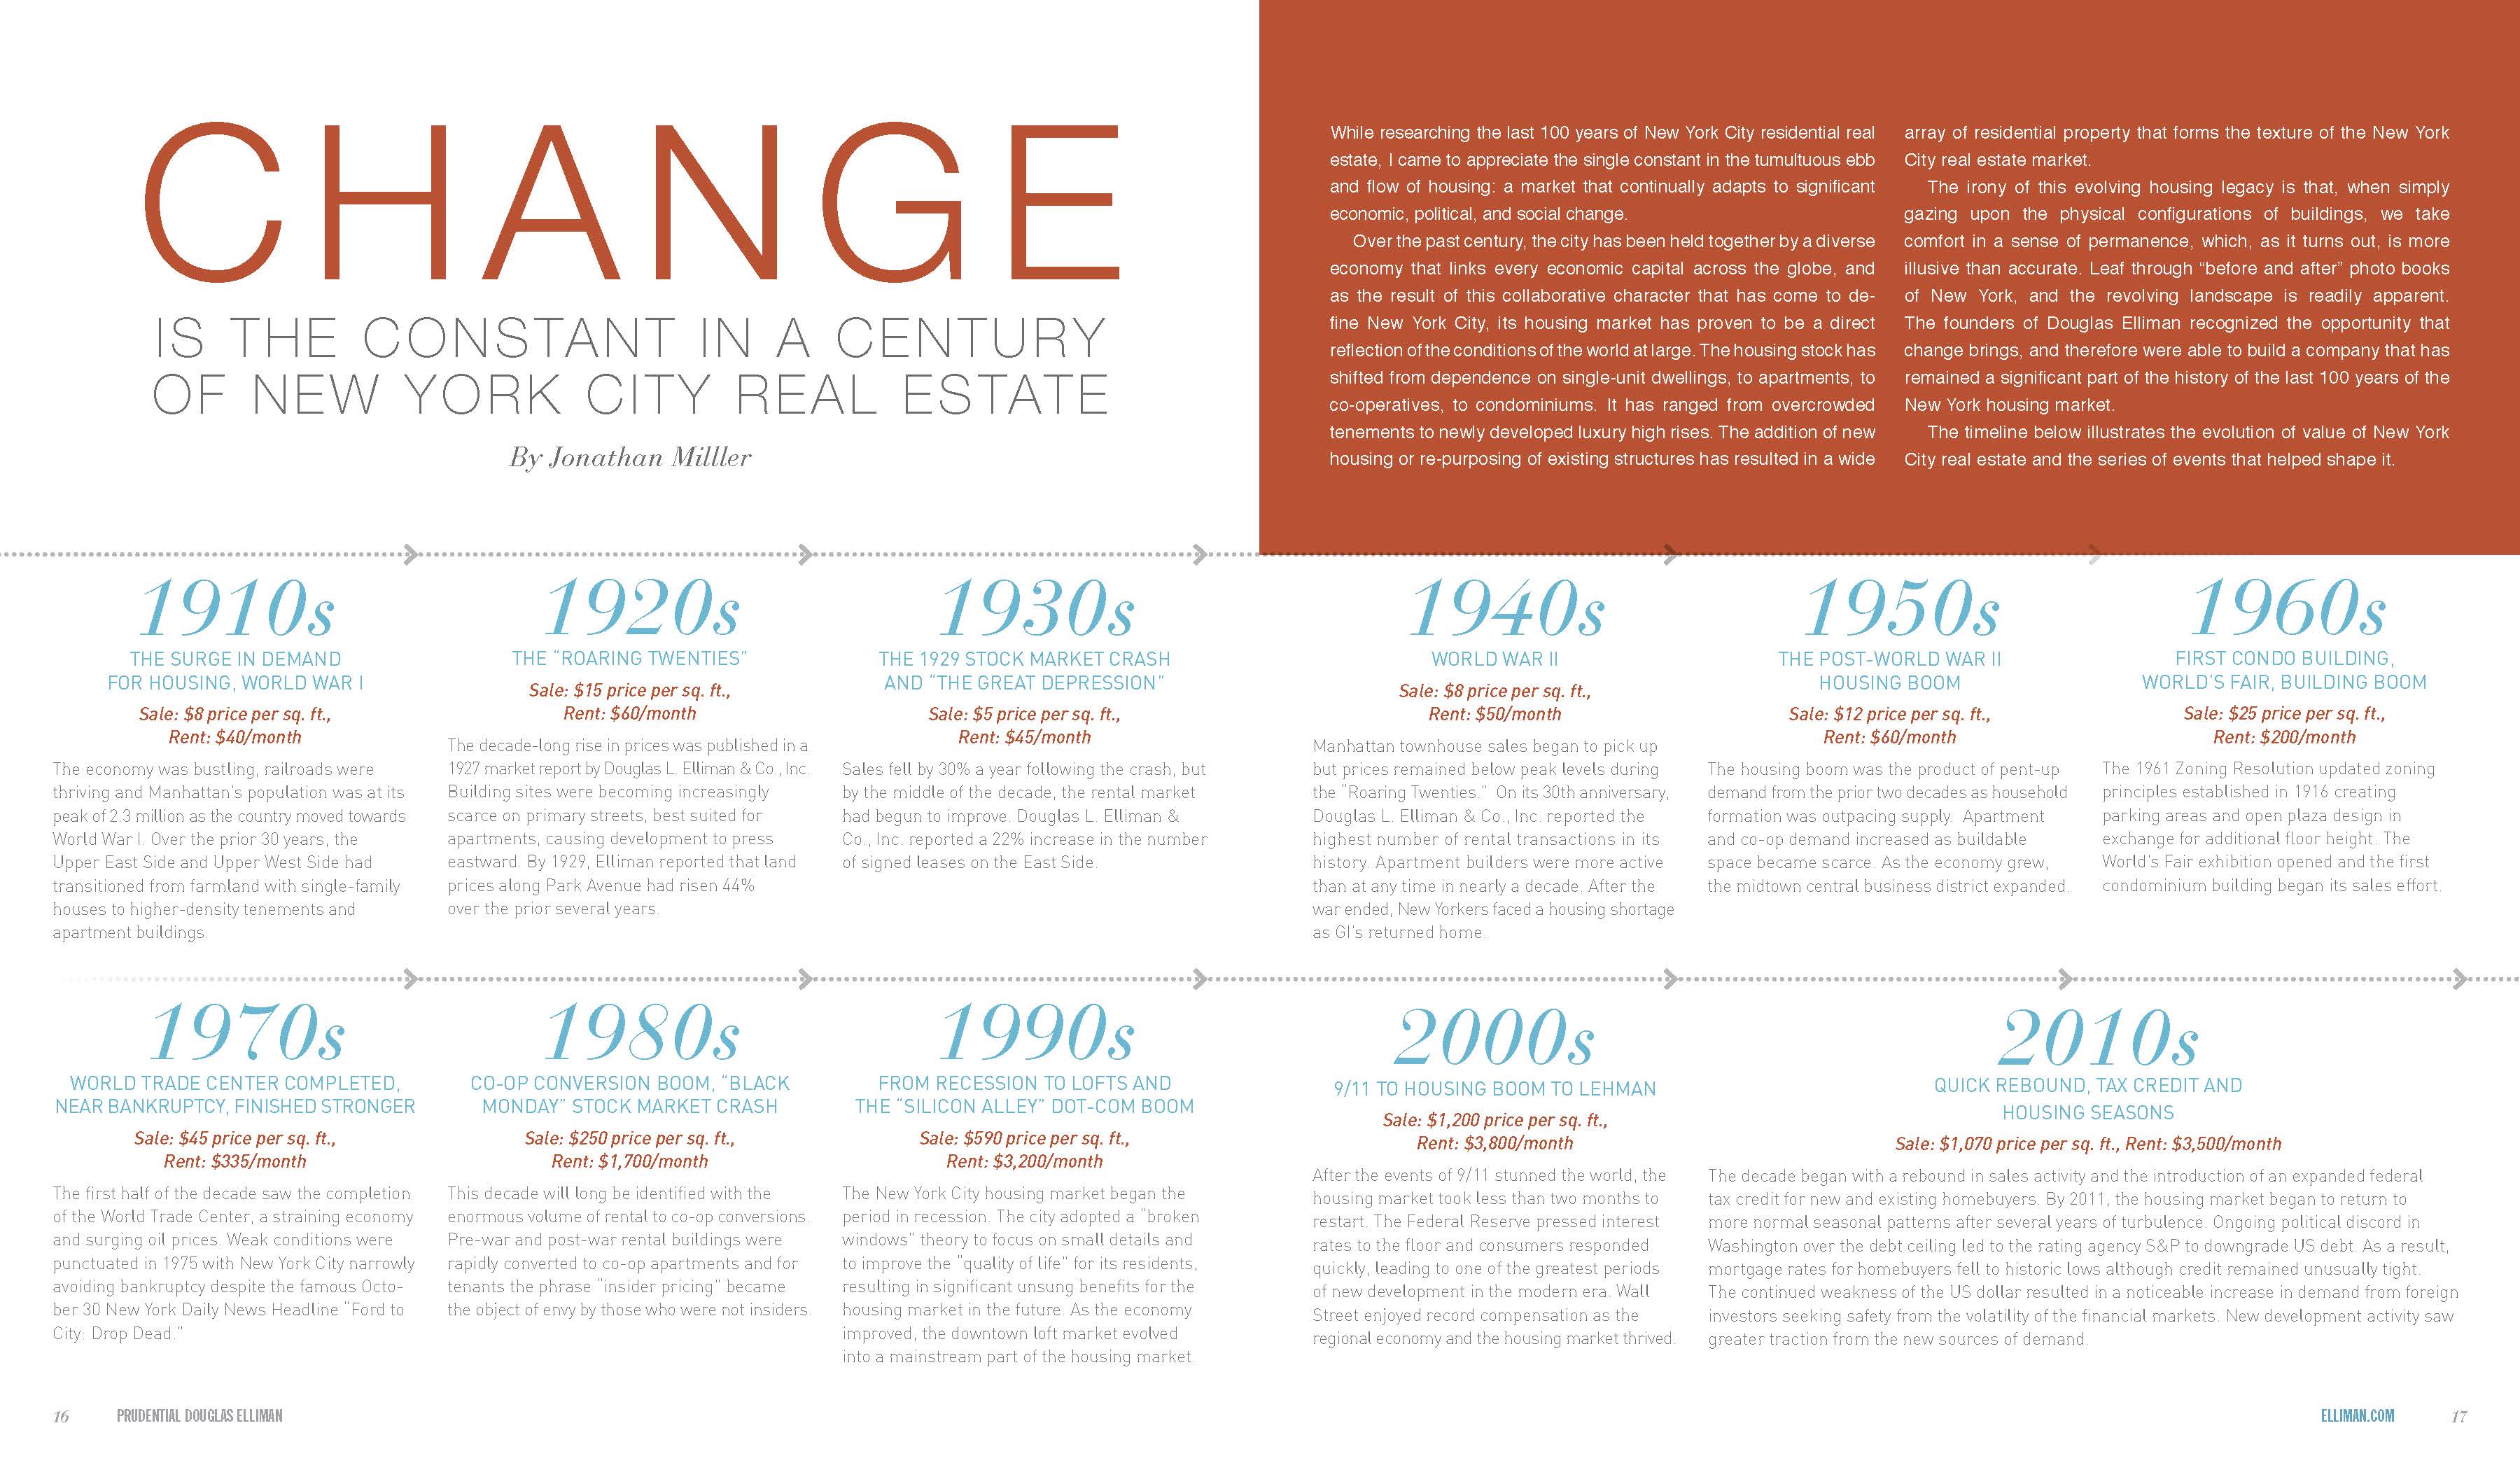
Change is Constant: 100 Years of New York Real Estate

February 7, 2012 | 11:28 am | | Articles |


[click to expand]

Last fall Prudential Douglas Elliman turned 100 years old and they asked me to write an article for their Elliman magazine. If you’ve been living in a cave, I’ve been writing their housing market report series since 1994.

What started as a simple project morphed into a fun, albeit gigantic, research project. I learned a lot about the evolution of the Manhattan housing market, largely through the amazing incredible New York Times archives. This was right about the time of my website revision and semi-necessary hiatus so I am cleaning out my desk of posts I have been itching to write so please indulge me.

The article I wrote for Douglas Elliman was beautifully presented by their marketing department and prominently inserted in their Elliman magazine (and iPad app!).

Diane Cardwell of the New York Times in her “The Appraisal” (an incredible column name BTW) penned a great piece: In an Earlier Time of Boom and Bust, Rentals Also Gained Favor that originated from my article and zeroed in on the 1920s and 1930s to draw a comparison to the current market.

I have the feeling my project is going to morph into something bigger – it’s just too interesting (to me). A few things I learned about the Manhattan market over this period:

  • Douglas Elliman published the first market study in 1927 [heh, heh] not counting other marketing materials written before WWI)
  • Real estate media coverage in the first half of the century was social scene fodder (same as today) but with extensive and excessive personal details presented on tenants, buyers and sellers yet housing prices and rents were rarely presented in public.
  • Manhattan made a rapid transition from single-family to luxury apartment rentals and eventually co-ops.
  • Housing prices and rents by mid-century weren’t that much different than at the beginning of the century.
  • Manhattan’s population peaked at 2.3M around WWI.
  • Wall Street in the 1920s was seen as the driver of the real estate market.
  • Federal and state credit fixes in the late 1930’s help bail out the housing market.


• Change Is The Constant In A Century of New York City Real Estate – pdf [Miller Samuel]
• My Theory of Negative Milestones [Matrix]

Read More

Tags: ,


[Furman Center] Improving U.S. Housing Finance through Reform of Fannie Mae and Freddie Mac

June 7, 2010 | 11:11 pm | |

[click to open paper]

The NYU Furman Center for Real Estate released a white paper: Improving U.S. Housing Finance through Reform of Fannie Mae and Freddie Mac: Assessing the Options by Ingrid Gould Ellen, John Napier Tye and Mark A. Willis that lays out possible paths to take. They also lay out the functions they serve and were intended to serve.

Wow.

A great primer on Fannie and Freddie.

After facing insolvency one year ago, Fannie Mae and Freddie Mac were placed in government conservatorship in September 2008. The Obama Administration’s recently released report on financial regulatory reform calls for a “wide-ranging process” to explore options for the future of the GSEs. The Furman Center, in cooperation with the What Works Collaborative, has conducted research to better understand six primary options for the future of the enterprises, ranging from nationalization to dissolution. This white paper provides an overview of the U.S. housing finance system and the basic operations of Fannie Mae and Freddie Mac before conservatorship. It then discusses the basic goals of a healthy secondary market for both the single- and multifamily market, and offers a framework to help to describe and understand the different proposals for reform. Finally, it looks in detail at some of the specific proposals now emerging for reform of the housing finance system. As the federal government contemplates the future of these two entities, we hope that this paper offers a useful framework to evaluate the alternative proposals.

The GSEs were fundamentally flawed institutions because they were accountable to two parties: shareholders and taxpayers – shareholders as privatized institutions and taxpayers because of the assumed federal backstop. Both parties ended up being crushed by bias favoring shareholders and scramble for market share during the housing boom.

They serve an essential function of creating liquidity for lenders by freeing up their capital to lend more through buying mortgage securities, stabilizing mortgage rates and establishing standardization for the secondary mortgage market. But they are hemorrhaging now with no concrete solution in sight.

There are a lot of good ideas in the paper (I’ve read it twice, and will look at a few more times).

Not to go all regulatory crazy here, but I like the concept of regulating underwriting:

The industry needs to be regulated as to its underwriting standards, the quality of the underwriting process, operational risk, the level of capital/reserves, and even the quality of its servicing of the mortgage loans and the rating of its securities.37 The ability to regulate these entities effectively would be facilitated by requiring, for example, that all securitizers be licensed or chartered. Such a regulatory system/environment would help guard against the proliferation of toxic products, poor quality controls, and unfair and deceptive marketing practices, and thereby prevent the kind of race to the bottom that we have just witnessed, in which safer products are driven out of the market place.

It’s going to be a work in progress, I’m afraid.


Tags: , , ,


[Bubbletheory] Lets Not Re-write History

May 10, 2010 | 12:00 am | |

I have been coming across what I believe to be somewhat weird rear view looks at the credit/housing bubble we just went through from some well respected voices. I’m thinking there is perhaps an academia disconnect from the front lines.


[click to open article]

Casey B. Mulligan is an economics professor at the University of Chicago writes “Was it really a bubble?

According to the bubble theory, for a while the market was overcome with exuberance, meaning that people were paying much more for housing than changes in incomes, demographics, technology and other basic factors would suggest.

But why would the blue line need to be where it is? Housing prices are stickier on the downside and the slope should not form a bell curve as the drawing suggests. It should be a lesser slope and drawn out over several years, shouldn’t it? And wasn’t that the whole point of the stimulus plan in reference to the first time home buyers’ and existing homeowner’s tax credit? It stimulated sales activity and as a result, artificially pushed sales price levels sideways.

Take a look at my colleague at Westwood Capital, Dan Alpert’s chart showing the exuberance of housing prices. You can slice it and dice anyway you want but THAT’s a bubble.


[click to open article]

And one of my favorite economist/writers Edward Glaeser writes “What Caused the Great Housing Maelstrom?

If the easy credit hypothesis is correct, then we can take comfort in the thought that we understand the great housing convulsion, and we can start pointing fingers at those institutions, like the Federal Reserve System, that play a role in determining interest rates.

He and his colleagues through their research seem to be saying that low interest rates and high lending approval rates don’t explain enough of the rise in housing prices.

In all due respect, I don’t know exactly how they proved their points empirically but this research seems to be a bit disconnected to what most of us observed on the ground during the boom itself.

For example, a five percent increase in loan-to-value ratios is associated with a 2.5 percent increase in prices, and loan-to-value ratios rose by less than five percent during the boom.

That seems like a very low ratio to me. As appraisers we could clearly see the pressure we were under to hit the number for the mortgage approval and that most people were placing 5%-10% down. I contend that credit was easier than anytime in modern history and that combined with interest rates kept on the floor from late 2001 to mid 2004 caused a frenzy of demand or as Professor Robert Shiller characterizes it as “Irrational Exuberance.”

This was a credit bubble and that housing was merely a way to keep score. Perhaps I am not following their logic but having lived through it and saw the lending environment first hand, its hard to imagine this whirlwind of the past 7 years was not a bubble of some kind.


Tags: ,


[HUD] Housing Market Conditions, Loan Mod Redefault Risk

March 29, 2010 | 11:23 pm | |


[click to open map]

Today I received a nice note from an economist at HUD saying they are using the market report series we prepare for Prudential Douglas Elliman in US Department of Housing and Urban Development’s US Housing Market Conditions site, specifically their annual Regional Activity summary. Using-our-market-reports-aside, its a pretty good overview of what happened in each region. Sort of reminds me of a Beige Book-like housing analysis.

Not only that, but they provide access to a slew of data, research papers and reports as well as interactive maps that allow you to drill down to local levels.

This isn’t a sales pitch so check it out.

Here’s a hot button research paper on their site now:

Loan Modifications and Redefault Risk: An Examination of Short-Term Impacts

A primary concern with loan modification efforts is the seemingly high rate of recidivism. Within 6 months, more than one-half of all modified loans were 30 days or more delinquent and more than one-third were 60 days or more delinquent (OCC and OTS, 2008). Do these high rates of redefault imply that loan modifications are failing?

I would say as currently structured – YES.


Tags: ,


[New Mortgage Program] Getting Paid To Sell Short

March 8, 2010 | 10:40 am | |

The Obama administration has come up with a radically aggressive plan to reduce foreclosure activity which has remained alarmingly high. The key ingredient is to encourage lenders/services to allow more short sales – selling the home for less than the amount of the mortgage without going after the debtor for the shortfall. Mortgage modification plans have not been successful to date.

The New York Times page 1 story today Program Will Pay Homeowners to Sell at a Loss does a masterful job in presenting the program and summarizing the problems of the issue to date, I just wish the title wasn’t so simplistic.

Perhaps I am missing the point, but I feel like this solution has focused on the wrong side of the mortgage default equation. Are servicers going to forgive $200,000 in principal to get $1,000? Are homeowners going to move forward because they get $1,500 (more than the servicer) in relocation fees?

The flood of short sale requests are already overloading many bank’s ability to handle the administration of this crisis – hard to see them able to manage the process any more efficiently.

However, the only way out of this crisis is a solution with principal foregiveness in the equation or people will simply walk away and perhaps the servicer/lender ends up being hurt more. No easy answer I suppose.

Real estate agents will determine property value

One mechanical aspect of this process which demonstrates the administration’s and government in general’s disconnect in the need for neutral analysis of value. Real estate agents, who are paid to sell property, determine the “reserve” price above which the lender/servicer must adhere to.

Under the new federal program, a lender will use real estate agents to determine the value of a home and thus the minimum to accept. This figure will not be shared with the owner, but if an offer comes in that is equal to or higher than this amount, the lender must take it.

Mr. Paul, the Phoenix agent, was skeptical. “In a perfect world, this would work,” he said. “But because estimates of value are inherently subjective, it won’t. The banks don’t want to sell at a discount.”

How about a neutral party in the process? A qualified appraiser? (not the yahoos doing AMC work in high volume). I would assume the agents selecting the number are not allowed to sell the property (huge assumption on my part) but why not have someone who can’t ever sell the property, whose full time job it is to estimate market value, be assigned that task?

The devil is in the details.


Tags: ,


[Housing Bubble Golden Rule -> 3 R’s] Regulating, Rates and Recession

January 6, 2010 | 12:24 am | |

In Bernanke’s speech to the American Economic Association on Sunday he suggested that it was regulatory failure, not keeping rates too low for too long, which caused the housing bubble.

Stronger regulation and supervision aimed at problems with underwriting practices and lenders’ risk management would have been a more effective and surgical approach to constraining the housing bubble than a general increase in interest rates.

This seems to be splitting hairs, doesn’t it?

Low rates triggered the housing bubble as money became cheap and easy to get. If the Fed hadn’t kept rates too low for too long, the bubble would not have happened. The regulatory system was ill prepared for the insanity that followed. House prices rose so fast that underwriting had to evaporate to keep the mortgage pipeline full. Regulators hadn’t seen this before and with the removal of Glass-Steagal and Laissez-Faire mindset, everyone in DC, including Congress and regulators, drank the Kool-aid.

Actions Taken Too late

Mr. Bernanke has pointed to the Fed’s extraordinary efforts to stem the crisis, including the creation of new lending vehicles to banks and a reduction of bank-to-bank interest rates to virtually zero, as evidence that the Fed has a firm grasp of what the economy needs. The Fed’s handling of the crisis has been widely praised by economists.

The Treasury and other government agencies already have supervisory power over parts of the financial system, but so, too, does the Federal Reserve.

In his talk on Sunday, Mr. Bernanke acknowledged as much, rattling off a list of regulatory efforts the bank made to address nontraditional mortgages and poor underwriting practices.

But, he said, “these efforts came too late or were insufficient to stop the decline in underwriting standards and effectively constrain the housing bubble.”

All regulators are human and subject to mob mentality just like politicians and consumers were. Everyone is awake now. That’s why I think a “bubble czar” type position is silly. I’m not blaming the Fed or Bernanke. Now about Greenspan….

In fact I think the Fed has done an excellent job keeping our financial system from the brink. Lets recognize Bernanke’s comments for what they are – dodging the minefield of Congressional approval. God help us if Congress is able to audit the Fed. Its not the audit I object to – its the politicalization of it. We need to keep the Fed neutral (in theory).


Tags: ,


[Boston Fed] Its Not How Much You Can Consume, Its How Much You Borrow To Consume

November 18, 2009 | 11:06 am | |

A quick shout out to Sam Chandan at Real Estate Econometrics for his invite to me to speak to his MBA real estate class at Wharton last Monday. A lot of fun and no tomatoes thrown. Added bonus, they have Au Bon Pain as snack shop.


[click to expand]

The widely held belief that houses were used as ATM’s during the credit boom is a valid assumption given the massive withdrawal of home equity. Of course that parallels mortgage lending and as a result, housing activity boomed over the same period.

With the post-Lehman credit crunch, millions of homeowners can’t refinance their mortgages or obtain a mortgage for a purchase. The contraction in credit has choked off the high pace of sales activity our economy has grown accustomed too. Yet sales and prices appear to be leveling off after a steady decline.

Q: Who’s buying these homes?
A: People that can actually afford and qualify for a mortgage.

According to a recent public policy discussion paper from the Federal Reserve Bank of Boston by Daniel Cooper Impending U.S. Spending Bust? The Role of Housing Wealth as Borrowing Collateral

house values affect consumption by serving as collateral for households to borrow against to smooth their spending….house values, however, have little effect on the expenditures of households who do not need to borrow to finance their consumption.

In other words, the segment of the consumer market that needs to borrow to spend, aren’t spending now. That doesn’t mean “no one is spending” – this is the cause for significant confusion in interpreting the health of our current economy.

For those who borrow to spend

The results show that the consumption of households who need to borrow against their home equity increases by roughly 11 cents per $1.00 increase in their housing wealth.

During the housing boom, the excess demand was simply fueled by those who had to excessively borrow to spend. It doesn’t mean that everyone had the same thinking.

Back to basics.


Tags:


[Fed Up] October 2009 Senior Loan Officer Opinion Survey

November 11, 2009 | 9:31 pm | |

I’m thinking maybe credit isn’t going to lead us out of the recession. Banks are getting much enjoyment out of the wide spreads for now – gearing up for future carnage in commercial, auto loans, credit cards and industrial loans. This is apparent in the The October 2009 Senior Loan Officer Opinion Survey on Bank Lending Practices that was released on Friday. Its kind of the Beige Book equivalent of anecdotal credit practices.

The report basically showed that fewer banks are tightening mortgage credit policy and mortgage demand is up. Of course this doesn’t mean much yet since bank lending policy can’t really can’t get much tighter.

In the October survey, domestic banks indicated that they continued to tighten standards and terms over the past three months on all major types of loans to businesses and households. However, the net percentages of banks that tightened standards and terms for most loan categories continued to decline from the peaks reached late last year.2 The exceptions were prime residential mortgages and revolving home equity lines of credit, for which there were only small changes in the net fractions of banks that had tightened standards.

About 25 percent of banks, on net, reported in the latest survey that they had tightened standards on prime residential real estate loans over the past three months. This figure is slightly higher than in the July survey but is still significantly below the peak of about 75 percent that was reported in July 2008. For the third consecutive quarter, banks reported that demand for prime residential real estate loans strengthened on net. About 30 percent of banks reported tightening standards on nontraditional mortgage loans, which represents a decline of about 15 percentage points in net tightening from the July survey. Only about 5 percent of domestic respondents, on net, reported weaker demand for nontraditional mortgages, the smallest net fraction reporting so since the survey began to include questions on the demand for nontraditional mortgages in April 2007.


Tags:


[Economic MetricWatch] How Do These Mean Housing Gets Better?

November 10, 2009 | 12:53 am | |

The US economy is pretty weak right now.
We need US housing to recover.
We want housing to recover.
Housing stats looked pretty darn nice this summer, didn’t they?
Please get better?

But housing can’t get better all by itself. That’s why its pretty silly to simply watch housing price trends. Prices are a lagging indicator if there ever was one.

Here’s a look at the four key economic indicators and their relationship to the housing economy – there’s a pattern here.

GDP


At 3.5% 3Q 09 GDP, forecasters are saying the economy has gotten out of the recession. But this is really a thin metric – obviously fictional.

Let’s start with the big picture. At the end of 2008, official GDP was -6.4%. This was also likely an understatement, but for the sake of argument let’s treat it as “fact”. Move ahead to the Q3 2009 reading of +3.5% and we see a swing of 10% in U.S. GDP – in merely the span of nine months. The only factor in the U.S. economy pushing against this massive contraction (and debt implosion) is the “Obama stimulus package”. However, using the Obama regime’s own numbers, less than $300 billion of true “stimulus” would reach the U.S. economy over the course of this entire year.

Yet consumer spending fell 0.5%, the most since December 2008 so the recession is not necessarily over.

Unemployment


Source: Daily Kos
With all the happy news surrounding this summer’s surge in home sales, its hard to imagine a housing recovery without jobs. In fact, unemployment is growing and even the broader definitions of unemployment are showing more deterioration.

With the release of the jobs report on Friday, the broadest measure of unemployment and underemployment tracked by the Labor Department has reached its highest level in decades. If statistics went back so far, the measure would almost certainly be at its highest level since the Great Depression. In all, more than one out of every six workers — 17.5 percent — were unemployed or underemployed in October. The previous recorded high was 17.1 percent, in December 1982.

Dow Jones Industrial Average


Source: MarketWatch
The DJIA reached new highs for 2009. One of the key reasons for the housing surge has been the renewed (or simply improved) confidence by consumers in the financial system which began at the end of Q1 when the DJIA began its steady assent. It keep climbing. Perhaps its time to short the markets, or even housing?

The Dow Jones Industrial Average (INDU 10,227, +203.67, +2.03%) rose 203.52 points, or 2%, to 10,226.64 — its best finish since Oct. 3, 2008 and the second 200-point gain in three trading days. The blue-chip measure has risen 4.7% over the four-day winning streak that began with the Federal Reserve’s policy statement last Wednesday, which quelled fears that the central bank might raise rates soon.

The Dollar


Source: MarketWatch
Gold broke the $1,100 barrier as the dollar fell to $1.50 against the Euro. The G-20 summit didn’t show support for the dollar. Look for more foreign investment of residential real estate if this trend continues.

“A lot of it is sentiment-driven and there the dollar is getting a vote of no confidence,” Mr. Dolan said. “The massive borrowing by the U.S. government is undermining confidence in the longer-term outlook for the dollar.”

Long term – housing doesn’t recover until the economy does.


[St. Louis Fed] Home Prices: A Case for Cautious Optimism?

November 2, 2009 | 6:27 pm | |

The St. Louis Fed, in their Economic Synopses publication contained a research piece called Home Prices: A Case for Cautious Optimism (Hat tip: Joe Weisenthal over at BusinessInsider) that does a great job lining up 3 housing related indexes and makes the case that we aren’t through yet despite positive month over month trends of the past 6 months.

The title for this Fed research piece is simply wrong. It should be re-named: Home Prices: Not Much of a Case for Cautious Optimism.

The chart shows the Case Shiller Home Price Index, FHFA Home Price Index and NAR Housing Affordability Index of Median Household Income presented in alignment.

Here’s the problem with affordability as a measurement – it considers income, housing prices and interest rates but not the tightness of credit, which is THE story at the moment. The affordability index is significantly optimistic right now because of this gaping void over credit.

Its great to have lower prices for all those buyers only if they can get a mortgage to take advantage of the opportunity. Mortgage underwriting is very tight right now and therefore we are looking at a 3 legged kitchen table that originally had 4 legs.


Tags: ,

Get Weekly Insights and Research

Housing Notes by Jonathan Miller

Receive Jonathan Miller's 'Housing Notes' and get regular market insights, the market report series for Douglas Elliman Real Estate as well as interviews, columns, blog posts and other content.

Follow Jonathan on Twitter

#Housing analyst, #realestate, #appraiser, podcaster/blogger, non-economist, Miller Samuel CEO, family man, maker of snow and lobster fisherman (order varies)
NYC CT Hamptons DC Miami LA Aspen
millersamuel.com/housing-notes
Joined October 2007