Matrix Blog

Posts Tagged ‘Listing Inventory’

[Three Cents Worth #261 NY] Inventory Rising At Fastest Pace in 4 Years

March 5, 2014 | 6:00 am | | Charts |

It’s time to share my Three Cents Worth (3CW) on Curbed NY, at the intersection of neighborhood and real estate in the capital of the world…and I’m here to take measurements.

Check out my 3CW column on @CurbedNY:

After an insanely chaotic and active 2013, it’s probably time to think about how 2014 is shaping up inventory-wise. At the end of last year, I was of the opinion that listing inventory was at or near a bottom and we would see some increase in supply but not nearly enough to match demand. And so far that has been the story. In this week’s column, I took a look at the first eight weeks of each year going back to 2009. Inventory always rises at the beginning of the year as sellers anticipate the spring market and skip over the December doldrums. I’d go back further in time, but I only began tracking inventory on a weekly basis in addition to monthly right after Lehman collapsed (I had more time on my hands). This analysis looks at overall Manhattan inventory at all price points—clearly there are nuances not reflected, i.e. luxury listings at historical averages while the remainder at chronic lows, so relax…

3cwNY3-4-14
[click to expand chart]


My latest Three Cents Worth column on Curbed: Inventory Rising At Fastest Pace in 4 Years [Curbed]

Three Cents Worth Archive Curbed NY
Three Cents Worth Archive Curbed DC
Three Cents Worth Archive Curbed Miami
Three Cents Worth Archive Curbed Hamptons

Tags: , , ,


Manhattan’s West Side Inventory Losing More Market Share Than Others

March 3, 2014 | 1:58 pm | Charts |

4q13manhattan-over-under
[click to expand]

I took a look at the trend in Manhattan’s listing inventory on a weekly basis since the beginning of 2009 and matched it against the market share of inventory for each of the four regions. It looks like the West Side (yellow line) was the only region to consistently lose market share over the past several years.

Since overall inventory has been falling during this period, this suggests that the West Side is tighter than the other regions but the absorption rate is about the same as the other regions.

Why?

Tags: , ,


[Video] Talking Housing on CNBC TV’s Street Signs 9-25-13

September 25, 2013 | 7:29 pm | | TV, Videos |

I’m not quite ready to use the word “haunted” in my housing language, but I had a nice chat with Brian Sullivan and Mandy Drury of CNBC TV’s ‘Street Signs’ – 30 Rock is always quick walk from my office to do the remote. Although my firm’s name was announced backwards on air (It’s really “Miller Samuel” I swear), I think my logic was forward (sorry).

Fun. Plus Mandy gives The Real Deal Magazine a shout out.

Tags: , , , , ,


[Three Cents Worth NY #227] A Dozen Manhattan Housing Market Stages

March 26, 2013 | 1:26 pm | | Charts |

It’s time to share my Three Cents Worth (3CW) on Curbed NY, at the intersection of neighborhood and real estate in the capital of the world…and I’m here to take measurements.

Check out this week’s 3CW column on @CurbedNY:

After reviewing an appraisal of a Manhattan sales transaction yesterday that had more than a dozen backup offers above list price (and not the first such situation we’ve seen recently), I thought I’d keep the listing inventory discussion train rolling on 3CW. I looked at a 12-year monthly co-op and condo inventory and named the housing stage at beginning of each year. Incidentally, Manhattan inventory has collapsed 54.5 percent from peak. The monthly 12+ year co-op and condo average is 7,292….


[click to expand chart]


Today’s Post: A Dozen Manhattan Housing Market Stages [Curbed]
Three Cents Worth Archive Curbed NY
Three Cents Worth Archive Curbed DC
Three Cents Worth Archive Curbed Miami

Tags: , ,


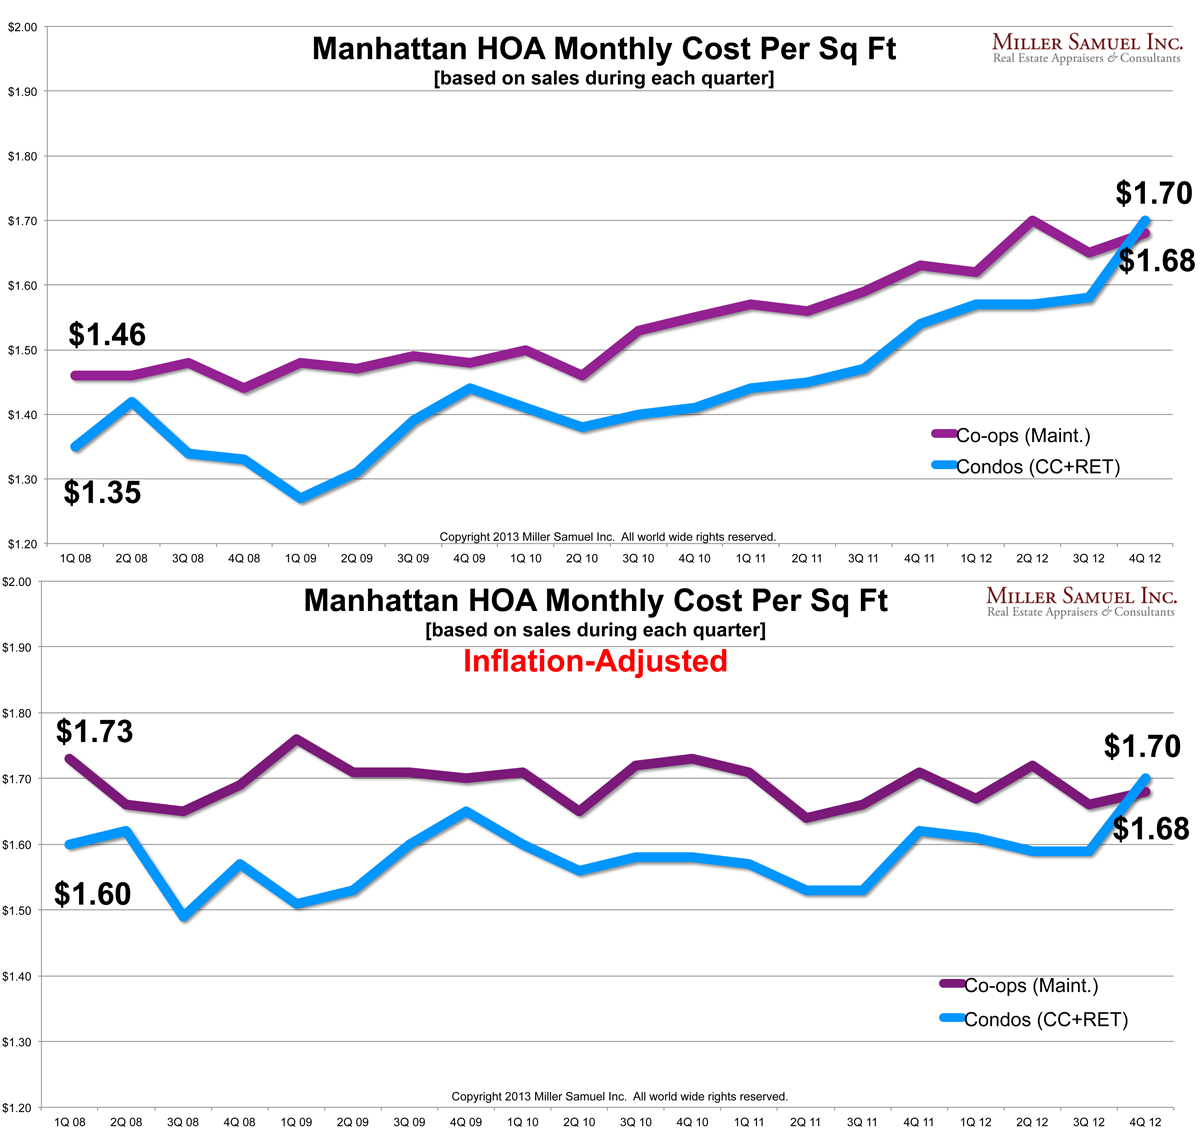
CNBC: $60,000 Per Month In Maintenance Charges With Park Views+Terrace

January 28, 2013 | 3:00 am | TV, Videos |


[click to expand]

The average co-op maintenance in Manhattan was $1.68 per month in 4Q12. I got a call from Robert Frank at CNBC who was researching maintenance charges for their new reality show – tonight’s show features a $95M co-op listing overlooking Central Park with a large terrace and a $60,000 per month maintenance charge. At nearly 8,000 square feet, that’s $7.50 per square foot per month or 4.5x the Manhattan average co-op maintenance per square foot.

To watch everyone on CNBC’s Sqwawkbox oooh and ahhhhh over the listing, check out the video as well as Robert Frank’s post on maintenance charges.

It remains to be seen whether the market supports the price but whatever the price paid or whoever the buyer is, rest assured they will pay all cash and probably won’t live in it full time.

Tags: ,


[Rotate!] Manhattan Housing Market Absorption by Price (3/09 to 8/12)

September 6, 2012 | 6:30 am | Charts |

My first rotating gif!

Geekcitement aside, I placed 42 months worth of charts into one graphic to show the ebb and flow of the market. The chart is based on the ongoing absorption releases here on Matrix. The charts reflect the number of months to sell all active listing inventory at the annualized pace of sales (closed) activity.

I deliberately did not make the GIF a loop so you can tell when it starts (3/09).

Refresh your browser to see it again.

Tags: , ,

Get Weekly Insights and Research

Housing Notes by Jonathan Miller

Receive Jonathan Miller's 'Housing Notes' and get regular market insights, the market report series for Douglas Elliman Real Estate as well as interviews, columns, blog posts and other content.

Follow Jonathan on Twitter

#Housing analyst, #realestate, #appraiser, podcaster/blogger, non-economist, Miller Samuel CEO, family man, maker of snow and lobster fisherman (order varies)
NYC CT Hamptons DC Miami LA Aspen
millersamuel.com/housing-notes
Joined October 2007