Matrix Blog

Posts Tagged ‘Affordability’

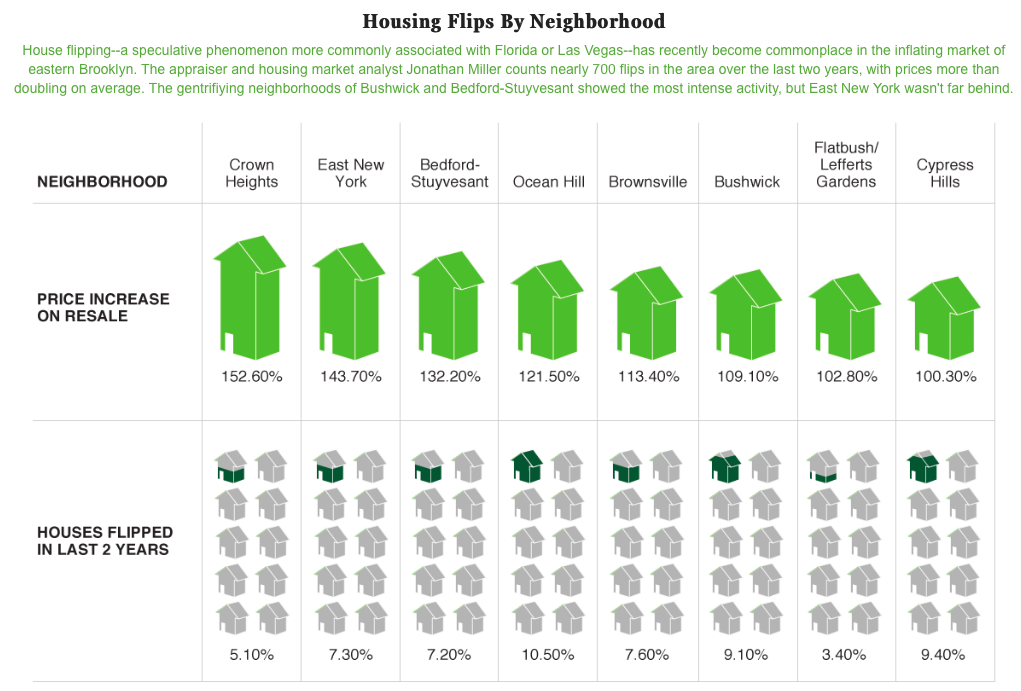
Flipping Out About East Brooklyn’s Gentrification

January 28, 2015 | 9:59 pm | | Charts |

1-2015nymagflipinfogrph
[click to expand]

This infographic was part of an epic must-read Andrew Rice piece for New York Magazine called: The Red Hot Rubble of East New York which explores the gentrification frontier where investors and New York City’s efforts to create affordable housing are running headlong into each other.

As much as 10% of the property sales are flips and prices are up 150% over the past 2 years.

Tags: , , , , , ,


VIDEO: Fox Business Risk & Reward w/ Deirdre Bolton 12-31-14

December 31, 2014 | 5:42 pm | | TV, Videos |

Came into the city on the last day of 2014 to join Deirdre Bolton on her Fox Business show Risk & Reward to talk housing rents and 2015 with a dash of $50M+ sales in New York. Always fun.

Tags: , ,


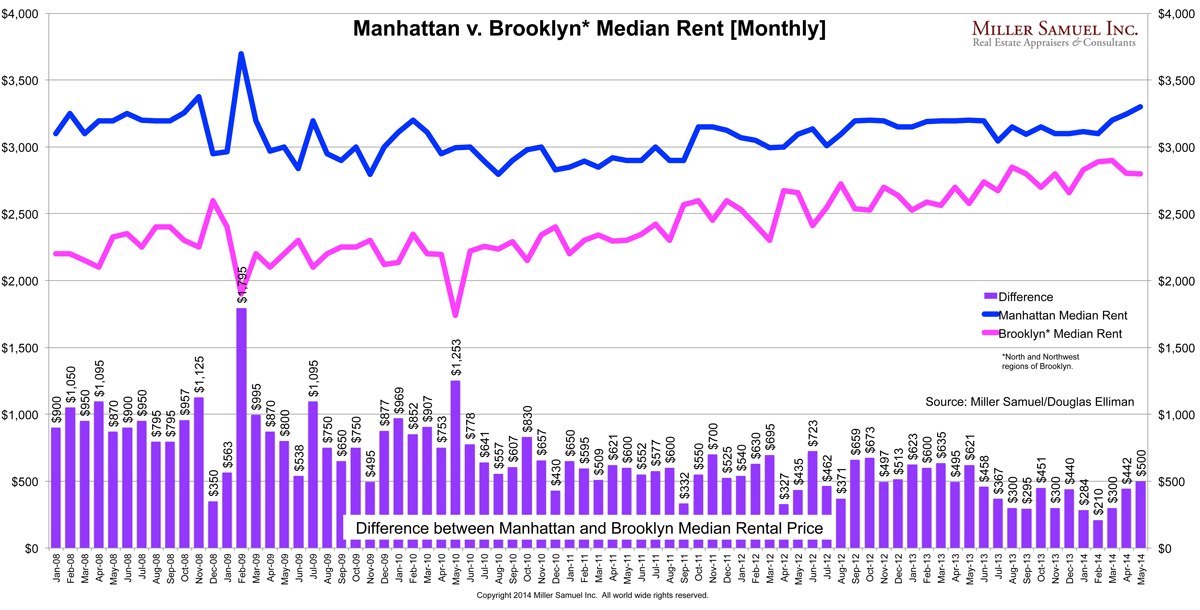
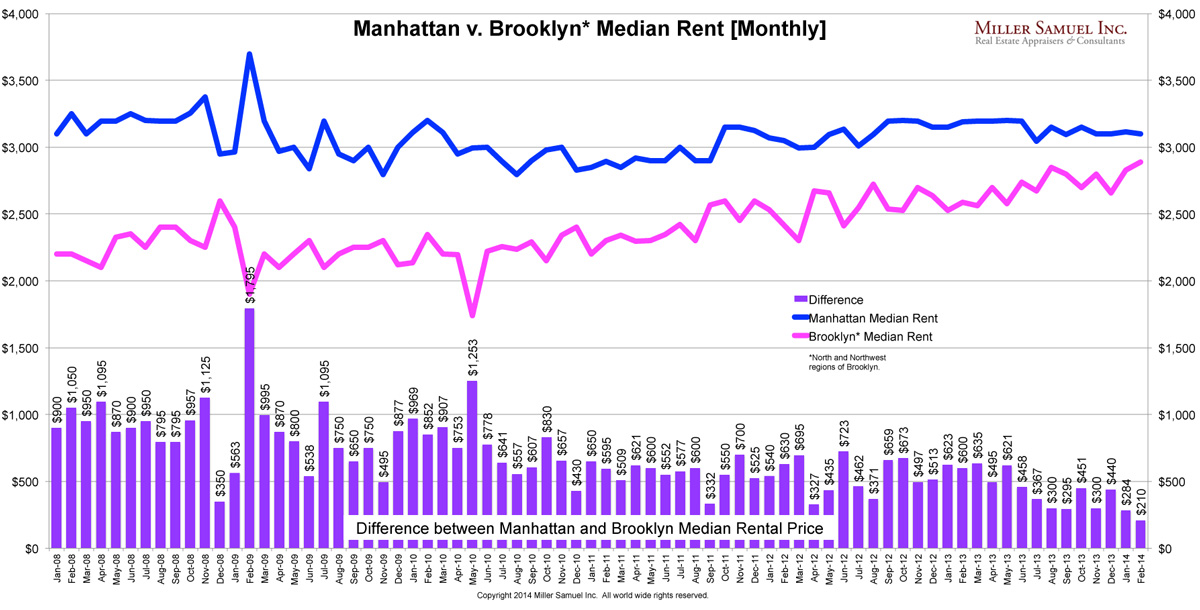
Manhattan-Brooklyn Rental Price Spread Widens to $500

June 12, 2014 | 3:15 pm | | Charts |

2014-5Brooklyn-Manhspread
[click to expand]

The report we author for Douglas Elliman covering the Manhattan/Brooklyn rental markets was published today.

Back in February many observers of the Manhattan and Brooklyn rental markets were saying: “The Spread is Dead, Long Live the Spread!” Ok not really.

But there was a lot made of the fact that the difference in median rental price between the two markets narrowed to $210 from as much as $1,125 in 2008. Manhattan rental prices had stabilized at the end of last year as Brooklyn continued to see sharp gains.

But that was as close as it got. Since the beginning of the year, month-over-month Manhattan rental prices began to rise as Brooklyn started to level off.

Manhattan rents cooled last year as the sales market poached demand from record volume. I saw the decline was temporary. The excess purchase activity from several years of pent-up demand has largely been absorbed allowing rents to begin climbing again.

Brooklyn rents are beginning to level off as a result of all the new rental development entering the market soaking up demand.

Tags:


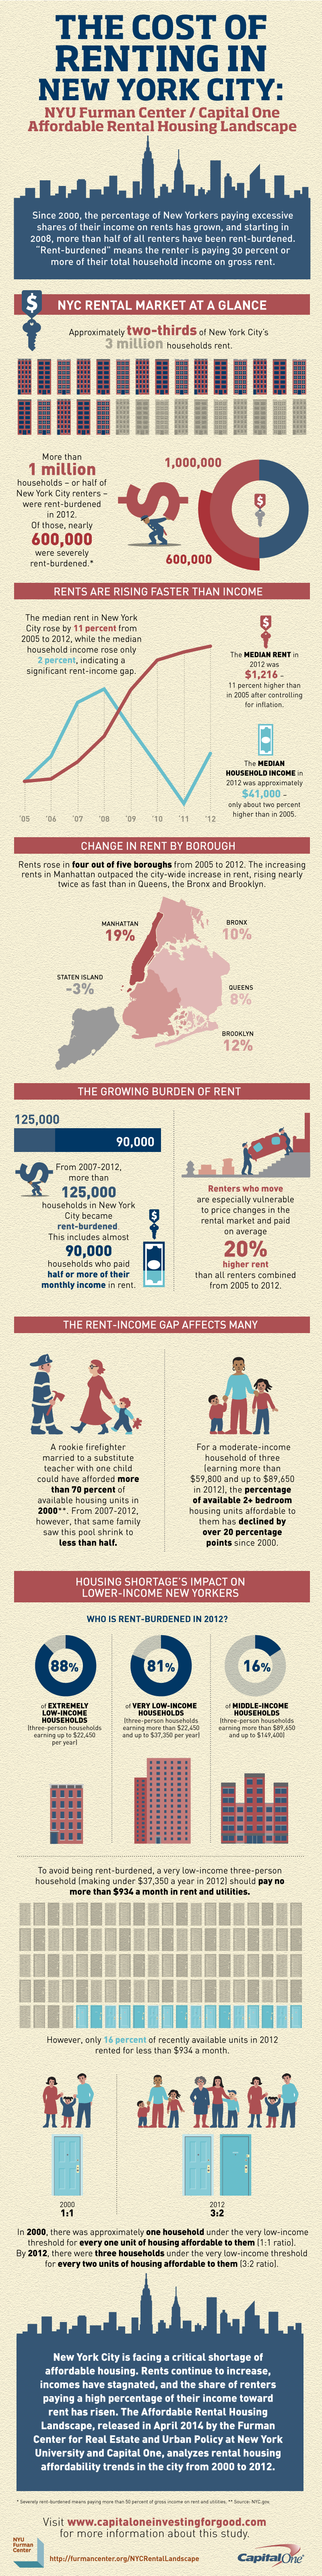
[Infographic] NYU Furman on Cost of Renting in NYC

April 25, 2014 | 9:28 am | |

The NYU Furman Center goes infographic on us with an illustrated story of the falling affordability of NYC rentals – 2/3 of the city is rental.

2014nycrentingNYUFurman

Tags: , , , ,


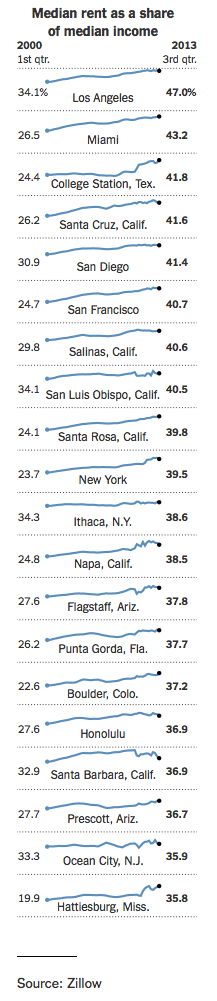
With Mortgage Lending Historically Tight, Renters Suffer Just As Much

April 15, 2014 | 4:19 pm | |

nytrentafford4-14

There was a good article in the New York Times yesterday: In Many Cities, Rent Is Rising Out of Reach of Middle Class

Many have complained about the Federal Government’s (and our society’s) overselling of homeownership over the past decade and how the decline in homeownership will eventually lead to an emphasis on rentals in the US. Of course, like many housing market ideas, good and bad, they tend to be presented in a vacuum, without real context.

I believe much of this discourse is in reaction to tight credit combined with a weak economy rather than some sort of fundamental cultural and economic shift. During the bubble we got the opposite discourse – that there was a fundamental cultural and economic shift towards homeownership.

Currently there is a much smaller subset of Americans that have access to financing. According to the Federal Reserve Senior Loan Officer Survey, lending has actually tightened in 2014 over 2013 (related to QM). Many homeowners are unable to sell because they can no longer buy and many renters no longer qualify for financing so the idea of of homeownership as a goal fades.

Case in point has been the recent public discourse on the issue of home affordability, whether it be sales or rentals. Zillow presented an analysis for the New York Times that illustrates how much rents have risen in the past 13 years (since 2000) in cities across the US.

Here’s the scenario:

The economy is weak – we are seeing tepid growth in employment, stagnant incomes and historically tight residential mortgage lending.

  • Approximately 38% of homeowners can’t buy their next home so they won’t list their home for sale.
  • Buyers without credit issues won’t list their homes until they can find something to buy.
  • The lack of supply presses prices higher because those who have access to credit have little inventory to choose from, driving up prices.
  • Renters looking to buy can’t find a home they want to purchase so they are kept in the rental market.
  • Renters looking to buy don’t qualify for a mortgage so they stay in the rental market.

The organic flow out of the rental market into the sales market is slowed and a log jam is created of too many renters and not enough buyers.

Rising rents against stagnant incomes creates an affordability crisis. The sales and rental markets are connected. They are not mutually exclusive.

Rising rents are a product of tight credit, which is a residual byproduct of the financial crisis. Fix the economy and credit eases, then lending normalizes (no, not circa ’06) and the pressure on rental housing is eased.

ASIDE I’m not entirely confident with the reliability of the historical rental data being presented to the New York Times by Zillow – but I still agree that affordability is being pressured:
– Zillow was launched circa 2006 and rents are not public record so the early data has to be super thin.
– The comparison was made between a first quarter (low) and a third quarter (high) in a highly seasonal market.
– I am not sure if “New York” means Manhattan or New York City. If it is Manhattan, then our median rent figure in 1Q 2000 was $2,600 in nominal terms, and $4,276 in real terms. In nominal (unadjusted for inflation) terms, rents have risen 23.1% through 3Q 2013 while real median rent has fallen 27.3%. The Zillow median rent as share of median income nearly doubled, rising from 23.7% to 39.5%. Either incomes have collapsed in NYC or the 2000 rental figure being punched into their model is flawed, ie way low, no?

Other inights on any of this would be appreciated.

Tags: , , , , ,


Brooklyn Rentals: Coolness doesn’t come free

April 11, 2014 | 10:07 am | Public |

4-2014qzmanhattan-brooklyn-rentspread [Source: Quartz]

Rob Ferdman over at Quartz writes a great breakdown of the narrowing rental spread between Manhattan and Brooklyn using the data I crunch for The Elliman Report: Manhattan & Brooklyn Rentals. Here’s my version of the chart.

After I designated last week’s Bloomberg story headline “Brooklyn’s Hipster Economy Challenges Manhattan Supremacy” as my favorite new phrase, specifically:

Brooklyn’s Hipster Economy

Quartz has given me a new favorite phrase (see under original chart):

Coolness doesn’t come free

.

Tags: , , ,


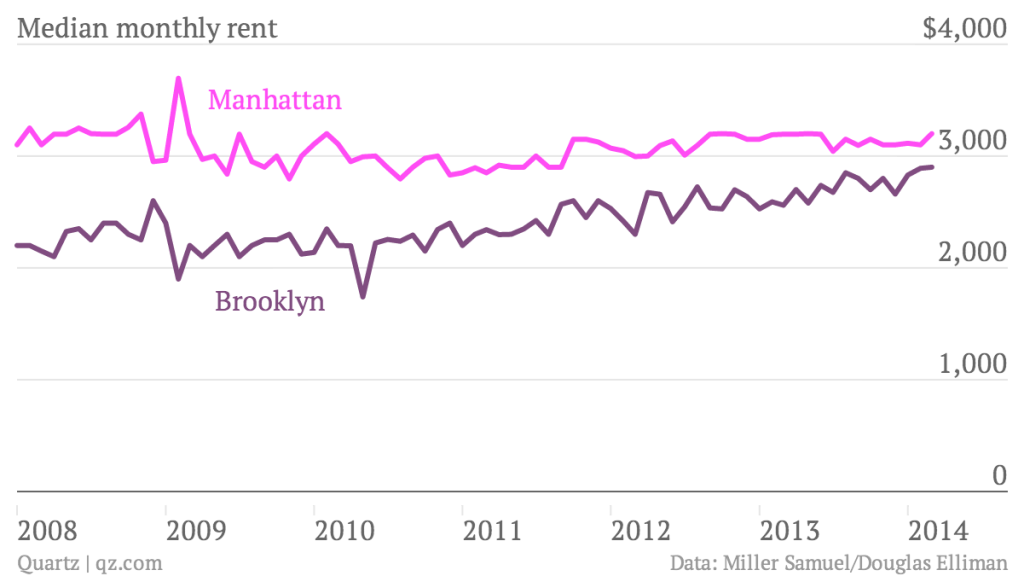
The Manhattan & Brooklyn Rentals Side-by-Side Trend Comparison

March 20, 2014 | 12:50 pm |

Given the discussion about the narrowing gap between the Manhattan and Brooklyn Rental markets, I thought I’d place the rental price trends side by side to get a sense of how the two markets match up.

Manhattan
While the year-over-year Manhattan rental numbers have fallen short of the prior year, rents have remained fairly stable over the past 6 months:

2014-2Manhattan-medianYoY
[Click to expand]

Brooklyn
Brooklyn rental prices have been trending sharply higher to the point where the rental price spread between the two markets is at it’s lowest level every recorded (since 1/2008):

2014-2Brooklyn-medianYoY
[Click to expand]

Tags: ,


[Chart] The Manhattan-Brooklyn Median Rental Price Smackdown

March 15, 2014 | 1:57 pm | | Charts |

2014-2MBmedianspread

The rental price spread between Brooklyn and Manhattan is narrowing. At $210, the month of February saw the lowest differential between the median rental price of Manhattan and Brooklyn’s North and Northwest regions.

While Manhattan rents have leveled off, Brooklyn rents have continued to rise sharply – a combination of rising demand as well as a shift in the mix towards luxury rentals.

A decade ago, who would have thought we’d be talking about Brooklyn this way?

Tags:


Its Still the Wild West; Kansas on the Cheap

August 15, 2005 | 3:36 pm |

NAR: Housing Affordability Index Down in Second Quarter, Still Favorable

Affordability was largely favorable in the second quarter but higher home prices and mortgage rates more than offset the increase in family income. The West Region shows both higher prices and more highly leveraged transactions. Kansas had the highest affordability for home ownership.

NOTE: This table shows the approximate home price a family earning the specified income could afford making a 20 percent downpayment, with no more that 25 percent of gross income for principal and interest payments. Variables include the type of loan and interest rate.

While the national median sales price of a US home was reported to be $218,900 in June 2005, there was great disparity in the 4 regions covered: Northeast, Midwest, South and West.

  • Northeast $247,500 (21.8%)
  • Midwest $174,500 (16.2%
  • South $190,900 (20.6%)
  • West $322,200 (30.9%)

The West saw an 85% higher median sales price in June than the Midwest did. Not only does the West region have the highest housing prices, but has the highest payment level as a percentage of income, roughly 50% more than the other regions.

A urban development think tank ranked housing affordability by state using median sales price and median household income for 1970 and 2000. They contend that denser urban areas that control growth generally have higher prices.

Kansas was the most affordable place to own a home in the US. Hawaii was the least affordable, nearly 2.7 times that of Kansas.


Tags: , , ,

Get Weekly Insights and Research

Receive Jonathan Miller's 'Housing Notes' and get regular market insights, the market report series for Douglas Elliman Real Estate as well as interviews, columns, blog posts and other content.

Follow Jonathan on Twitter

#Housing analyst, #realestate, #appraiser, podcaster/blogger, non-economist, Miller Samuel CEO, family man, maker of snow and lobster fisherman (order varies)
NYC CT Hamptons DC Miami LA Aspen
millersamuel.com/housing-notes
Joined October 2007