Skip to content
Services
Appraisals
Consulting
Resources
Market Reports
Charts
Matrix Blog
Articles & Research
Press
About
get in touch
Charts
› Square Footage
January 3, 2018
Development, Construction, Architecture & Land
,
Manhattan
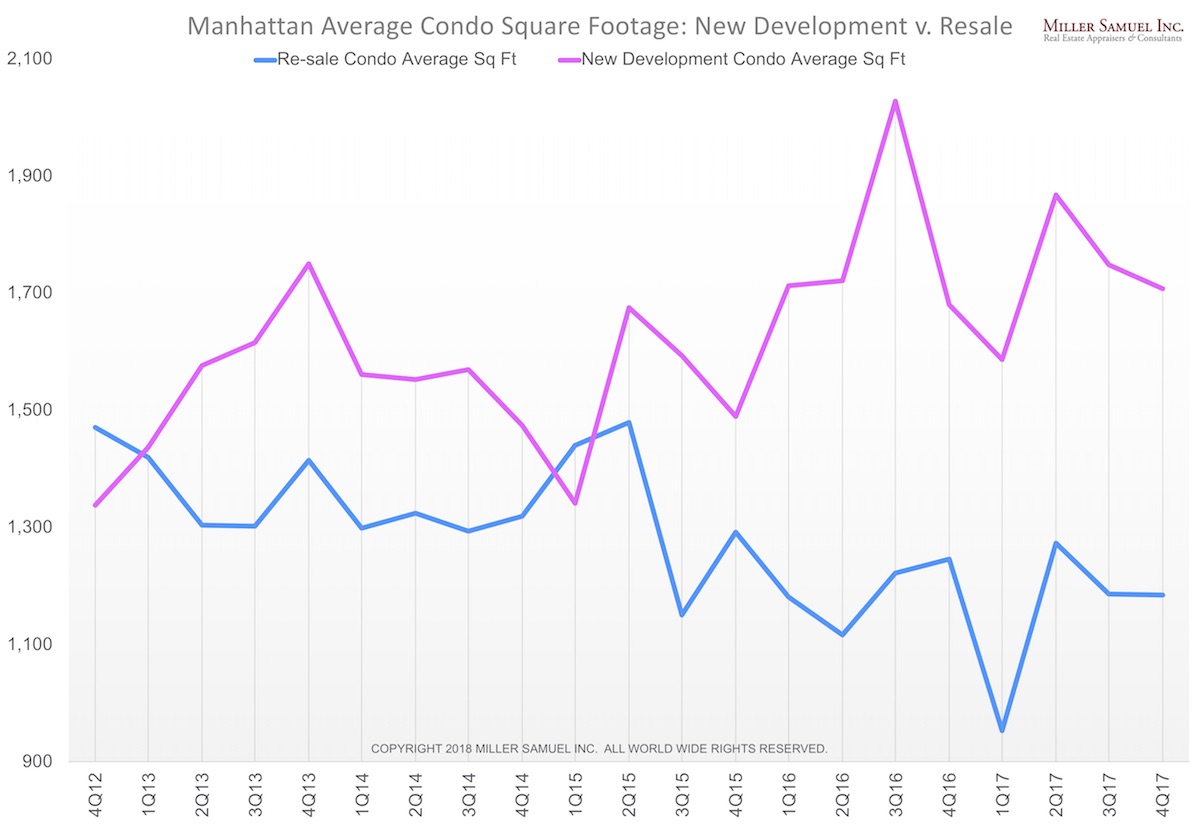
New Manhattan Condos Got Really Big Over The Past Three Years
read more
April 26, 2015
Amenities, Adjustments & Value Logic
,
Bloomberg View
,
Charts, Maps, Images, Infographics, Video
,
Housing Trends & Cycles
Bloomberg View Column: House Rich, Land Poor
read more
June 9, 2014
Charts, Maps, Images, Infographics, Video
,
Distressed Housing
,
Housing Trends & Cycles
,
Op-Ed
,
Statistics, Metrics & Data
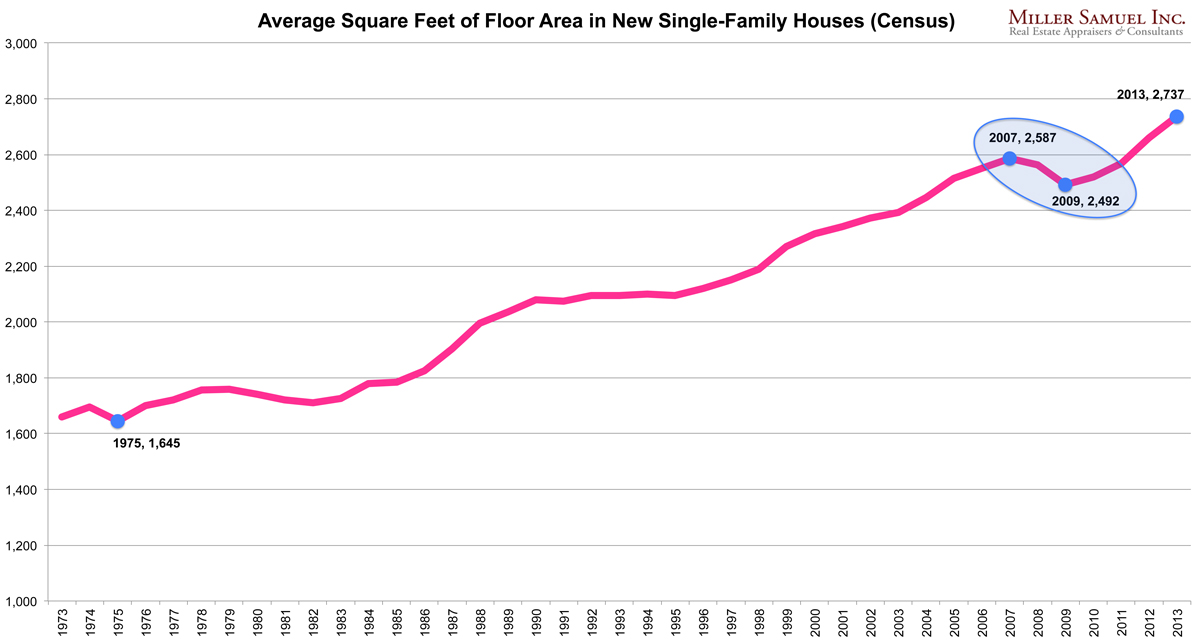
Trends in Home Size and Home Ownership React to Economic Conditions, Not Taste
read more
March 23, 2014
Appraising
,
Social, Tech, Gadgets, Software
[AppWatch] RoomScan – An Easy Way to Create A Floorplan
read more
September 15, 2005
Brokers, Agents, MLS, NAR
,
Development, Construction, Architecture & Land
,
IRS
,
Migration, Psychology, Demographics
,
Weather & Natural Disasters
Length x Width Is Negotiable
read more
Page load link
Go to Top