Skip to content
Services
Appraisals
Consulting
Resources
Market Reports
Charts
Matrix Blog
Articles & Research
Press
About
get in touch
Charts
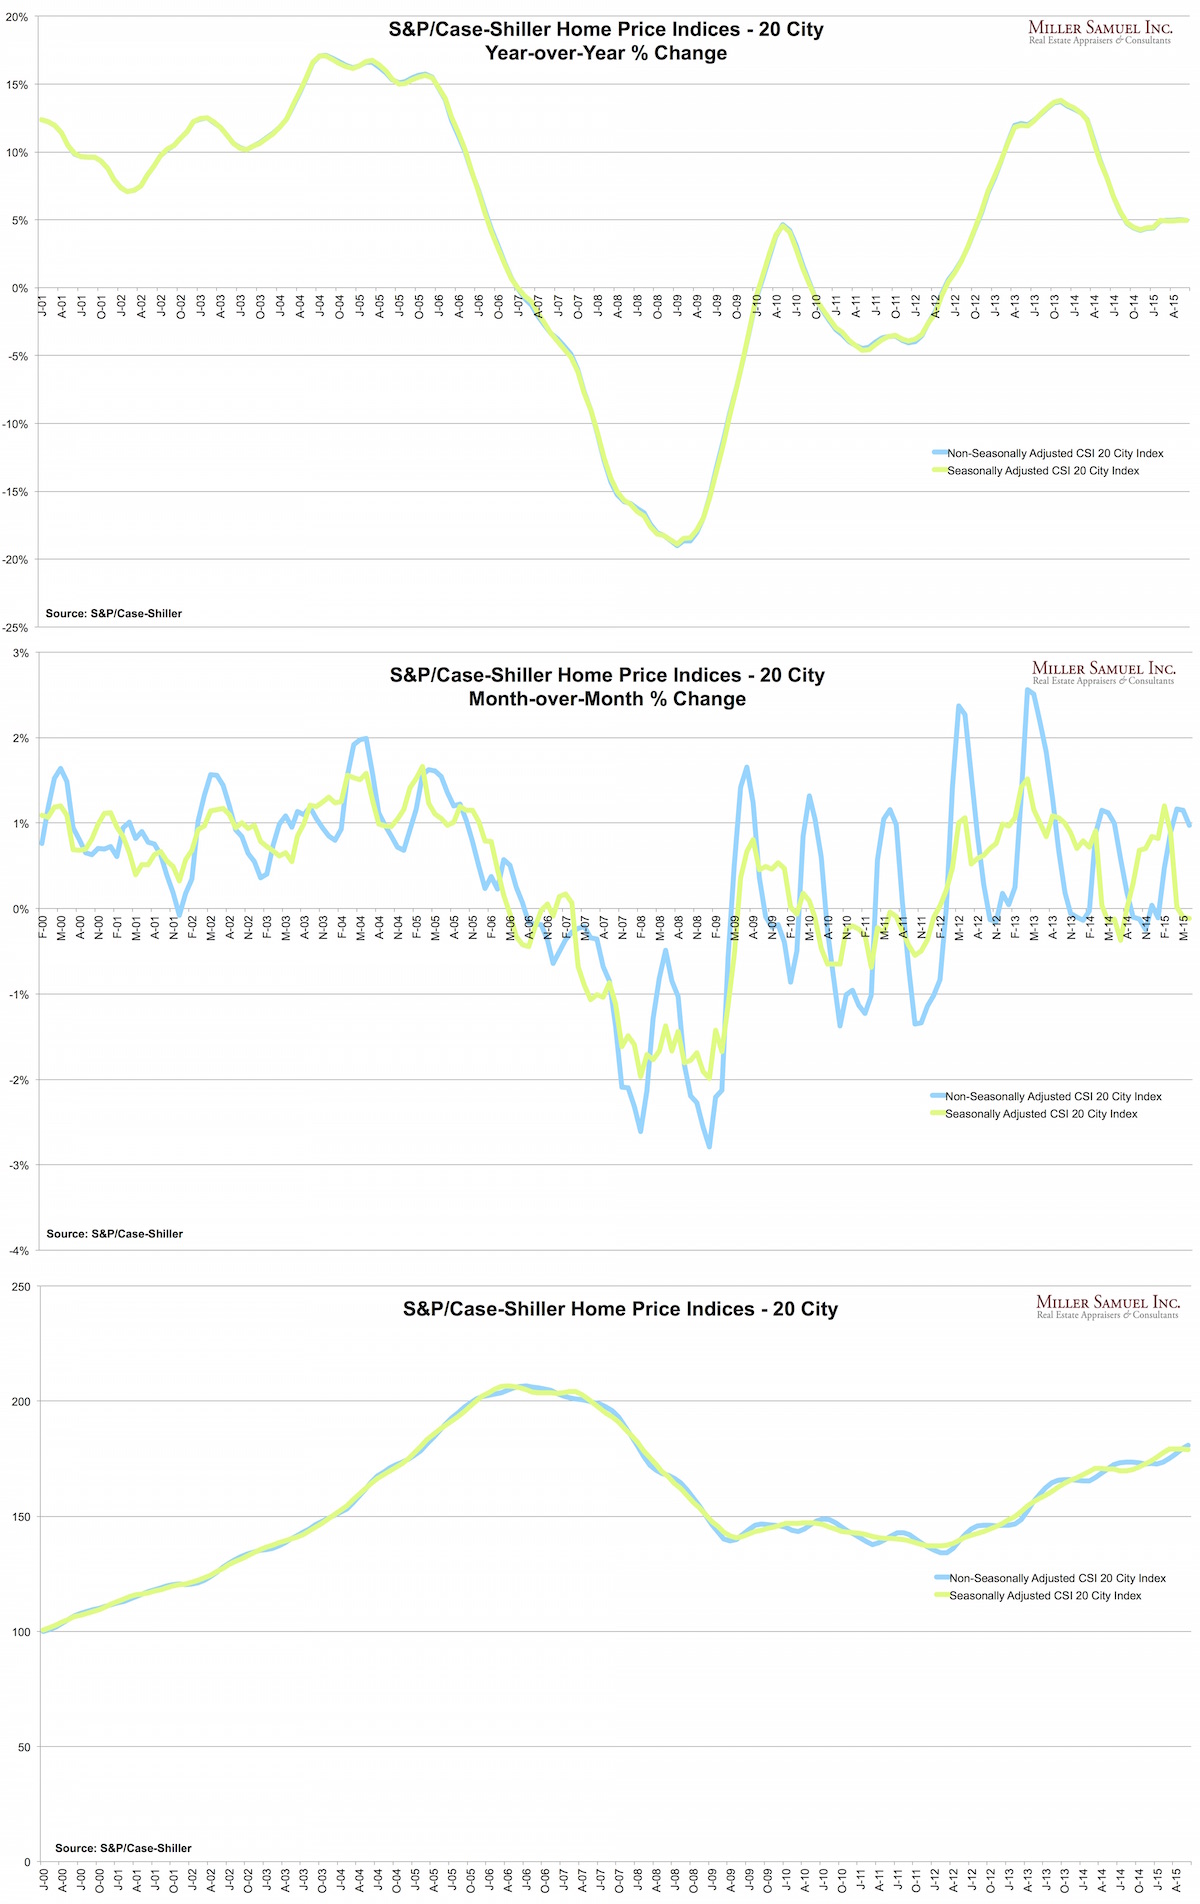
› S&P/Case-Shiller 20-City index
November 30, 2016
Charts, Maps, Images, Infographics, Video
,
Historical, Landmark, Milestone
,
Housing Indices & Portals
Declaring A Housing Recovery Using A Threshold Based on Fraud
read more
August 25, 2015
Analysis & Research
,
Charts, Maps, Images, Infographics, Video
,
Housing Indices & Portals
Explainer: Three Ways to Look at S&P/Case-Shiller Index Results
read more
June 3, 2015
Affordability, Affordable Housing
,
Bloomberg View
,
Charts, Maps, Images, Infographics, Video
,
Economy
,
Government, Politics, Regulations & Policy
,
Rentals, Investing
,
Sales
,
Suburban, Urban, Commuting
Bloomberg View Column: Costly City Housing Is an Economic Drag
read more
Page load link
Go to Top